Embed Size (px)
Citation preview

Dennis D. Embry, Ph.D.President/Senior ScientistPAXIS Institute
Crea%ng an Evidence-‐Based Approach to Lifespan Suicide Preven%on
1Monday, April 15, 13

38,000
2Monday, April 15, 13
The Polio Epidemic
3Monday, April 15, 13

The Polio Epidemic
3Monday, April 15, 13

The Polio Epidemic
3,000
3Monday, April 15, 13

A recent webinarexperienceon the topic
4Monday, April 15, 13
5Monday, April 15, 13

Is this earlyprevention?
5Monday, April 15, 13
6Monday, April 15, 13

Is this earlyprevention?
6Monday, April 15, 13

7Monday, April 15, 13

Is this earlyprevention?
7Monday, April 15, 13

8Monday, April 15, 13

Is this earlyprevention?
8Monday, April 15, 13

Thinking way upstreamWhat might be the early malleable predictors?
What if we startedhere with early
suicide prevention?
9Monday, April 15, 13

Thinking way upstreamWhat might be the early malleable predictors?Could we actually change those predictors easily and reliably?And what else might change as a consequence of the prevention or protection strategies.
10Monday, April 15, 13

risk factors during development from early childhood to adolescence
Psychiatric problems in childhood and/or adolescence, including depression
Child and/or adolescent externalizing disorders
Childhood adversity (especially with the above)
Low self-efficacy
Aggressive or delinquent behavior
Poor peer relations
Prax Kinderpsychol Kinderpsychiatr. 2012;61(1):32-49.
11Monday, April 15, 13

risk factors during development from early childhood to adolescence
Psychiatric problems in childhood and/or adolescence, including depression
Child and/or adolescent externalizing disorders
Childhood adversity (especially with the above)
Low self-efficacy
Aggressive or delinquent behavior
Poor peer relations
Prax Kinderpsychol Kinderpsychiatr. 2012;61(1):32-49.
And prenatal and post-natal
11Monday, April 15, 13

Thinking way upstreamWhat might be the early malleable predictors?Could we actually change those predictors easily and reliably?And what else might change as a consequence of the prevention or protection strategies.
12Monday, April 15, 13

Surveying the Past Foretells Our Futures 13Monday, April 15, 13

Consider the cohort trends…#1 mental health disorder
14Monday, April 15, 13

Consider the cohort trends…#1 mental health disorder
14Monday, April 15, 13

Consider the cohort trends…#1 mental health disorder
Born NOW?
14Monday, April 15, 13

Consider the cohort trends…#1 mental health disorder
Born NOW?
14Monday, April 15, 13
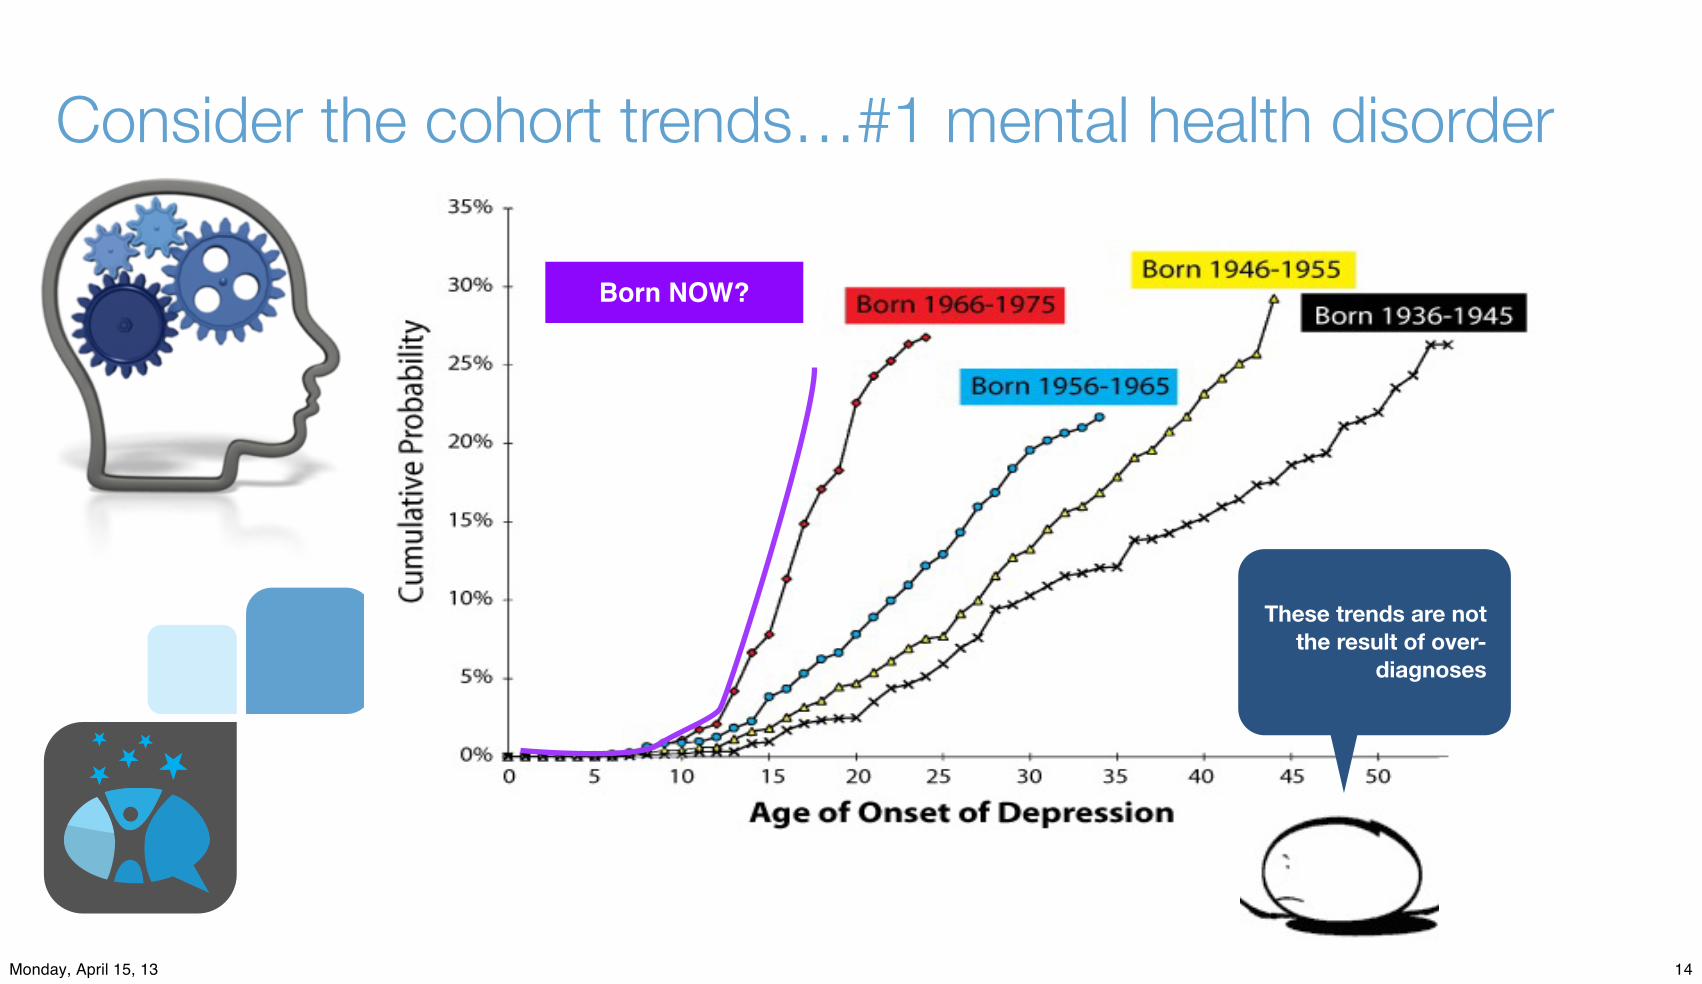
Consider the cohort trends…#1 mental health disorder
Born NOW?
These trends are not the result of over-
diagnoses
14Monday, April 15, 13

Copyright © 2012-2013, PAXIS Institute. May be reproduced in entirety with copyright notice • 1-877-GO-PAXIS • www.paxis.org
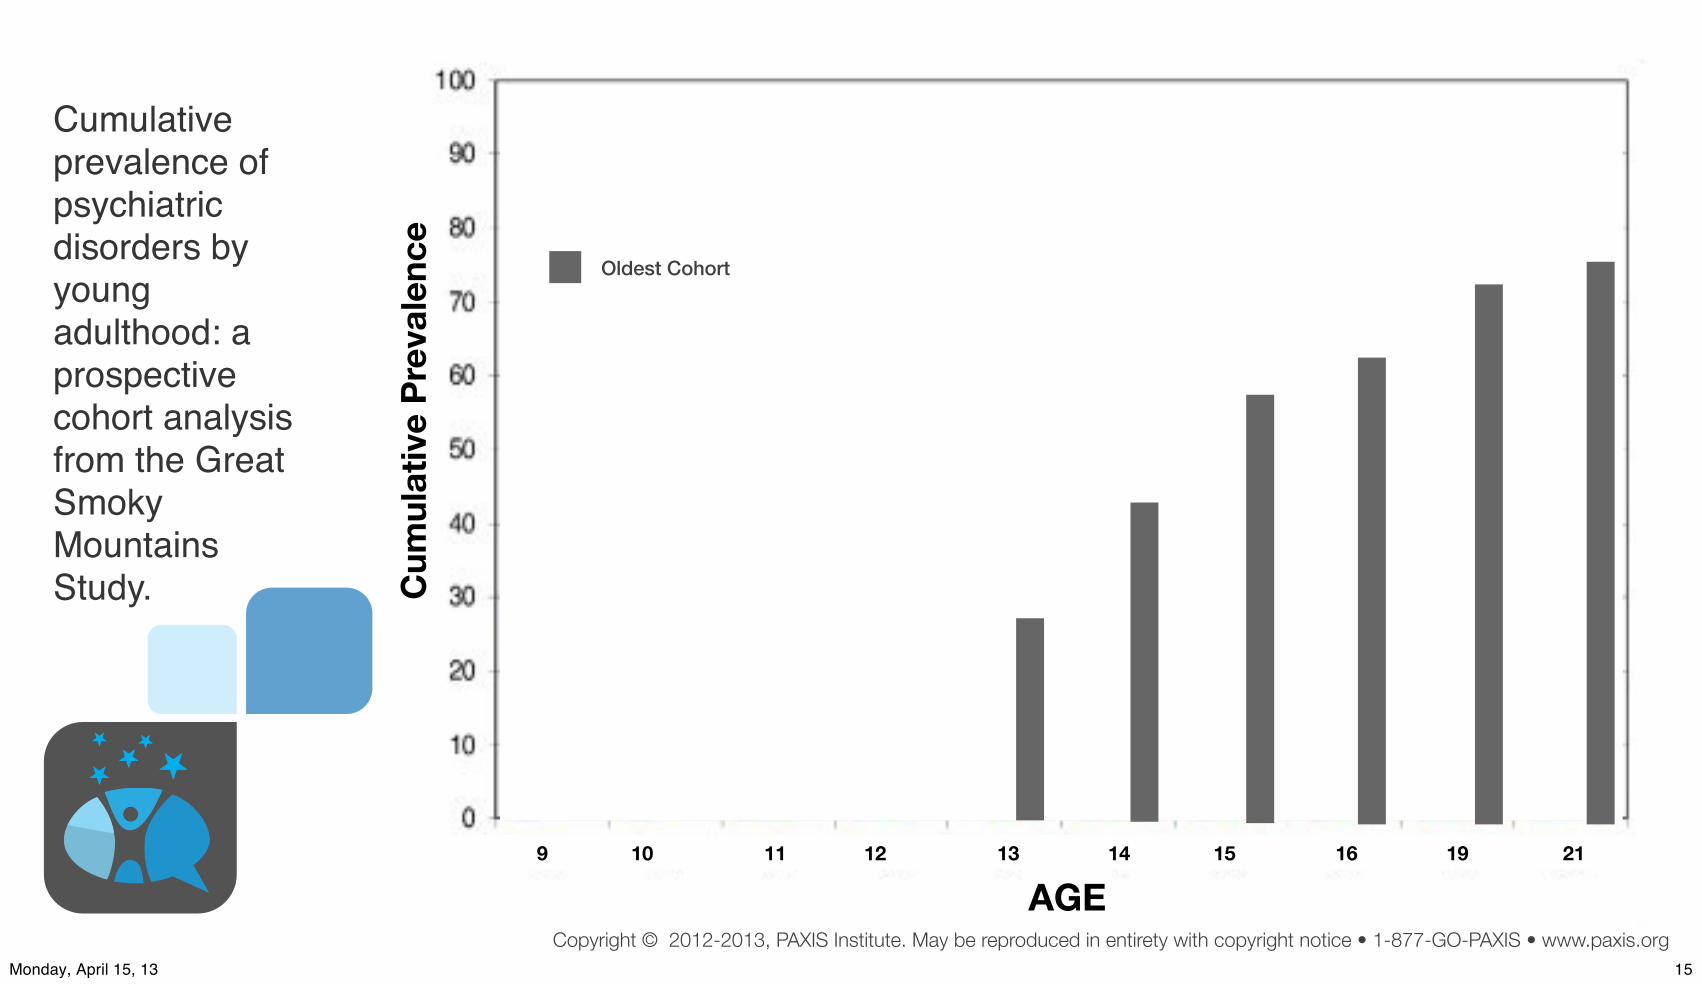
Cumulative prevalence of psychiatric disorders by young adulthood: a prospective cohort analysis from the Great Smoky Mountains Study.
C
umul
ativ
e Pr
eval
ence
AGE9 10 11 12 13 14 15 16 19 21
15Monday, April 15, 13
Copyright © 2012-2013, PAXIS Institute. May be reproduced in entirety with copyright notice • 1-877-GO-PAXIS • www.paxis.org
Cumulative prevalence of psychiatric disorders by young adulthood: a prospective cohort analysis from the Great Smoky Mountains Study.
Oldest Cohort
C
umul
ativ
e Pr
eval
ence
AGE9 10 11 12 13 14 15 16 19 21
15Monday, April 15, 13

Copyright © 2012-2013, PAXIS Institute. May be reproduced in entirety with copyright notice • 1-877-GO-PAXIS • www.paxis.org
Cumulative prevalence of psychiatric disorders by young adulthood: a prospective cohort analysis from the Great Smoky Mountains Study.
Middle Cohort
Oldest Cohort
C
umul
ativ
e Pr
eval
ence
AGE9 10 11 12 13 14 15 16 19 21
15Monday, April 15, 13

Copyright © 2012-2013, PAXIS Institute. May be reproduced in entirety with copyright notice • 1-877-GO-PAXIS • www.paxis.org
Cumulative prevalence of psychiatric disorders by young adulthood: a prospective cohort analysis from the Great Smoky Mountains Study.
Youngest Cohort
Middle Cohort
Oldest Cohort
EARLIER START;Higher Prevalence
C
umul
ativ
e Pr
eval
ence
AGE9 10 11 12 13 14 15 16 19 21
15Monday, April 15, 13

Copyright © 2012-2013, PAXIS Institute. May be reproduced in entirety with copyright notice • 1-877-GO-PAXIS • www.paxis.org
Lifetime Prevalence of Disorders in US Adolescents (N=10,123)
40%
35%
30%
25%
20%
15%
10%
5%
0%4 5 6 7 8 9 10 11 12 13 14 15 16 17 18
Age in Years
Merikangas et al., 2010
16Monday, April 15, 13

Copyright © 2012-2013, PAXIS Institute. May be reproduced in entirety with copyright notice • 1-877-GO-PAXIS • www.paxis.org
Lifetime Prevalence of Disorders in US Adolescents (N=10,123)
40%
35%
30%
25%
20%
15%
10%
5%
0%4 5 6 7 8 9 10 11 12 13 14 15 16 17 18
Age in Years
Anxiety
Behavior
Mood
Merikangas et al., 2010
16Monday, April 15, 13

Copyright © 2012-2013, PAXIS Institute. May be reproduced in entirety with copyright notice • 1-877-GO-PAXIS • www.paxis.org
Lifetime Prevalence of Disorders in US Adolescents (N=10,123)
40%
35%
30%
25%
20%
15%
10%
5%
0%4 5 6 7 8 9 10 11 12 13 14 15 16 17 18
Age in Years
Anxiety
SubstanceBehavior
Mood
Merikangas et al., 2010
1-out-2 USA young adults will be afflicted with
one or more of these disorders
by age 18
NOTE EARLY START
16Monday, April 15, 13

The US had 75 million children and teens 2009
Wall Street Journal,
12-28-2010
17Monday, April 15, 13

The US had 75 million children and teens 2009
Wall Street Journal,
12-28-2010
40.4 million kids had one psychotropic med in 2009
17Monday, April 15, 13

Copyright © 2012-2013, PAXIS Institute. May be reproduced in entirety with copyright notice • 1-877-GO-PAXIS • www.paxis.org
How many of you know a blue-collar, middle-class, or upper-class family who is reasonably intact…
18Monday, April 15, 13

Copyright © 2012-2013, PAXIS Institute. May be reproduced in entirety with copyright notice • 1-877-GO-PAXIS • www.paxis.org
How many of you know a blue-collar, middle-class, or upper-class family who is reasonably intact…
with a child, teen, or adult child with a mental, emotional, or behavioral disorder?
18Monday, April 15, 13

How do we handle this problem of mental illnesses?
19Monday, April 15, 13

How do we handle this problem of mental illnesses?
Prevalence rates are increasing
rapidly in North America
19Monday, April 15, 13

Copyright © 2012-2013, PAXIS Institute. May be reproduced in entirety with copyright notice • 1-877-GO-PAXIS • www.paxis.org
IL6 DNARNA
Poor Health
Inspirational Credit: Clyde Hertzman
Epigenetic Changes
Common set of conditions producing these negative trends…
20Monday, April 15, 13

Copyright © 2012-2013, PAXIS Institute. May be reproduced in entirety with copyright notice • 1-877-GO-PAXIS • www.paxis.org
IL6 DNARNA
Poor Health
Inspirational Credit: Clyde Hertzman
Epigenetic Changes
Common set of conditions producing these negative trends…
High Reinforcement of Anti-Social Behavior
HIgh Exposure to Problematic Behaviors
HIgh Exposure to Toxic Influences/ACEs
Exposure to Low Psychological Flexibility
•Mental Disorders
• Emotional Disorders
• Behavioral Disorders
• Related Physical Disorders
Evolutionary Adaptations toa Predatory, Stressful World;worse social determinants
20Monday, April 15, 13

Physiologicalinfluences triggeradverse biological
mechanisms
Reinforcementmore for anti-social
than prosocialbehaviors
Antecedentscue anti-social
acts and threats
Verbal Relationsoccasion perceivedthreats and related
reactions
Major Connected Causes of the Adverse Trends Predicting MEBs & Related Illnesses
Multi-Inflammatory Brain & Body Response
The Same Mismatches Predict Multiple MACH Disorders21Monday, April 15, 13

MoodInstability Inattention Lo Reward
DelayLo ExecutiveFunction
Lo BehavioralCompetencies
PoorMotorSkills
Immune-Healing
Dysfunction
Physiologicalinfluences triggeradverse biological
mechanisms
Reinforcementmore for anti-social
than prosocialbehaviors
Antecedentscue anti-social
acts and threats
Verbal Relationsoccasion perceivedthreats and related
reactions
Major Connected Causes of the Adverse Trends Predicting MEBs & Related Illnesses
Mental Illness SubstanceAbuse Violence Work
ProblemsObesity,
etc CancerEarlySex
School Failure
STD’s SpecialEdMulti-Inflammatory Brain & Body Response
The Same Mismatches Predict Multiple MACH Disorders21Monday, April 15, 13

1491 ADOriginalHumanMigrations to
North America 30,000,000Souls in
North America
300,000 Souls≈ ≈
Disease & War26,000 to 12,000 B.E. Extermination,Marginalization,& Suppression
The America’s First Peoples…
Residential Schools;
Western Diet
Evolutionary bottleneck
22Monday, April 15, 13

1491 ADOriginalHumanMigrations to
North America 30,000,000Souls in
North America
300,000 Souls≈ ≈ Today
Disease & War26,000 to 12,000 B.E. Extermination,Marginalization,& Suppression
The America’s First Peoples…
Residential Schools;
Western Diet
Evolutionary bottleneck
22Monday, April 15, 13
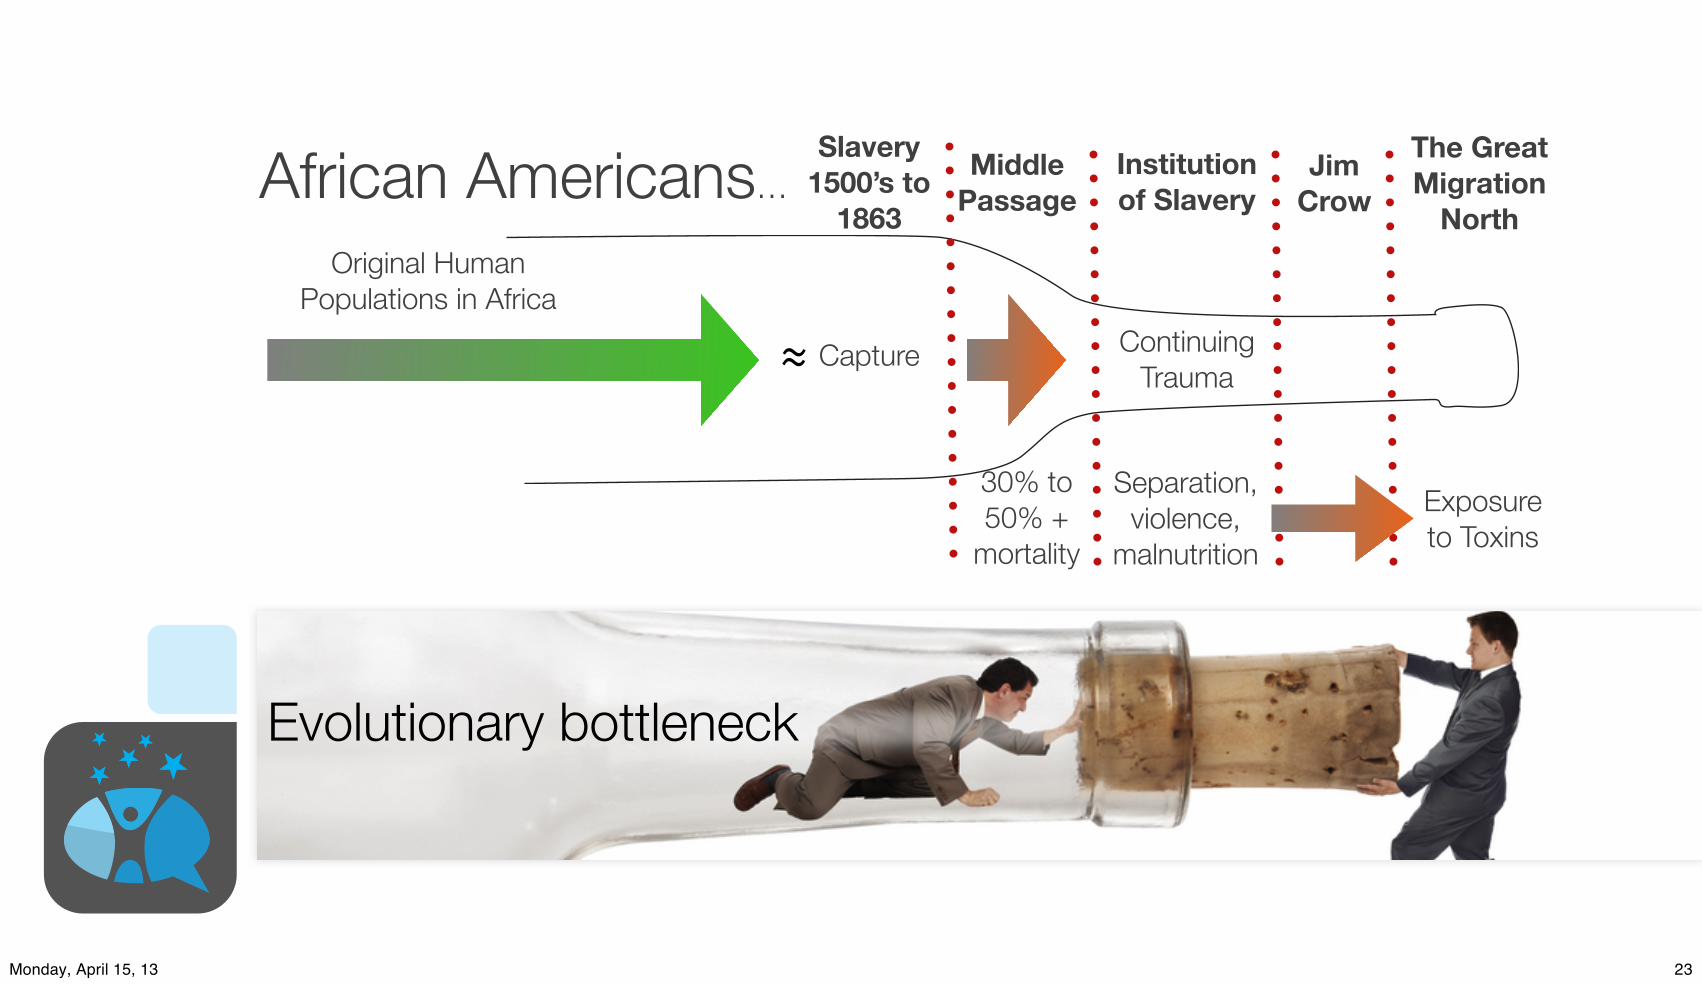
Slavery1500’s to
1863Original Human
Populations in Africa
Capture
30% to 50% +
mortality
≈
MiddlePassage
Continuing Trauma
Institutionof Slavery
Separation,violence,
malnutrition
JimCrowAfrican Americans…
Exposureto Toxins
The GreatMigration
North
Evolutionary bottleneck
23Monday, April 15, 13

Slavery1500’s to
1863Original Human
Populations in Africa
Capture
30% to 50% +
mortality
≈ today
MiddlePassage
Continuing Trauma
Institutionof Slavery
Separation,violence,
malnutrition
JimCrowAfrican Americans…
Exposureto Toxins
The GreatMigration
North
Evolutionary bottleneck
23Monday, April 15, 13

Example Lasting Effects of Evolutionary Bottlenecks
Political pundits say:
“Slavery is over. Jim Crow is over. Everybody should be over all this.”
Evolution is bigger than pundits, and epigensis is a solution to a past evolutionary problem that might come back. Evolution is conservative.
0%
10%
20%
30%
40%
Hi Blood Pressure Percentage
US Blacks Barbados St. Lucia JamaicaCameroon (urban) Cameroon (Rural) Nigeria (Rural)
Slavery Exposure No Slavery Exposure
Source: Scientific American, February, 1999
24Monday, April 15, 13

Add slide here about the epigenetic mechanisms; this shows how what children see, hear, do and feel in the brain,then cascades through neuro-hormones to change the genes.
This will show that micro-environments matter
Epigenetic
Factor
Health & Behavior
• Obesity, asthma, diabetes
• Early sex, pregnancy
• Violence, DSM-IV
• Cancer, auto-immune
Epigenetic Mechanisms• Nurturing environments
• Toxic environments
• Development/aging
Yes, the social andphysical environmentof humans changes
gene expression.
25Monday, April 15, 13

Ignore the problem? Pretend everything is fine?
Make everybody
mentally and physically healthier?
What shall we do?
26Monday, April 15, 13

Prev
alen
ce R
ate
Years
Past
Current Path of Mental, Emotional, and Behavioral DisordersPre-Conception
Pre-Natal
Infancy
Adulthood
Early Childhood
Elementary
Adolescence
Young Adults
PredictedFuture
Possible Futurewith PreventionScience
Trajectory of Mental, Behavioral, and Emotional Disorders(illustrative graph only)
First, Devise Early Wins NOW Across Age Groups
27Monday, April 15, 13

Prev
alen
ce R
ate
Years
Past
Current Path of Mental, Emotional, and Behavioral DisordersPre-Conception
Pre-Natal
Infancy
Adulthood
Early Childhood
Elementary
Adolescence
Young Adults
PredictedFuture
Possible Futurewith PreventionScience
Trajectory of Mental, Behavioral, and Emotional Disorders(illustrative graph only)
First, Devise Early Wins NOW Across Age Groups
28Monday, April 15, 13

Copyright © 2012-2013, PAXIS Institute. May be reproduced in entirety with copyright notice • 1-877-GO-PAXIS • www.paxis.org
IL6 DNARNAHealth
Inspirational Credit: Clyde Hertsman
Epigentic Changes
Conditions producing positive trends…
29Monday, April 15, 13

Copyright © 2012-2013, PAXIS Institute. May be reproduced in entirety with copyright notice • 1-877-GO-PAXIS • www.paxis.org
IL6 DNARNAHealth
Inspirational Credit: Clyde Hertsman
Epigentic Changes
Conditions producing positive trends…
High Reinforcement of Prosocial-Social Behavior
Low Exposure to Problematic Behaviors
Low Exposure to Toxic Influences
Exposure to High Psychological Flexibility
•Mental Health
• Emotional Health/Balance
• Behavioral Competence
• Related Physical Health
Evolutionary Adaptations toa Safe, Supportive World
29Monday, April 15, 13

UniversalAcccess to
Prevention &Promotion
Science
multiple outcome
focus
multiple age-stage
focus
Devise Early Wins NOW with multiple footprints
30Monday, April 15, 13

Pre-conception
Infancy, ChildhoodAdolescence
Young Adults & AdultsSeniors
Mental HealthEmotional Health
Physical Health
Cognitive Ability
Behavioral HealthUniversalAcccess to
Prevention &Promotion
Science
multiple outcome
focus
multiple age-stage
focus
Can improve multiple health outcomes for all ages
Devise Early Wins NOW with multiple footprints
31Monday, April 15, 13

Devise Early Wins NOW with multiple footprints
Pre-conception
Infancy, ChildhoodAdolescence
Young Adults & AdultsSeniors
Mental HealthEmotional Health
Physical Health
Cognitive Ability
Behavioral HealthNurturingEnvironmentsLogic Model forpopulation-level
benefits
IL6 DNARNAHealth
EpigensisInspirational Credit: Clyde Hertsman
ProsocialtyRich Reinforced
Low Problem Behaviors
Low ToxicIn!uences
PsychologicalFlexibility Better
Futuresfor All
UniversalAcccess to
Prevention &Promotion
Science
multiple outcome
focus
multiple age-stage
focus
Biglan, Flay, Embry, & Irwin, 2012
Can improve multiple health outcomes for all ages
32Monday, April 15, 13

Suicide Rates Not Evenly Distributed
33Monday, April 15, 13

Mothers and children in North America do not eat foods sufficient in Vitamin D
Mothers and children in North America do not get sufficient Vitamin D via sunlight
This evolutionary mismatch harms mental health
34Monday, April 15, 13

Mismatch, Latitude & Schizophrenia
both latitude and low temperature are highly significant(P< .001 in each case), the correlationwith infantmortalityis not significant at the .05 level. Moreover, the direction(sign) of the respective correlations of prevalence withlatitude and cold are consistent across all continents
and subgroups. In contrast, the direction of the correla-tion of prevalence with infant mortality is inconsistentacross different continents.The best-fit regression lines in figure 1 also suggest that
the increase in prevalence with increasing latitude occurs
Fig. 1. Schizophrenia Prevalence and Latitude by Continent and Infant Mortality.Note: SouthAsia siteswere from Indiaand Indonesia; those sites hadhigher infantmortality rates than all but one of theEastAsian sites. For theregressionlinesinNorthAmerica,thosewithinfantmortalityratesabove30per1000weregroupedashavingahigherrate, thosebelow30ashavinga lower rate.Theslopesof linear regression lineswere0.15 for theEastAsiansites, 0.22 for theAfricansites, 0.086 for theSouthAsiansites,0.14 fortheNorthAmericansiteswithlowerinfantmortality,0.51fortheNorthAmericansiteswithhigherinfantmortality,and0.48fortheEuropeansites.
Table 3. Correlations of Schizophrenia Prevalence with Predictor Variables
Geographic Group ofSamples N Absolute Latitudea Temperatureb Infant Mortalityc Fish Intaked
All study samples 49 .46** !.60*** !.26! !.10
Europe 18 .58* !.81*** !.22 !.21
North AmericaAll samples 10 .75* !.74* .92*** !.64!
High infant mortality 3 .94 !.99* .97 n/aLow infant mortality 7 .68! !.62 .58 !.85*
AsiaAll samples 15 .58* !.56* .05 !.05South Asia 9 .51! !.51! .49 !.49East Asia 6 .78* !.69 .46 !.20
Africa 4 .53 !.67 .25 !.81
Othere 2 n/a n/a n/a n/a
n/a = data available on only 2 samples.aAbsolute latitude in degrees north or south of the equator.bMean low temperature for the coldest month of the year in degrees Fahrenheit.cInfant mortality rate is the number of cases per 1000 adult population.dFish intake (in kg/person/year); n = 48 because data were not available for Oxford Bay.68eIncludes Christchurch, New Zealand, and Buenos Aires, Argentina.!0.05 < P " .10; *P < 0.05; **P < 0.001; ***P < 0.0005; all P values are two tailed, for Pearson product-moment correlations.
588
D. K. Kinney et al.
Relation of Schizophrenia Prevalence to Latitude, Climate, Fish Consumption, InfantMortality, and Skin Color: A Role for Prenatal Vitamin DDeficiency and Infections?
Dennis K. Kinney1–3, Pamela Teixeira2, Diane Hsu2, SienaC. Napoleon2,4, David J. Crowley2, Andrea Miller2,William Hyman2, and Emerald Huang2
2Genetics Laboratory, McLean Hospital, Belmont, MA; 3De-partment of Psychiatry, Harvard Medical School, Boston, MA;4Wellesley College, Wellesley, MA
Previous surveys found a large (>10-fold) variation inschizophrenia prevalence at different geographic sitesand a tendency for prevalence to increase with latitude.We conducted meta-analyses of prevalence studies to inves-tigate whether these findings pointed to underlying etiologicfactors in schizophrenia or were the result of methodolog-ical artifacts or the confounding of sites’ latitude with levelof healthcare at those sites. We found that these patternswere still present after controlling for an index of health-care—infant mortality—and focusing on 49 studies thatused similar diagnostic and ascertainment methods. Thetendencies for schizophrenia prevalence to increase withboth latitude and colder climate were still large and signif-icant and present on several continents. The increase inprevalence with latitude was greater for groups with lowfish consumption, darker skin, and higher infant mortali-ty—consistent with a role of prenatal vitamin D deficiencyin schizophrenia. Previous research indicates that poor pre-natal healthcare and nutrition increase risk for schizophre-nia within the same region. These adverse conditions aremore prevalent in developing countries concentrated nearthe equator, but schizophrenia prevalence is lowest atsites near the equator. This suggests that schizophrenia-producing environmental factors associated with higher lat-itude may be so powerful they overwhelm protective effectsof better healthcare in industrialized countries. The ob-served patterns of correlations of risk factors with preva-lence are consistent with an etiologic role for prenatalvitamin D deficiency and exposure to certain infectious dis-eases. Research to elucidate environmental factors that un-
derlie variations in schizophrenia prevalence deserves highpriority.
Key words: epidemiology/etiology/immune function/prenatal/geography/risk factor
Introduction
Schizophrenia is an unusually burdensome disorder be-cause of the great economic costs of extensive care andloss of economic productivity, as well as the personal suf-fering and stigma, which often affect a patient and his orher family for most of the patient’s life. Moreover, formost patients there is still no cure or even an effectiveway of treating many of the most disabling, ‘‘negative’’symptoms of the disorder. Therefore, a key goal of schizo-phrenia research is elucidation of etiologic factors, partic-ularly environmental ones that could be readily avoidedand used in effective, inexpensive, and ethically sound pri-mary prevention programs.In a comprehensive survey of schizophrenia prevalence
studies around the world that were published in Englishover a period of 4 decades, Torrey1 noted 2 importantpatterns. First, prevalence rates varied widely at differentgeographic sites, with the highest rate being more than 10times greater than the lowest. Second, there was a strongtendency for schizophrenia prevalence to increase withincreasing latitude; ie, prevalence rates tended to bevery low near the equator and to increase as one movedtoward the poles. Both of Torrey’s conclusions were alsoreached in a survey and meta-analysis by Saha et al,2
which included more recent studies as well as ones pub-lished in languages other than English. Several other sur-veys have also concluded that schizophrenia rates vary atleast 10-fold around the world, including studies usingmeasures of point prevalence, lifetime prevalence, andincidence.1,3–10
A number of explanations have been proposed for thisvariability inprevalence.Severalcomplementary linesofre-search suggest that the tendency for schizophrenia preva-lence to increase with latitude and cold climate may bedue, at least inpart, to someunderlyingpre-orperinatal en-vironmental influences. For example, several studies have
1To whom correspondence should be addressed; Genetics Lab-oratory, McLean Hospital, NB-G-28 115 Mill Street, Belmont,MA 02478; tel: 617-855-3439, fax: 617-855-2348, e-mail:[email protected].
Schizophrenia Bulletin vol. 35 no. 3 pp. 582–595, 2009doi:10.1093/schbul/sbp023Advance Access publication on April 8, 2009
! The Author 2009. Published by Oxford University Press on behalf of the Maryland Psychiatric Research Center. All rights reserved.For permissions, please email: [email protected].
582
35Monday, April 15, 13

Mismatch, Latitude & Schizophrenia
both latitude and low temperature are highly significant(P< .001 in each case), the correlationwith infantmortalityis not significant at the .05 level. Moreover, the direction(sign) of the respective correlations of prevalence withlatitude and cold are consistent across all continents
and subgroups. In contrast, the direction of the correla-tion of prevalence with infant mortality is inconsistentacross different continents.The best-fit regression lines in figure 1 also suggest that
the increase in prevalence with increasing latitude occurs
Fig. 1. Schizophrenia Prevalence and Latitude by Continent and Infant Mortality.Note: SouthAsia siteswere from Indiaand Indonesia; those sites hadhigher infantmortality rates than all but one of theEastAsian sites. For theregressionlinesinNorthAmerica,thosewithinfantmortalityratesabove30per1000weregroupedashavingahigherrate, thosebelow30ashavinga lower rate.Theslopesof linear regression lineswere0.15 for theEastAsiansites, 0.22 for theAfricansites, 0.086 for theSouthAsiansites,0.14 fortheNorthAmericansiteswithlowerinfantmortality,0.51fortheNorthAmericansiteswithhigherinfantmortality,and0.48fortheEuropeansites.
Table 3. Correlations of Schizophrenia Prevalence with Predictor Variables
Geographic Group ofSamples N Absolute Latitudea Temperatureb Infant Mortalityc Fish Intaked
All study samples 49 .46** !.60*** !.26! !.10
Europe 18 .58* !.81*** !.22 !.21
North AmericaAll samples 10 .75* !.74* .92*** !.64!
High infant mortality 3 .94 !.99* .97 n/aLow infant mortality 7 .68! !.62 .58 !.85*
AsiaAll samples 15 .58* !.56* .05 !.05South Asia 9 .51! !.51! .49 !.49East Asia 6 .78* !.69 .46 !.20
Africa 4 .53 !.67 .25 !.81
Othere 2 n/a n/a n/a n/a
n/a = data available on only 2 samples.aAbsolute latitude in degrees north or south of the equator.bMean low temperature for the coldest month of the year in degrees Fahrenheit.cInfant mortality rate is the number of cases per 1000 adult population.dFish intake (in kg/person/year); n = 48 because data were not available for Oxford Bay.68eIncludes Christchurch, New Zealand, and Buenos Aires, Argentina.!0.05 < P " .10; *P < 0.05; **P < 0.001; ***P < 0.0005; all P values are two tailed, for Pearson product-moment correlations.
588
D. K. Kinney et al.
Semmelweis Reflex
Relation of Schizophrenia Prevalence to Latitude, Climate, Fish Consumption, InfantMortality, and Skin Color: A Role for Prenatal Vitamin DDeficiency and Infections?
Dennis K. Kinney1–3, Pamela Teixeira2, Diane Hsu2, SienaC. Napoleon2,4, David J. Crowley2, Andrea Miller2,William Hyman2, and Emerald Huang2
2Genetics Laboratory, McLean Hospital, Belmont, MA; 3De-partment of Psychiatry, Harvard Medical School, Boston, MA;4Wellesley College, Wellesley, MA
Previous surveys found a large (>10-fold) variation inschizophrenia prevalence at different geographic sitesand a tendency for prevalence to increase with latitude.We conducted meta-analyses of prevalence studies to inves-tigate whether these findings pointed to underlying etiologicfactors in schizophrenia or were the result of methodolog-ical artifacts or the confounding of sites’ latitude with levelof healthcare at those sites. We found that these patternswere still present after controlling for an index of health-care—infant mortality—and focusing on 49 studies thatused similar diagnostic and ascertainment methods. Thetendencies for schizophrenia prevalence to increase withboth latitude and colder climate were still large and signif-icant and present on several continents. The increase inprevalence with latitude was greater for groups with lowfish consumption, darker skin, and higher infant mortali-ty—consistent with a role of prenatal vitamin D deficiencyin schizophrenia. Previous research indicates that poor pre-natal healthcare and nutrition increase risk for schizophre-nia within the same region. These adverse conditions aremore prevalent in developing countries concentrated nearthe equator, but schizophrenia prevalence is lowest atsites near the equator. This suggests that schizophrenia-producing environmental factors associated with higher lat-itude may be so powerful they overwhelm protective effectsof better healthcare in industrialized countries. The ob-served patterns of correlations of risk factors with preva-lence are consistent with an etiologic role for prenatalvitamin D deficiency and exposure to certain infectious dis-eases. Research to elucidate environmental factors that un-
derlie variations in schizophrenia prevalence deserves highpriority.
Key words: epidemiology/etiology/immune function/prenatal/geography/risk factor
Introduction
Schizophrenia is an unusually burdensome disorder be-cause of the great economic costs of extensive care andloss of economic productivity, as well as the personal suf-fering and stigma, which often affect a patient and his orher family for most of the patient’s life. Moreover, formost patients there is still no cure or even an effectiveway of treating many of the most disabling, ‘‘negative’’symptoms of the disorder. Therefore, a key goal of schizo-phrenia research is elucidation of etiologic factors, partic-ularly environmental ones that could be readily avoidedand used in effective, inexpensive, and ethically sound pri-mary prevention programs.In a comprehensive survey of schizophrenia prevalence
studies around the world that were published in Englishover a period of 4 decades, Torrey1 noted 2 importantpatterns. First, prevalence rates varied widely at differentgeographic sites, with the highest rate being more than 10times greater than the lowest. Second, there was a strongtendency for schizophrenia prevalence to increase withincreasing latitude; ie, prevalence rates tended to bevery low near the equator and to increase as one movedtoward the poles. Both of Torrey’s conclusions were alsoreached in a survey and meta-analysis by Saha et al,2
which included more recent studies as well as ones pub-lished in languages other than English. Several other sur-veys have also concluded that schizophrenia rates vary atleast 10-fold around the world, including studies usingmeasures of point prevalence, lifetime prevalence, andincidence.1,3–10
A number of explanations have been proposed for thisvariability inprevalence.Severalcomplementary linesofre-search suggest that the tendency for schizophrenia preva-lence to increase with latitude and cold climate may bedue, at least inpart, to someunderlyingpre-orperinatal en-vironmental influences. For example, several studies have
1To whom correspondence should be addressed; Genetics Lab-oratory, McLean Hospital, NB-G-28 115 Mill Street, Belmont,MA 02478; tel: 617-855-3439, fax: 617-855-2348, e-mail:[email protected].
Schizophrenia Bulletin vol. 35 no. 3 pp. 582–595, 2009doi:10.1093/schbul/sbp023Advance Access publication on April 8, 2009
! The Author 2009. Published by Oxford University Press on behalf of the Maryland Psychiatric Research Center. All rights reserved.For permissions, please email: [email protected].
582
35Monday, April 15, 13

Mismatch, Fish Intake & Schizophrenia
different sites around the world1,2 were not simply arti-facts of differences in diagnostic and ascertainment meth-ods used by different studies. Even though our analysesrestricted prevalence studies to those that used more sim-ilar research methods for diagnosis and ascertainment ofschizophrenia cases, our analyses also found (a) thatprevalence rates varied more than 10-fold across geo-graphic sites and (b) that prevalence increased markedlywith increasing latitude.
That the correlation of schizophrenia prevalence withlatitude is both robust and large, and is not due simply tobetween-site differences in diagnostic and ascertainmentmethods, is further suggested by analysis of data collectedby Lehtinen et al.42 Their study is particularly informa-tive because it is the study that best controlled for possi-ble methodological sources of differences in prevalence atdifferent geographic sites; the same investigative person-nel, as well as the same methods, were used to obtainprevalence rates at several different sites within thesame country. Those investigators studied schizophreniaprevalence at 5 different Finnish sites in the same timeperiod, using a consistent set of diagnostic criteria andascertainment methods, and their data showed a veryhigh correlation of prevalence with both latitude(r = .97, P < .01) and mean low temperature (r =!.99, P < .001).
Athigher latitudes, there isanespeciallywidevariation inprevalence rates. By contrast, near the equator, prevalencefor all sites tends to be quite low. That is, for all groups andcontinental regions for which there are data frommultiplesites, thebest-fit (least squares) regression lines all havepos-
itiveslopes,andtheslopes tendtobesteeper forsitesathigh-er latitudes.This is evident by inspecting table 1, but ismostreadily visualized in figure 1.The results suggest that etiologic factors closely asso-
ciated with latitude and cold climate may be much morepowerful contributors to risk for schizophrenia than isgenerally recognized. The general level of a population’seconomic status and healthcare, as indexed in our anal-ysis by the infant mortality rate, appears to be a muchweaker predictor of risk for schizophrenia than are lati-tude and winter temperature. A high infant mortality rate
Fig. 2. Schizophrenia Prevalence and Latitude by Fish Intake.Note:Errorbars represent95%confidence limits.Theslopesof linear regression lineswere0.03 for siteswithhighfish intake, 0.21 for siteswithmoderate fish intake, and 0.17 for siteswith low fish intake. For the subset of Scandinavian sites, the slope of linear regression forwas 0.03 forsites with high fish intake and 1.57 for sites with moderate fish intake.
Fig. 3. Schizophrenia Prevalence and Latitude by Skin Color.Note: Error bars represent 95% confidence limits. The slopes of thelinear regression lines were 0.24 for those with lightest skin, 0.43 forthosewithintermediateskincolor,and0.31forthosewithdarkestskin.
590
D. K. Kinney et al.
Relation of Schizophrenia Prevalence to Latitude, Climate, Fish Consumption, InfantMortality, and Skin Color: A Role for Prenatal Vitamin DDeficiency and Infections?
Dennis K. Kinney1–3, Pamela Teixeira2, Diane Hsu2, SienaC. Napoleon2,4, David J. Crowley2, Andrea Miller2,William Hyman2, and Emerald Huang2
2Genetics Laboratory, McLean Hospital, Belmont, MA; 3De-partment of Psychiatry, Harvard Medical School, Boston, MA;4Wellesley College, Wellesley, MA
Previous surveys found a large (>10-fold) variation inschizophrenia prevalence at different geographic sitesand a tendency for prevalence to increase with latitude.We conducted meta-analyses of prevalence studies to inves-tigate whether these findings pointed to underlying etiologicfactors in schizophrenia or were the result of methodolog-ical artifacts or the confounding of sites’ latitude with levelof healthcare at those sites. We found that these patternswere still present after controlling for an index of health-care—infant mortality—and focusing on 49 studies thatused similar diagnostic and ascertainment methods. Thetendencies for schizophrenia prevalence to increase withboth latitude and colder climate were still large and signif-icant and present on several continents. The increase inprevalence with latitude was greater for groups with lowfish consumption, darker skin, and higher infant mortali-ty—consistent with a role of prenatal vitamin D deficiencyin schizophrenia. Previous research indicates that poor pre-natal healthcare and nutrition increase risk for schizophre-nia within the same region. These adverse conditions aremore prevalent in developing countries concentrated nearthe equator, but schizophrenia prevalence is lowest atsites near the equator. This suggests that schizophrenia-producing environmental factors associated with higher lat-itude may be so powerful they overwhelm protective effectsof better healthcare in industrialized countries. The ob-served patterns of correlations of risk factors with preva-lence are consistent with an etiologic role for prenatalvitamin D deficiency and exposure to certain infectious dis-eases. Research to elucidate environmental factors that un-
derlie variations in schizophrenia prevalence deserves highpriority.
Key words: epidemiology/etiology/immune function/prenatal/geography/risk factor
Introduction
Schizophrenia is an unusually burdensome disorder be-cause of the great economic costs of extensive care andloss of economic productivity, as well as the personal suf-fering and stigma, which often affect a patient and his orher family for most of the patient’s life. Moreover, formost patients there is still no cure or even an effectiveway of treating many of the most disabling, ‘‘negative’’symptoms of the disorder. Therefore, a key goal of schizo-phrenia research is elucidation of etiologic factors, partic-ularly environmental ones that could be readily avoidedand used in effective, inexpensive, and ethically sound pri-mary prevention programs.In a comprehensive survey of schizophrenia prevalence
studies around the world that were published in Englishover a period of 4 decades, Torrey1 noted 2 importantpatterns. First, prevalence rates varied widely at differentgeographic sites, with the highest rate being more than 10times greater than the lowest. Second, there was a strongtendency for schizophrenia prevalence to increase withincreasing latitude; ie, prevalence rates tended to bevery low near the equator and to increase as one movedtoward the poles. Both of Torrey’s conclusions were alsoreached in a survey and meta-analysis by Saha et al,2
which included more recent studies as well as ones pub-lished in languages other than English. Several other sur-veys have also concluded that schizophrenia rates vary atleast 10-fold around the world, including studies usingmeasures of point prevalence, lifetime prevalence, andincidence.1,3–10
A number of explanations have been proposed for thisvariability inprevalence.Severalcomplementary linesofre-search suggest that the tendency for schizophrenia preva-lence to increase with latitude and cold climate may bedue, at least inpart, to someunderlyingpre-orperinatal en-vironmental influences. For example, several studies have
1To whom correspondence should be addressed; Genetics Lab-oratory, McLean Hospital, NB-G-28 115 Mill Street, Belmont,MA 02478; tel: 617-855-3439, fax: 617-855-2348, e-mail:[email protected].
Schizophrenia Bulletin vol. 35 no. 3 pp. 582–595, 2009doi:10.1093/schbul/sbp023Advance Access publication on April 8, 2009
! The Author 2009. Published by Oxford University Press on behalf of the Maryland Psychiatric Research Center. All rights reserved.For permissions, please email: [email protected].
582
36Monday, April 15, 13

Mismatch, Fish Intake & SchizophreniaSemmelweis
Reflex
different sites around the world1,2 were not simply arti-facts of differences in diagnostic and ascertainment meth-ods used by different studies. Even though our analysesrestricted prevalence studies to those that used more sim-ilar research methods for diagnosis and ascertainment ofschizophrenia cases, our analyses also found (a) thatprevalence rates varied more than 10-fold across geo-graphic sites and (b) that prevalence increased markedlywith increasing latitude.
That the correlation of schizophrenia prevalence withlatitude is both robust and large, and is not due simply tobetween-site differences in diagnostic and ascertainmentmethods, is further suggested by analysis of data collectedby Lehtinen et al.42 Their study is particularly informa-tive because it is the study that best controlled for possi-ble methodological sources of differences in prevalence atdifferent geographic sites; the same investigative person-nel, as well as the same methods, were used to obtainprevalence rates at several different sites within thesame country. Those investigators studied schizophreniaprevalence at 5 different Finnish sites in the same timeperiod, using a consistent set of diagnostic criteria andascertainment methods, and their data showed a veryhigh correlation of prevalence with both latitude(r = .97, P < .01) and mean low temperature (r =!.99, P < .001).
Athigher latitudes, there isanespeciallywidevariation inprevalence rates. By contrast, near the equator, prevalencefor all sites tends to be quite low. That is, for all groups andcontinental regions for which there are data frommultiplesites, thebest-fit (least squares) regression lines all havepos-
itiveslopes,andtheslopes tendtobesteeper forsitesathigh-er latitudes.This is evident by inspecting table 1, but ismostreadily visualized in figure 1.The results suggest that etiologic factors closely asso-
ciated with latitude and cold climate may be much morepowerful contributors to risk for schizophrenia than isgenerally recognized. The general level of a population’seconomic status and healthcare, as indexed in our anal-ysis by the infant mortality rate, appears to be a muchweaker predictor of risk for schizophrenia than are lati-tude and winter temperature. A high infant mortality rate
Fig. 2. Schizophrenia Prevalence and Latitude by Fish Intake.Note:Errorbars represent95%confidence limits.Theslopesof linear regression lineswere0.03 for siteswithhighfish intake, 0.21 for siteswithmoderate fish intake, and 0.17 for siteswith low fish intake. For the subset of Scandinavian sites, the slope of linear regression forwas 0.03 forsites with high fish intake and 1.57 for sites with moderate fish intake.
Fig. 3. Schizophrenia Prevalence and Latitude by Skin Color.Note: Error bars represent 95% confidence limits. The slopes of thelinear regression lines were 0.24 for those with lightest skin, 0.43 forthosewithintermediateskincolor,and0.31forthosewithdarkestskin.
590
D. K. Kinney et al.
Relation of Schizophrenia Prevalence to Latitude, Climate, Fish Consumption, InfantMortality, and Skin Color: A Role for Prenatal Vitamin DDeficiency and Infections?
Dennis K. Kinney1–3, Pamela Teixeira2, Diane Hsu2, SienaC. Napoleon2,4, David J. Crowley2, Andrea Miller2,William Hyman2, and Emerald Huang2
2Genetics Laboratory, McLean Hospital, Belmont, MA; 3De-partment of Psychiatry, Harvard Medical School, Boston, MA;4Wellesley College, Wellesley, MA
Previous surveys found a large (>10-fold) variation inschizophrenia prevalence at different geographic sitesand a tendency for prevalence to increase with latitude.We conducted meta-analyses of prevalence studies to inves-tigate whether these findings pointed to underlying etiologicfactors in schizophrenia or were the result of methodolog-ical artifacts or the confounding of sites’ latitude with levelof healthcare at those sites. We found that these patternswere still present after controlling for an index of health-care—infant mortality—and focusing on 49 studies thatused similar diagnostic and ascertainment methods. Thetendencies for schizophrenia prevalence to increase withboth latitude and colder climate were still large and signif-icant and present on several continents. The increase inprevalence with latitude was greater for groups with lowfish consumption, darker skin, and higher infant mortali-ty—consistent with a role of prenatal vitamin D deficiencyin schizophrenia. Previous research indicates that poor pre-natal healthcare and nutrition increase risk for schizophre-nia within the same region. These adverse conditions aremore prevalent in developing countries concentrated nearthe equator, but schizophrenia prevalence is lowest atsites near the equator. This suggests that schizophrenia-producing environmental factors associated with higher lat-itude may be so powerful they overwhelm protective effectsof better healthcare in industrialized countries. The ob-served patterns of correlations of risk factors with preva-lence are consistent with an etiologic role for prenatalvitamin D deficiency and exposure to certain infectious dis-eases. Research to elucidate environmental factors that un-
derlie variations in schizophrenia prevalence deserves highpriority.
Key words: epidemiology/etiology/immune function/prenatal/geography/risk factor
Introduction
Schizophrenia is an unusually burdensome disorder be-cause of the great economic costs of extensive care andloss of economic productivity, as well as the personal suf-fering and stigma, which often affect a patient and his orher family for most of the patient’s life. Moreover, formost patients there is still no cure or even an effectiveway of treating many of the most disabling, ‘‘negative’’symptoms of the disorder. Therefore, a key goal of schizo-phrenia research is elucidation of etiologic factors, partic-ularly environmental ones that could be readily avoidedand used in effective, inexpensive, and ethically sound pri-mary prevention programs.In a comprehensive survey of schizophrenia prevalence
studies around the world that were published in Englishover a period of 4 decades, Torrey1 noted 2 importantpatterns. First, prevalence rates varied widely at differentgeographic sites, with the highest rate being more than 10times greater than the lowest. Second, there was a strongtendency for schizophrenia prevalence to increase withincreasing latitude; ie, prevalence rates tended to bevery low near the equator and to increase as one movedtoward the poles. Both of Torrey’s conclusions were alsoreached in a survey and meta-analysis by Saha et al,2
which included more recent studies as well as ones pub-lished in languages other than English. Several other sur-veys have also concluded that schizophrenia rates vary atleast 10-fold around the world, including studies usingmeasures of point prevalence, lifetime prevalence, andincidence.1,3–10
A number of explanations have been proposed for thisvariability inprevalence.Severalcomplementary linesofre-search suggest that the tendency for schizophrenia preva-lence to increase with latitude and cold climate may bedue, at least inpart, to someunderlyingpre-orperinatal en-vironmental influences. For example, several studies have
1To whom correspondence should be addressed; Genetics Lab-oratory, McLean Hospital, NB-G-28 115 Mill Street, Belmont,MA 02478; tel: 617-855-3439, fax: 617-855-2348, e-mail:[email protected].
Schizophrenia Bulletin vol. 35 no. 3 pp. 582–595, 2009doi:10.1093/schbul/sbp023Advance Access publication on April 8, 2009
! The Author 2009. Published by Oxford University Press on behalf of the Maryland Psychiatric Research Center. All rights reserved.For permissions, please email: [email protected].
582
36Monday, April 15, 13

Mismatch, Skin Color & Schizophrenia
different sites around the world1,2 were not simply arti-facts of differences in diagnostic and ascertainment meth-ods used by different studies. Even though our analysesrestricted prevalence studies to those that used more sim-ilar research methods for diagnosis and ascertainment ofschizophrenia cases, our analyses also found (a) thatprevalence rates varied more than 10-fold across geo-graphic sites and (b) that prevalence increased markedlywith increasing latitude.
That the correlation of schizophrenia prevalence withlatitude is both robust and large, and is not due simply tobetween-site differences in diagnostic and ascertainmentmethods, is further suggested by analysis of data collectedby Lehtinen et al.42 Their study is particularly informa-tive because it is the study that best controlled for possi-ble methodological sources of differences in prevalence atdifferent geographic sites; the same investigative person-nel, as well as the same methods, were used to obtainprevalence rates at several different sites within thesame country. Those investigators studied schizophreniaprevalence at 5 different Finnish sites in the same timeperiod, using a consistent set of diagnostic criteria andascertainment methods, and their data showed a veryhigh correlation of prevalence with both latitude(r = .97, P < .01) and mean low temperature (r =!.99, P < .001).
Athigher latitudes, there isanespeciallywidevariation inprevalence rates. By contrast, near the equator, prevalencefor all sites tends to be quite low. That is, for all groups andcontinental regions for which there are data frommultiplesites, thebest-fit (least squares) regression lines all havepos-
itiveslopes,andtheslopes tendtobesteeper forsitesathigh-er latitudes.This is evident by inspecting table 1, but ismostreadily visualized in figure 1.The results suggest that etiologic factors closely asso-
ciated with latitude and cold climate may be much morepowerful contributors to risk for schizophrenia than isgenerally recognized. The general level of a population’seconomic status and healthcare, as indexed in our anal-ysis by the infant mortality rate, appears to be a muchweaker predictor of risk for schizophrenia than are lati-tude and winter temperature. A high infant mortality rate
Fig. 2. Schizophrenia Prevalence and Latitude by Fish Intake.Note:Errorbars represent95%confidence limits.Theslopesof linear regression lineswere0.03 for siteswithhighfish intake, 0.21 for siteswithmoderate fish intake, and 0.17 for siteswith low fish intake. For the subset of Scandinavian sites, the slope of linear regression forwas 0.03 forsites with high fish intake and 1.57 for sites with moderate fish intake.
Fig. 3. Schizophrenia Prevalence and Latitude by Skin Color.Note: Error bars represent 95% confidence limits. The slopes of thelinear regression lines were 0.24 for those with lightest skin, 0.43 forthosewithintermediateskincolor,and0.31forthosewithdarkestskin.
590
D. K. Kinney et al.
Relation of Schizophrenia Prevalence to Latitude, Climate, Fish Consumption, InfantMortality, and Skin Color: A Role for Prenatal Vitamin DDeficiency and Infections?
Dennis K. Kinney1–3, Pamela Teixeira2, Diane Hsu2, SienaC. Napoleon2,4, David J. Crowley2, Andrea Miller2,William Hyman2, and Emerald Huang2
2Genetics Laboratory, McLean Hospital, Belmont, MA; 3De-partment of Psychiatry, Harvard Medical School, Boston, MA;4Wellesley College, Wellesley, MA
Previous surveys found a large (>10-fold) variation inschizophrenia prevalence at different geographic sitesand a tendency for prevalence to increase with latitude.We conducted meta-analyses of prevalence studies to inves-tigate whether these findings pointed to underlying etiologicfactors in schizophrenia or were the result of methodolog-ical artifacts or the confounding of sites’ latitude with levelof healthcare at those sites. We found that these patternswere still present after controlling for an index of health-care—infant mortality—and focusing on 49 studies thatused similar diagnostic and ascertainment methods. Thetendencies for schizophrenia prevalence to increase withboth latitude and colder climate were still large and signif-icant and present on several continents. The increase inprevalence with latitude was greater for groups with lowfish consumption, darker skin, and higher infant mortali-ty—consistent with a role of prenatal vitamin D deficiencyin schizophrenia. Previous research indicates that poor pre-natal healthcare and nutrition increase risk for schizophre-nia within the same region. These adverse conditions aremore prevalent in developing countries concentrated nearthe equator, but schizophrenia prevalence is lowest atsites near the equator. This suggests that schizophrenia-producing environmental factors associated with higher lat-itude may be so powerful they overwhelm protective effectsof better healthcare in industrialized countries. The ob-served patterns of correlations of risk factors with preva-lence are consistent with an etiologic role for prenatalvitamin D deficiency and exposure to certain infectious dis-eases. Research to elucidate environmental factors that un-
derlie variations in schizophrenia prevalence deserves highpriority.
Key words: epidemiology/etiology/immune function/prenatal/geography/risk factor
Introduction
Schizophrenia is an unusually burdensome disorder be-cause of the great economic costs of extensive care andloss of economic productivity, as well as the personal suf-fering and stigma, which often affect a patient and his orher family for most of the patient’s life. Moreover, formost patients there is still no cure or even an effectiveway of treating many of the most disabling, ‘‘negative’’symptoms of the disorder. Therefore, a key goal of schizo-phrenia research is elucidation of etiologic factors, partic-ularly environmental ones that could be readily avoidedand used in effective, inexpensive, and ethically sound pri-mary prevention programs.In a comprehensive survey of schizophrenia prevalence
studies around the world that were published in Englishover a period of 4 decades, Torrey1 noted 2 importantpatterns. First, prevalence rates varied widely at differentgeographic sites, with the highest rate being more than 10times greater than the lowest. Second, there was a strongtendency for schizophrenia prevalence to increase withincreasing latitude; ie, prevalence rates tended to bevery low near the equator and to increase as one movedtoward the poles. Both of Torrey’s conclusions were alsoreached in a survey and meta-analysis by Saha et al,2
which included more recent studies as well as ones pub-lished in languages other than English. Several other sur-veys have also concluded that schizophrenia rates vary atleast 10-fold around the world, including studies usingmeasures of point prevalence, lifetime prevalence, andincidence.1,3–10
A number of explanations have been proposed for thisvariability inprevalence.Severalcomplementary linesofre-search suggest that the tendency for schizophrenia preva-lence to increase with latitude and cold climate may bedue, at least inpart, to someunderlyingpre-orperinatal en-vironmental influences. For example, several studies have
1To whom correspondence should be addressed; Genetics Lab-oratory, McLean Hospital, NB-G-28 115 Mill Street, Belmont,MA 02478; tel: 617-855-3439, fax: 617-855-2348, e-mail:[email protected].
Schizophrenia Bulletin vol. 35 no. 3 pp. 582–595, 2009doi:10.1093/schbul/sbp023Advance Access publication on April 8, 2009
! The Author 2009. Published by Oxford University Press on behalf of the Maryland Psychiatric Research Center. All rights reserved.For permissions, please email: [email protected].
582
37Monday, April 15, 13

Mismatch, Skin Color & SchizophreniaSemmelweis
Reflex
different sites around the world1,2 were not simply arti-facts of differences in diagnostic and ascertainment meth-ods used by different studies. Even though our analysesrestricted prevalence studies to those that used more sim-ilar research methods for diagnosis and ascertainment ofschizophrenia cases, our analyses also found (a) thatprevalence rates varied more than 10-fold across geo-graphic sites and (b) that prevalence increased markedlywith increasing latitude.
That the correlation of schizophrenia prevalence withlatitude is both robust and large, and is not due simply tobetween-site differences in diagnostic and ascertainmentmethods, is further suggested by analysis of data collectedby Lehtinen et al.42 Their study is particularly informa-tive because it is the study that best controlled for possi-ble methodological sources of differences in prevalence atdifferent geographic sites; the same investigative person-nel, as well as the same methods, were used to obtainprevalence rates at several different sites within thesame country. Those investigators studied schizophreniaprevalence at 5 different Finnish sites in the same timeperiod, using a consistent set of diagnostic criteria andascertainment methods, and their data showed a veryhigh correlation of prevalence with both latitude(r = .97, P < .01) and mean low temperature (r =!.99, P < .001).
Athigher latitudes, there isanespeciallywidevariation inprevalence rates. By contrast, near the equator, prevalencefor all sites tends to be quite low. That is, for all groups andcontinental regions for which there are data frommultiplesites, thebest-fit (least squares) regression lines all havepos-
itiveslopes,andtheslopes tendtobesteeper forsitesathigh-er latitudes.This is evident by inspecting table 1, but ismostreadily visualized in figure 1.The results suggest that etiologic factors closely asso-
ciated with latitude and cold climate may be much morepowerful contributors to risk for schizophrenia than isgenerally recognized. The general level of a population’seconomic status and healthcare, as indexed in our anal-ysis by the infant mortality rate, appears to be a muchweaker predictor of risk for schizophrenia than are lati-tude and winter temperature. A high infant mortality rate
Fig. 2. Schizophrenia Prevalence and Latitude by Fish Intake.Note:Errorbars represent95%confidence limits.Theslopesof linear regression lineswere0.03 for siteswithhighfish intake, 0.21 for siteswithmoderate fish intake, and 0.17 for siteswith low fish intake. For the subset of Scandinavian sites, the slope of linear regression forwas 0.03 forsites with high fish intake and 1.57 for sites with moderate fish intake.
Fig. 3. Schizophrenia Prevalence and Latitude by Skin Color.Note: Error bars represent 95% confidence limits. The slopes of thelinear regression lines were 0.24 for those with lightest skin, 0.43 forthosewithintermediateskincolor,and0.31forthosewithdarkestskin.
590
D. K. Kinney et al.
Relation of Schizophrenia Prevalence to Latitude, Climate, Fish Consumption, InfantMortality, and Skin Color: A Role for Prenatal Vitamin DDeficiency and Infections?
Dennis K. Kinney1–3, Pamela Teixeira2, Diane Hsu2, SienaC. Napoleon2,4, David J. Crowley2, Andrea Miller2,William Hyman2, and Emerald Huang2
2Genetics Laboratory, McLean Hospital, Belmont, MA; 3De-partment of Psychiatry, Harvard Medical School, Boston, MA;4Wellesley College, Wellesley, MA
Previous surveys found a large (>10-fold) variation inschizophrenia prevalence at different geographic sitesand a tendency for prevalence to increase with latitude.We conducted meta-analyses of prevalence studies to inves-tigate whether these findings pointed to underlying etiologicfactors in schizophrenia or were the result of methodolog-ical artifacts or the confounding of sites’ latitude with levelof healthcare at those sites. We found that these patternswere still present after controlling for an index of health-care—infant mortality—and focusing on 49 studies thatused similar diagnostic and ascertainment methods. Thetendencies for schizophrenia prevalence to increase withboth latitude and colder climate were still large and signif-icant and present on several continents. The increase inprevalence with latitude was greater for groups with lowfish consumption, darker skin, and higher infant mortali-ty—consistent with a role of prenatal vitamin D deficiencyin schizophrenia. Previous research indicates that poor pre-natal healthcare and nutrition increase risk for schizophre-nia within the same region. These adverse conditions aremore prevalent in developing countries concentrated nearthe equator, but schizophrenia prevalence is lowest atsites near the equator. This suggests that schizophrenia-producing environmental factors associated with higher lat-itude may be so powerful they overwhelm protective effectsof better healthcare in industrialized countries. The ob-served patterns of correlations of risk factors with preva-lence are consistent with an etiologic role for prenatalvitamin D deficiency and exposure to certain infectious dis-eases. Research to elucidate environmental factors that un-
derlie variations in schizophrenia prevalence deserves highpriority.
Key words: epidemiology/etiology/immune function/prenatal/geography/risk factor
Introduction
Schizophrenia is an unusually burdensome disorder be-cause of the great economic costs of extensive care andloss of economic productivity, as well as the personal suf-fering and stigma, which often affect a patient and his orher family for most of the patient’s life. Moreover, formost patients there is still no cure or even an effectiveway of treating many of the most disabling, ‘‘negative’’symptoms of the disorder. Therefore, a key goal of schizo-phrenia research is elucidation of etiologic factors, partic-ularly environmental ones that could be readily avoidedand used in effective, inexpensive, and ethically sound pri-mary prevention programs.In a comprehensive survey of schizophrenia prevalence
studies around the world that were published in Englishover a period of 4 decades, Torrey1 noted 2 importantpatterns. First, prevalence rates varied widely at differentgeographic sites, with the highest rate being more than 10times greater than the lowest. Second, there was a strongtendency for schizophrenia prevalence to increase withincreasing latitude; ie, prevalence rates tended to bevery low near the equator and to increase as one movedtoward the poles. Both of Torrey’s conclusions were alsoreached in a survey and meta-analysis by Saha et al,2
which included more recent studies as well as ones pub-lished in languages other than English. Several other sur-veys have also concluded that schizophrenia rates vary atleast 10-fold around the world, including studies usingmeasures of point prevalence, lifetime prevalence, andincidence.1,3–10
A number of explanations have been proposed for thisvariability inprevalence.Severalcomplementary linesofre-search suggest that the tendency for schizophrenia preva-lence to increase with latitude and cold climate may bedue, at least inpart, to someunderlyingpre-orperinatal en-vironmental influences. For example, several studies have
1To whom correspondence should be addressed; Genetics Lab-oratory, McLean Hospital, NB-G-28 115 Mill Street, Belmont,MA 02478; tel: 617-855-3439, fax: 617-855-2348, e-mail:[email protected].
Schizophrenia Bulletin vol. 35 no. 3 pp. 582–595, 2009doi:10.1093/schbul/sbp023Advance Access publication on April 8, 2009
! The Author 2009. Published by Oxford University Press on behalf of the Maryland Psychiatric Research Center. All rights reserved.For permissions, please email: [email protected].
582
37Monday, April 15, 13

Latitude and Infantile Autism
Grant, W. B. and C. M. Soles (2009). "Epidemiologic evidence supporting the role of maternal vitamin D deficiency as a risk factor for the development of infantile autism." Dermatoendocrinol 1(4): 223-228.
38Monday, April 15, 13

Latitude and Infantile AutismSemmelweis
ReflexGrant, W. B. and C. M. Soles (2009). "Epidemiologic evidence supporting the role of maternal vitamin D deficiency as a risk factor for the development of infantile autism." Dermatoendocrinol 1(4): 223-228.
38Monday, April 15, 13

Estimated deaths per year would fallby 37,000 people, or about 16%-22% of annual mortality
in Canada.
And, $14 billion
39Monday, April 15, 13

Semmelweis Reflex
Estimated deaths per year would fallby 37,000 people, or about 16%-22% of annual mortality
in Canada.
And, $14 billion
39Monday, April 15, 13

Among pregnant women, lower Vitamin D is associated with:• Adverse fertility
parameters (n = 2),
• Preeclampsia (n = 5),
• Gestational diabetes or higher blood glucose (n = 6),
• Bacterial vaginosis (n = 4),
• Primary cesarean section (n = 1),
• Few days' (n = 2) shorter gestation,
• And, postpartum depression (n = 1)
Acta Obstet Gynecol Scand. 2012 Dec;91(12):1357-67. doi: 10.1111/aogs.12000. Epub 2012 Oct 17.The impact of vitamin D on pregnancy: a systematic review.Christesen HT, Falkenberg T, Lamont RF, Jørgensen JS.
40Monday, April 15, 13

Among pregnant women, lower Vitamin D is associated with:• Adverse fertility
parameters (n = 2),
• Preeclampsia (n = 5),
• Gestational diabetes or higher blood glucose (n = 6),
• Bacterial vaginosis (n = 4),
• Primary cesarean section (n = 1),
• Few days' (n = 2) shorter gestation,
• And, postpartum depression (n = 1)
Acta Obstet Gynecol Scand. 2012 Dec;91(12):1357-67. doi: 10.1111/aogs.12000. Epub 2012 Oct 17.The impact of vitamin D on pregnancy: a systematic review.Christesen HT, Falkenberg T, Lamont RF, Jørgensen JS.
Semmelweis Reflex
40Monday, April 15, 13

Suicidal ideation during pregnancy
Suicidal ideation and omega-3 intake from seafood during pregnancy ALSPAC-Bristol
Pre
vale
nce
of a
ny s
uici
dal t
houg
hts
(32w
k)
11
10
9
8
7
6
5
4
������ ������������������� ��������� �������� �������� �
��#�!���� ���������#�����! ��"��� ���#����$�"���"#�#� ��
���������������
�� ����������
��������������
������������
�������������
� ���� ���
����!�%���������������
Pregnant moms with suicidality or postpartum depression confer higher lifetime risk for their child. The same study shows n3 intake protects mom and infant through 8th year of life.
41Monday, April 15, 13

And Omega-3 protects their childrenChild&early&developmental&risks&with&low&n3&during&pregnancy&
At&age&
7" 0.00%&
5.00%&
10.00%&
15.00%&
20.00%&
Peer&Problems&
HyperacBvity&
EmoBonal&Problems&
Conduct&problem
s&
No&n3&servings&per&Wk&
1F2&servings&per&Wk&
>2&Servings&per&Wk&
Prenatal
Strength"and"Difficul2es"Ques2onnaire"Results"at"Age"7"
42Monday, April 15, 13

How might we reduce alcohol, tobacco, and other drugs among women of child bearing age
43Monday, April 15, 13

Which warning labels might work?
44Monday, April 15, 13

Trend line for humorous warnings on binge drinking by women of child-rearing
No Warnings Humorous Warnings
45Monday, April 15, 13

Trend line for humorous warnings on binge drinking by women of child-rearing
1995 1997 1999 2001 2002 2003 2004 2005 2006 20070
4
8
12
16
20Pe
rcen
tage
No Warnings Humorous Warnings
45Monday, April 15, 13

Trend line for humorous warnings on binge drinking by women of child-rearing
1995 1997 1999 2001 2002 2003 2004 2005 2006 20070
4
8
12
16
20Pe
rcen
tage
No Warnings Humorous Warnings
45Monday, April 15, 13

Trend line for humorous warnings on binge drinking by women of child-rearing
1995 1997 1999 2001 2002 2003 2004 2005 2006 20070
4
8
12
16
20Pe
rcen
tage
No Warnings Humorous Warnings
45Monday, April 15, 13

Rewarding Clerks & Stores for Not Selling to MinorsYouth Who Smoked Every Day the Last 30 Days
2.0%
4.0%
6.0%
8.0%
10.0%
12.0%
14.0%
16.0%
18.0%
0.0%
2.0%
4.0%
6.0%
8.0%
10.0%
12.0%
14.0%
16.0%
18.0%
1995 1997 1999 2001 2003 2005 2007
2.0%
4.0%
6.0%
8.0%
10.0%
12.0%
14.0%
16.0%
18.0%
Baseline Reward and Reminder
Source: YRBS, US Centers for Disease Control
Wyoming
Wisconsin
United States
0.0%
5.0%
10.0%
15.0%
20.0%
25.0%
30.0%
35.0%
40.0%
45.0%
0.0%
5.0%
10.0%
15.0%
20.0%
25.0%
30.0%
35.0%
40.0%
0.0%
5.0%
10.0%
15.0%
20.0%
25.0%
30.0%
35.0%
40.0%
1995 1997 1999 2001 2003 2005 2007
Wyoming
Wisconsin
United States
Youth Who Smoked During the Last 30 DaysBaseline Reward and Reminder
Source: YRBS, US Centers for Disease Control
= Trend = Wyoming = Wisconsin =United States
Youth Who Smoked Every Day the Last 30 Days
2.0%
4.0%
6.0%
8.0%
10.0%
12.0%
14.0%
16.0%
18.0%
0.0%
2.0%
4.0%
6.0%
8.0%
10.0%
12.0%
14.0%
16.0%
18.0%
1995 1997 1999 2001 2003 2005 2007
2.0%
4.0%
6.0%
8.0%
10.0%
12.0%
14.0%
16.0%
18.0%
Baseline Reward and Reminder
Source: YRBS, US Centers for Disease Control
Wyoming
Wisconsin
United States
0.0%
5.0%
10.0%
15.0%
20.0%
25.0%
30.0%
35.0%
40.0%
45.0%
0.0%
5.0%
10.0%
15.0%
20.0%
25.0%
30.0%
35.0%
40.0%
0.0%
5.0%
10.0%
15.0%
20.0%
25.0%
30.0%
35.0%
40.0%
1995 1997 1999 2001 2003 2005 2007
Wyoming
Wisconsin
United States
Youth Who Smoked During the Last 30 DaysBaseline Reward and Reminder
Source: YRBS, US Centers for Disease Control
= Trend = Wyoming = Wisconsin =United States
Source: Youth Risk Behavior Survey
(YRBS), Centers for Disease Control
A meta-analysis robustly demonstrates that cigarette smoking is associated with an increased risk of completed suicide, consistent with a dose–response relationship. This conclusion has an important public health message.
Journal of Psychiatric Research, Vol 46(10), Oct 2012, 1257-1266.
46Monday, April 15, 13

Happens BEFORE the
behavior
Wait for the Timer for tobacco addictions with SMI/CMI
AntecedentKernel
47Monday, April 15, 13

Writ
e a
thou
ght a
nd a
feelin
g on the leaf and put it on the thoughts and feelings “stream”
I am
hav
ing
the
thou
ght t
hat…
I am having a feeling of …
Copyright © 2007-2012, PAXIS Institute. All rights reserved. May be reproduced but not sold. www.paxtalk.com
I am having a sensation of …
Teaching Psychological flexibility by cognitive defusion
48Monday, April 15, 13

Writ
e a
thou
ght a
nd a
feelin
g on the leaf and put it on the thoughts and feelings “stream”
I am
hav
ing
the
thou
ght t
hat…
I am having a feeling of …
Copyright © 2007-2012, PAXIS Institute. All rights reserved. May be reproduced but not sold. www.paxtalk.com
I am having a sensation of …
Teaching Psychological flexibility by cognitive defusion Remember:
55% of young people who completed
suicide where in therapy.
Maybe current therapy doesn’t
work?
48Monday, April 15, 13

.6
.7
.8
.9
1.0
40 80 120
Days After Initial Release
Prop
ortio
n N
ot H
ospi
taliz
ed
Rehospitalization
49Monday, April 15, 13

.6
.7
.8
.9
1.0
40 80 120
Days After Initial Release
Treatment as UsualPr
opor
tion
Not
Hos
pita
lized
Rehospitalization
49Monday, April 15, 13

ACT
.6
.7
.8
.9
1.0
40 80 120
Days After Initial Release
Treatment as UsualPr
opor
tion
Not
Hos
pita
lized
Rehospitalization
49Monday, April 15, 13

ReinforcementKernel
Lifespan example of one kernel for prevention, intervention and
treatment
Happens AFTER the behavior
Available from Amazon.com for $45
50Monday, April 15, 13

Montrose WolfHarriet Barrish
Muriel Saunders invented the Game in 1967 as a first-year, 4th grade teacher.
Published as a study in 1969.
Copyright © 2012, PAXIS Institute, All rights reserved. May be reproduced with notice.
51Monday, April 15, 13
1 2 5 8 10 11 13 15 20 21 23 26 33 36 41 43 45 48 50 51 53 55 58
1 2 5 8 10 11 13 15 20 21 23 26 33 36 41 43 45 48 50 51 53 55 58
Perce
nt of
Interv
als Sc
ored f
or Be
havio
r
100%
75%
50%
25%
0%
100%
75%
50%
25%
0%
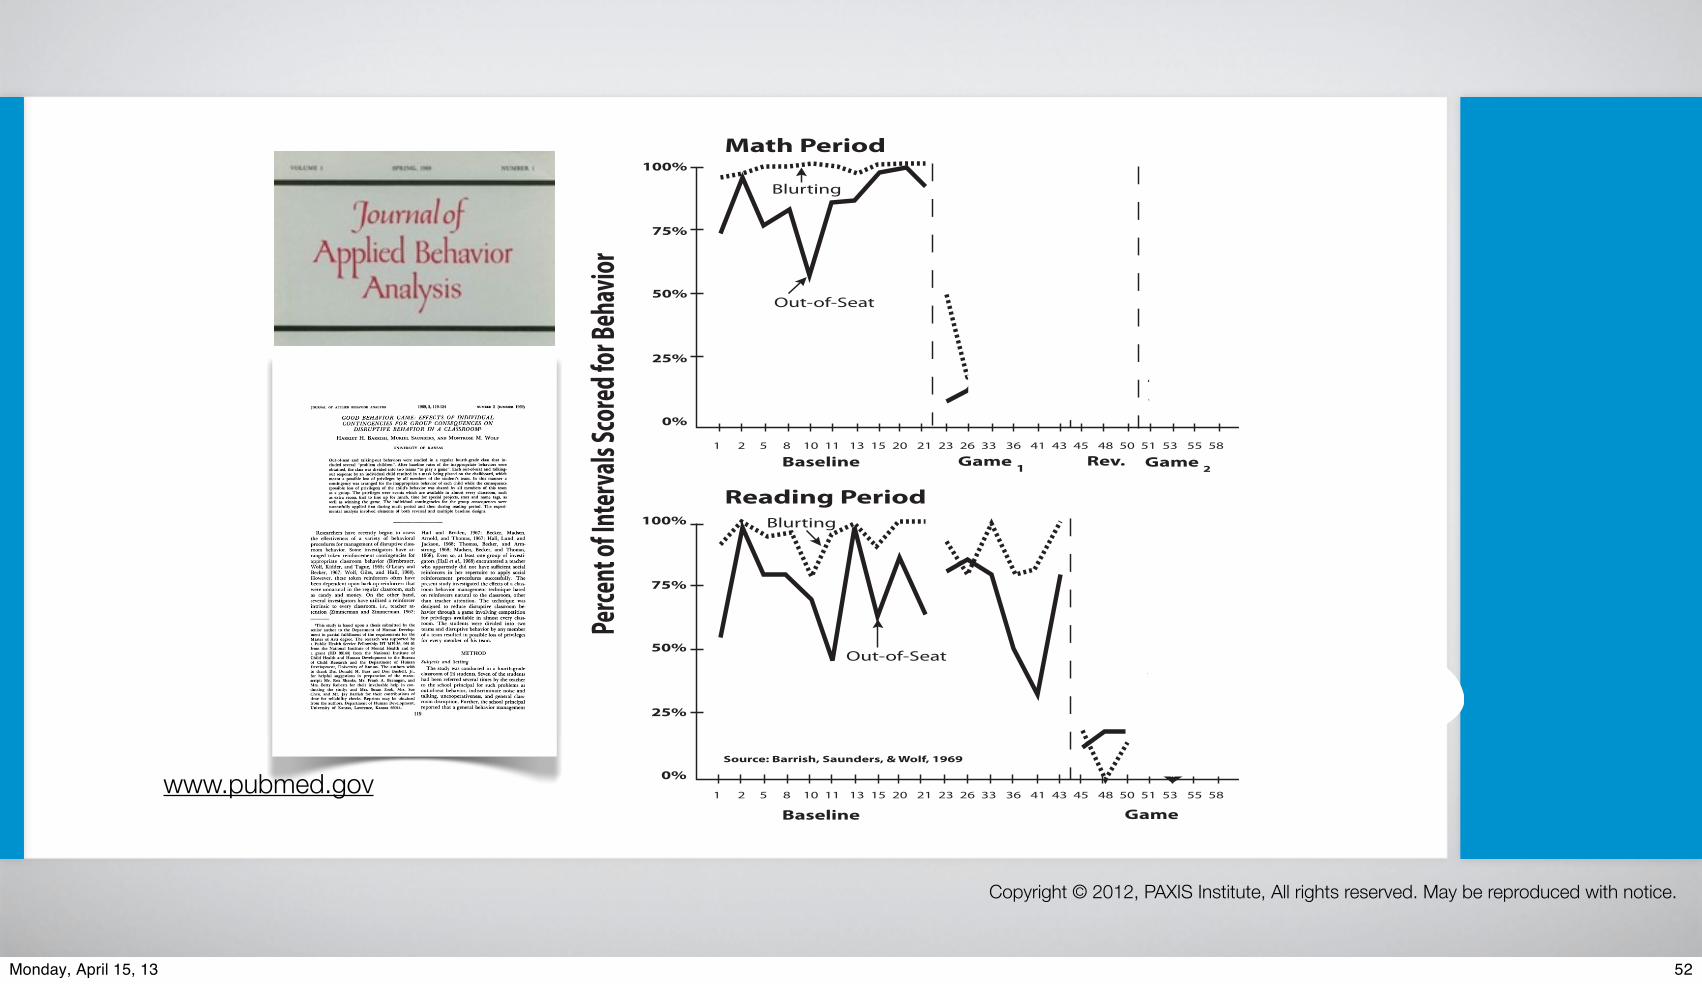
Math Period
Reading Period
Blurting
Blurting
Out-of-Seat
Out-of-Seat
Baseline
Baseline
Game 1
Game
Game 2Rev.
Source: Barrish, Saunders, & Wolf, 1969
JOURNAL OF APPLIED BEHAVIOR ANALYSIS
GOOD BEHAVIOR GAME: EFFECTS OF INDIVIDUALCONTINGENCIES FOR GROUP CONSEQUENCES ON
DISRUPTIVE BEHAVIOR IN A CLASSROOM'HARRIET H. BARRISH, MURIEL SAUNDERS, AND MONTROSE M. WOLF
UNIVERSITY OF KANSAS
Out-of-seat and talking-out behaviors were studied in a regular fourth-grade class that in-cluded several "problem children". After baseline rates of the inappropriate behaviors wereobtained, the class was divided into two teams "to play a game". Each out-of-seat and talking-out response by an individual child resulted in a mark being placed on the chalkboard, whichmeant a possible loss of privileges by all members of the student's team. In this manner acontingency was arranged for the inappropriate behavior of each child while the consequence(possible loss of privileges) of the child's behavior was shared by all members of this teamas a group. The privileges were events which are available in almost every classroom, suchas extra recess, first to line up for lunch, time for special projects, stars and name tags, aswell as winning the game. The individual contingencies for the group consequences weresuccessfully applied first during math period and then during reading period. The experi-mental analysis involved elements of both reversal and multiple baseline designs.
Researchers have recently begun to assessthe effectiveness of a variety of behavioralprocedures for management of disruptive class-room behavior. Some investigators have ar-ranged token reinforcement contingencies forappropriate classroom behavior (Birnbrauer,Wolf, Kidder, and Tague, 1965; O'Leary andBecker, 1967; Wolf, Giles, and Hall, 1968).However, these token reinforcers often havebeen dependent upon back-up reinforcers thatwere unnatural in the regular classroom, suchas candy and money. On the other hand,several investigators have utilized a reinforcerintrinsic to every classroom, i.e., teacher at-tention (Zimmerman and Zimmerman, 1962;
'This study is based upon a thesis submitted by thesenior author to the Department of Human Develop-ment in partial fulfillment of the requirements for theMaster of Arts degree. The research was supported bya Public Health Service Fellowship IFI MH-36, 964-01from the National Institute of Mental Health and bya grant (HD 03144) from the National Institute ofChild Health and Human Development to the Bureauof Child Research and the Department of HumanDevelopment, University of Kansas. The authors wishto thank Drs. Donald M. Baer and Don Bushell, Jr.,for helpful suggestions in preparation of the manu-script; Mr. Rex Shanks, Mr. Frank A. Branagan, andMrs. Betty Roberts for their invaluable help in con-ducting the study; and Mrs. Susan Zook, Mrs. SueChen, and Mr. Jay Barrish for their contributions oftime for reliability checks. Reprints may be obtainedfrom the authors, Department of Human Development,University of Kansas, Lawrence, Kansas 66044.
Hall and Broden, 1967; Becker, Madsen,Arnold, and Thomas, 1967; Hall, Lund, andJackson, 1968; Thomas, Becker, and Arm-strong, 1968; Madsen, Becker, and Thomas,1968). Even so, at least one group of investi-gators (Hall et al., 1968) encountered a teacherwho apparently did not have sufficient socialreinforcers in her repertoire to apply socialreinforcement procedures successfully. Thepresent study investigated the effects of a class-room behavior management technique basedon reinforcers natural to the classroom, otherthan teacher attention. The technique wasdesigned to reduce disruptive classroom be-havior through a game involving competitionfor privileges available in almost every class-room. The students were divided into twoteams and disruptive behavior by any memberof a team resulted in possible loss of privilegesfor every member of his team.
METHODSubjects and SettingThe study was conducted in a fourth-grade
classroom of 24 students. Seven of the studentshad been referred several times by the teacherto the school principal for such problems asout-of-seat behavior, indiscriminate noise andtalking, uncooperativeness, and general class-room disruption. Further, the school principalreported that a general behavior management
119
1969, 2, 119-124 NUMBER 2 (SUMMER 1969)
www.pubmed.gov
Copyright © 2012, PAXIS Institute, All rights reserved. May be reproduced with notice.
52Monday, April 15, 13

1 2 5 8 10 11 13 15 20 21 23 26 33 36 41 43 45 48 50 51 53 55 58
1 2 5 8 10 11 13 15 20 21 23 26 33 36 41 43 45 48 50 51 53 55 58
Perce
nt of
Interv
als Sc
ored f
or Be
havio
r
100%
75%
50%
25%
0%
100%
75%
50%
25%
0%
Math Period
Reading Period
Blurting
Blurting
Out-of-Seat
Out-of-Seat
Baseline
Baseline
Game 1
Game
Game 2Rev.
Source: Barrish, Saunders, & Wolf, 1969
JOURNAL OF APPLIED BEHAVIOR ANALYSIS
GOOD BEHAVIOR GAME: EFFECTS OF INDIVIDUALCONTINGENCIES FOR GROUP CONSEQUENCES ON
DISRUPTIVE BEHAVIOR IN A CLASSROOM'HARRIET H. BARRISH, MURIEL SAUNDERS, AND MONTROSE M. WOLF
UNIVERSITY OF KANSAS
Out-of-seat and talking-out behaviors were studied in a regular fourth-grade class that in-cluded several "problem children". After baseline rates of the inappropriate behaviors wereobtained, the class was divided into two teams "to play a game". Each out-of-seat and talking-out response by an individual child resulted in a mark being placed on the chalkboard, whichmeant a possible loss of privileges by all members of the student's team. In this manner acontingency was arranged for the inappropriate behavior of each child while the consequence(possible loss of privileges) of the child's behavior was shared by all members of this teamas a group. The privileges were events which are available in almost every classroom, suchas extra recess, first to line up for lunch, time for special projects, stars and name tags, aswell as winning the game. The individual contingencies for the group consequences weresuccessfully applied first during math period and then during reading period. The experi-mental analysis involved elements of both reversal and multiple baseline designs.
Researchers have recently begun to assessthe effectiveness of a variety of behavioralprocedures for management of disruptive class-room behavior. Some investigators have ar-ranged token reinforcement contingencies forappropriate classroom behavior (Birnbrauer,Wolf, Kidder, and Tague, 1965; O'Leary andBecker, 1967; Wolf, Giles, and Hall, 1968).However, these token reinforcers often havebeen dependent upon back-up reinforcers thatwere unnatural in the regular classroom, suchas candy and money. On the other hand,several investigators have utilized a reinforcerintrinsic to every classroom, i.e., teacher at-tention (Zimmerman and Zimmerman, 1962;
'This study is based upon a thesis submitted by thesenior author to the Department of Human Develop-ment in partial fulfillment of the requirements for theMaster of Arts degree. The research was supported bya Public Health Service Fellowship IFI MH-36, 964-01from the National Institute of Mental Health and bya grant (HD 03144) from the National Institute ofChild Health and Human Development to the Bureauof Child Research and the Department of HumanDevelopment, University of Kansas. The authors wishto thank Drs. Donald M. Baer and Don Bushell, Jr.,for helpful suggestions in preparation of the manu-script; Mr. Rex Shanks, Mr. Frank A. Branagan, andMrs. Betty Roberts for their invaluable help in con-ducting the study; and Mrs. Susan Zook, Mrs. SueChen, and Mr. Jay Barrish for their contributions oftime for reliability checks. Reprints may be obtainedfrom the authors, Department of Human Development,University of Kansas, Lawrence, Kansas 66044.
Hall and Broden, 1967; Becker, Madsen,Arnold, and Thomas, 1967; Hall, Lund, andJackson, 1968; Thomas, Becker, and Arm-strong, 1968; Madsen, Becker, and Thomas,1968). Even so, at least one group of investi-gators (Hall et al., 1968) encountered a teacherwho apparently did not have sufficient socialreinforcers in her repertoire to apply socialreinforcement procedures successfully. Thepresent study investigated the effects of a class-room behavior management technique basedon reinforcers natural to the classroom, otherthan teacher attention. The technique wasdesigned to reduce disruptive classroom be-havior through a game involving competitionfor privileges available in almost every class-room. The students were divided into twoteams and disruptive behavior by any memberof a team resulted in possible loss of privilegesfor every member of his team.
METHODSubjects and SettingThe study was conducted in a fourth-grade
classroom of 24 students. Seven of the studentshad been referred several times by the teacherto the school principal for such problems asout-of-seat behavior, indiscriminate noise andtalking, uncooperativeness, and general class-room disruption. Further, the school principalreported that a general behavior management
119
1969, 2, 119-124 NUMBER 2 (SUMMER 1969)
www.pubmed.gov
Copyright © 2012, PAXIS Institute, All rights reserved. May be reproduced with notice.
52Monday, April 15, 13

Longitudinal Johns Hopkins Studies of GBG
Every child rated by teachers
Kindergarden First Grade
GBG
NO GBG
Tested in 41 first- and second-grade classrooms
within 19 elementary schools with two
consecutive groups of first graders.
Young AdulthoodFollow Up
Age 19-21
Age 26
Age 30
Age 19-21
Age 26
Age 30
Purpose: To find out if GBG affected their adult
lives.
No More GBG
No GBG
Grades 2 thru 12Follow Up
Purpose: To find out if GBG affected their adolescent
lives.
Copyright © 2012, PAXIS Institute, All rights reserved. May be reproduced with notice.
53Monday, April 15, 13

,JOURNAL OF APPLIED DEVELOPMENTAL PSYCHOLOGY 14, 317-345 (1993)
The Short-Term Impact of Two Classroom-Based Preventive
Interventions on Aggressive and Shy Behaviors and Poor Achievement
LAWRENCE J. DOLAN, SHEPPARD G. KELLAM, C . HENDRICKS BROWN ,
LISA WERTHAMER-LARSSON, GEORGE W . REBOK, LAWRENCE S. MAYER,
JOLENE LAUDOLFF, JAYLAN S. TURKKAN The Johns Hopkins School of Hygiene and Public Health
CARLA FORD LEONARD WHEELER
Baltimore City Public Schools
Two classroom-based preventive interventions were carried out on an epidem- iologically defined, varied population of children in a metropolitan area in the United States. This is a report of the short-term impact and specificity of the two interventions from fall through spring of first grade. The first intervention, the Good Behavior Game, was aimed at reducing aggressive behavior and shy behavior. Aggressive behavior has been shown to be an important developmental antecedent in first grade of later delinquency and heavy drug use, particularly when coupled
We acknowledge the contributions of the city of Baltimore, its families and children, and the administration, faculty, and staff of the Baltimore City Public Schools. In particular, we would like to thank Walter Amprey, Superintendent of Baltimore City Public Schools; Lillian Gonzales and Patsy Blacksheare, Deputy Superintendents; Juanita Lewis, Director; Denise Borders, Chief of Account- ability; Robert Solomon, Director, Special Education; Carla Ford, Specialist, Early Childhood Edu- cation; Louise Fink, Coordinator, Social Work Services; Dale Parker-Brown, Director, Compensatory Education; Matthew Riley, Director of the Eastern District; and Willie Foster, Director of Middle Schools. We also thank Alice Brogden for manuscript control and production; Fionnuala Regan for editorial preparation; and Pamela Spencer and Maria Corrada-Bravo for their contributions to data analyses. We thank Alan Harris for contributing to the development of the GBG intervention, and Lisa Crockett for her help in developing the Peer Assessment Inventory.
The studies on which this article is based have been supported by the following grants, with supplements from the National Institute on Drug Abuse: National Institute of Mental Health (NIMH) Grant No. P50 MH38725, Epidemiologic Prevention Center for Early Risk Behavior; NIMH Grant No. IR01 MH42968, Periodic Outcome of Two Preventive Trials; NIMH Grant No. 1R01 MH40859, Statistical Methods for Mental Health Preventive Trials.
Correspondence and requests for reprints should be sent to Lawrence Dolan, Department of Mental Hygiene, School of Hygiene and Public Health, 624 North Broadway, Baltimore, MD 21205.
317
By the early 1990s, multiple
studies including this randomized one proved that
GBG reduced the early predictive
behaviors.
Copyright © 2012, PAXIS Institute, All rights reserved. May be reproduced with notice.
54Monday, April 15, 13
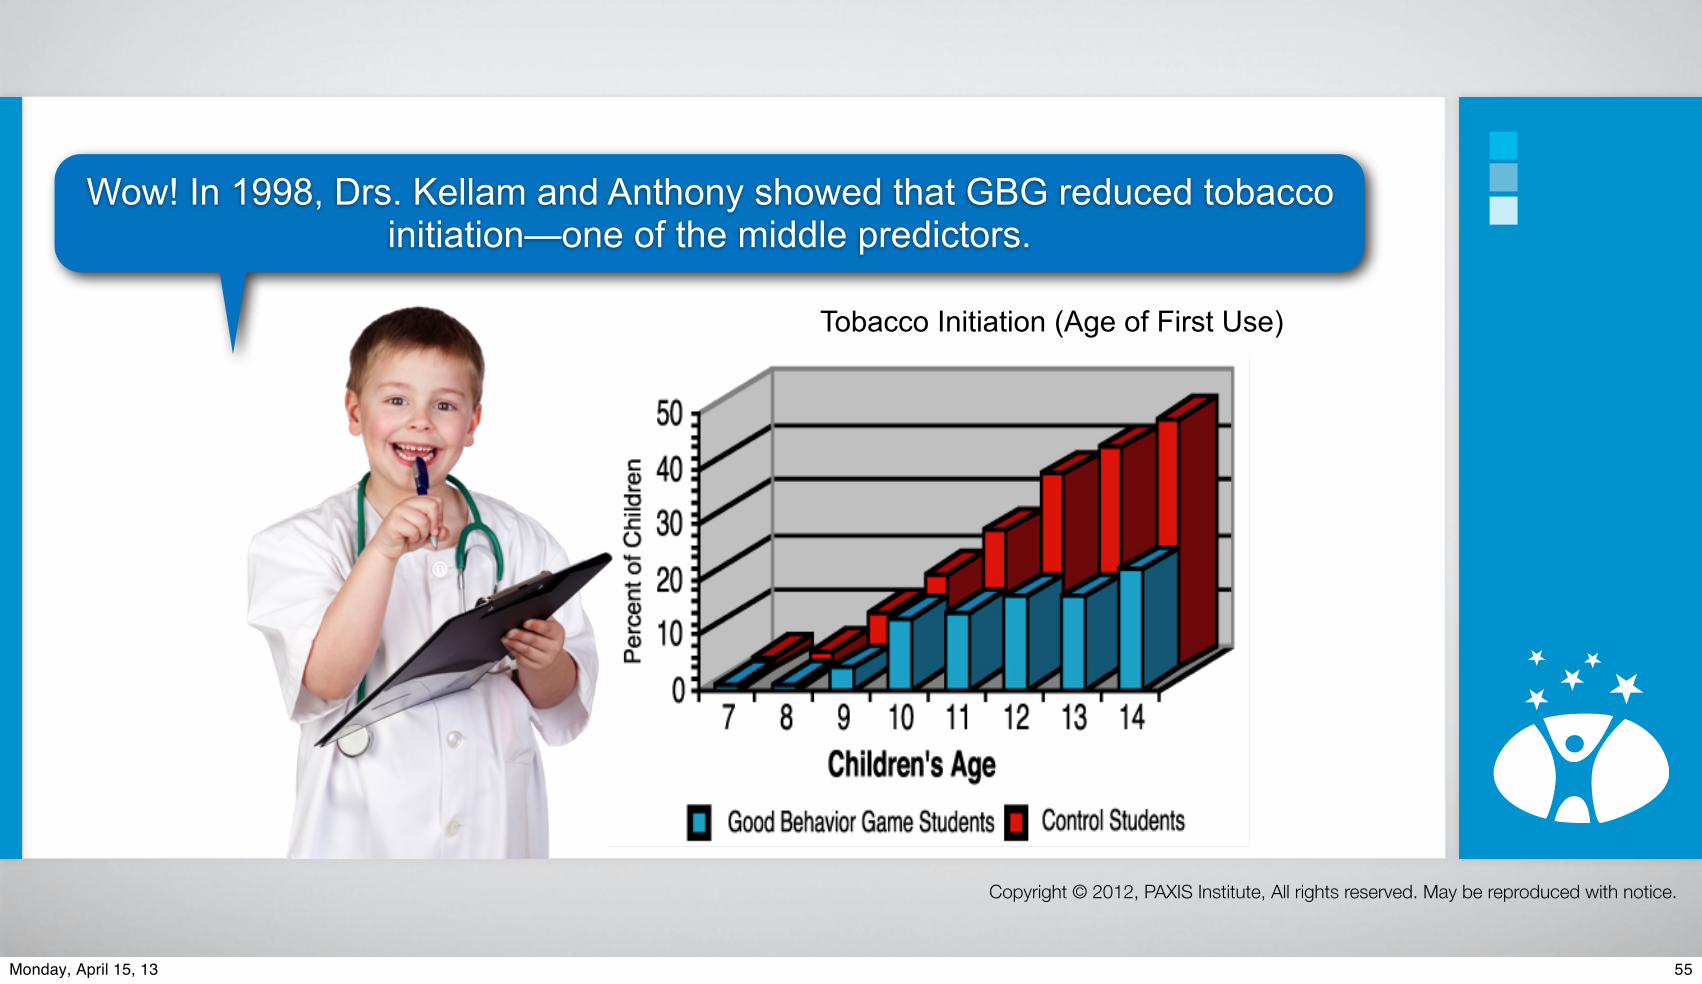
Wow! In 1998, Drs. Kellam and Anthony showed that GBG reduced tobacco initiation—one of the middle predictors.
Tobacco Initiation (Age of First Use)
Copyright © 2012, PAXIS Institute, All rights reserved. May be reproduced with notice.
55Monday, April 15, 13

So now, let’s see if GBG affects suicide indicators among youth and young adults.
Wilcox, H. C., Kellam, S., Brown, C. H., Poduska, J., Ialongo, N., Wang, W., & Anthony, J. (2008). The impact of two universal randomized first- and second-grade classroom interventions on young adult suicide ideation and attempts. Drug & Alcohol
Dependence, 95(Suppl 1), 60-73.
Copyright © 2012, PAXIS Institute, All rights reserved. May be reproduced with notice.
56Monday, April 15, 13

So now, let’s see if GBG affects suicide indicators among youth and young adults.
Wilcox, H. C., Kellam, S., Brown, C. H., Poduska, J., Ialongo, N., Wang, W., & Anthony, J. (2008). The impact of two universal randomized first- and second-grade classroom interventions on young adult suicide ideation and attempts. Drug & Alcohol
Dependence, 95(Suppl 1), 60-73.
Copyright © 2012, PAXIS Institute, All rights reserved. May be reproduced with notice.
57Monday, April 15, 13
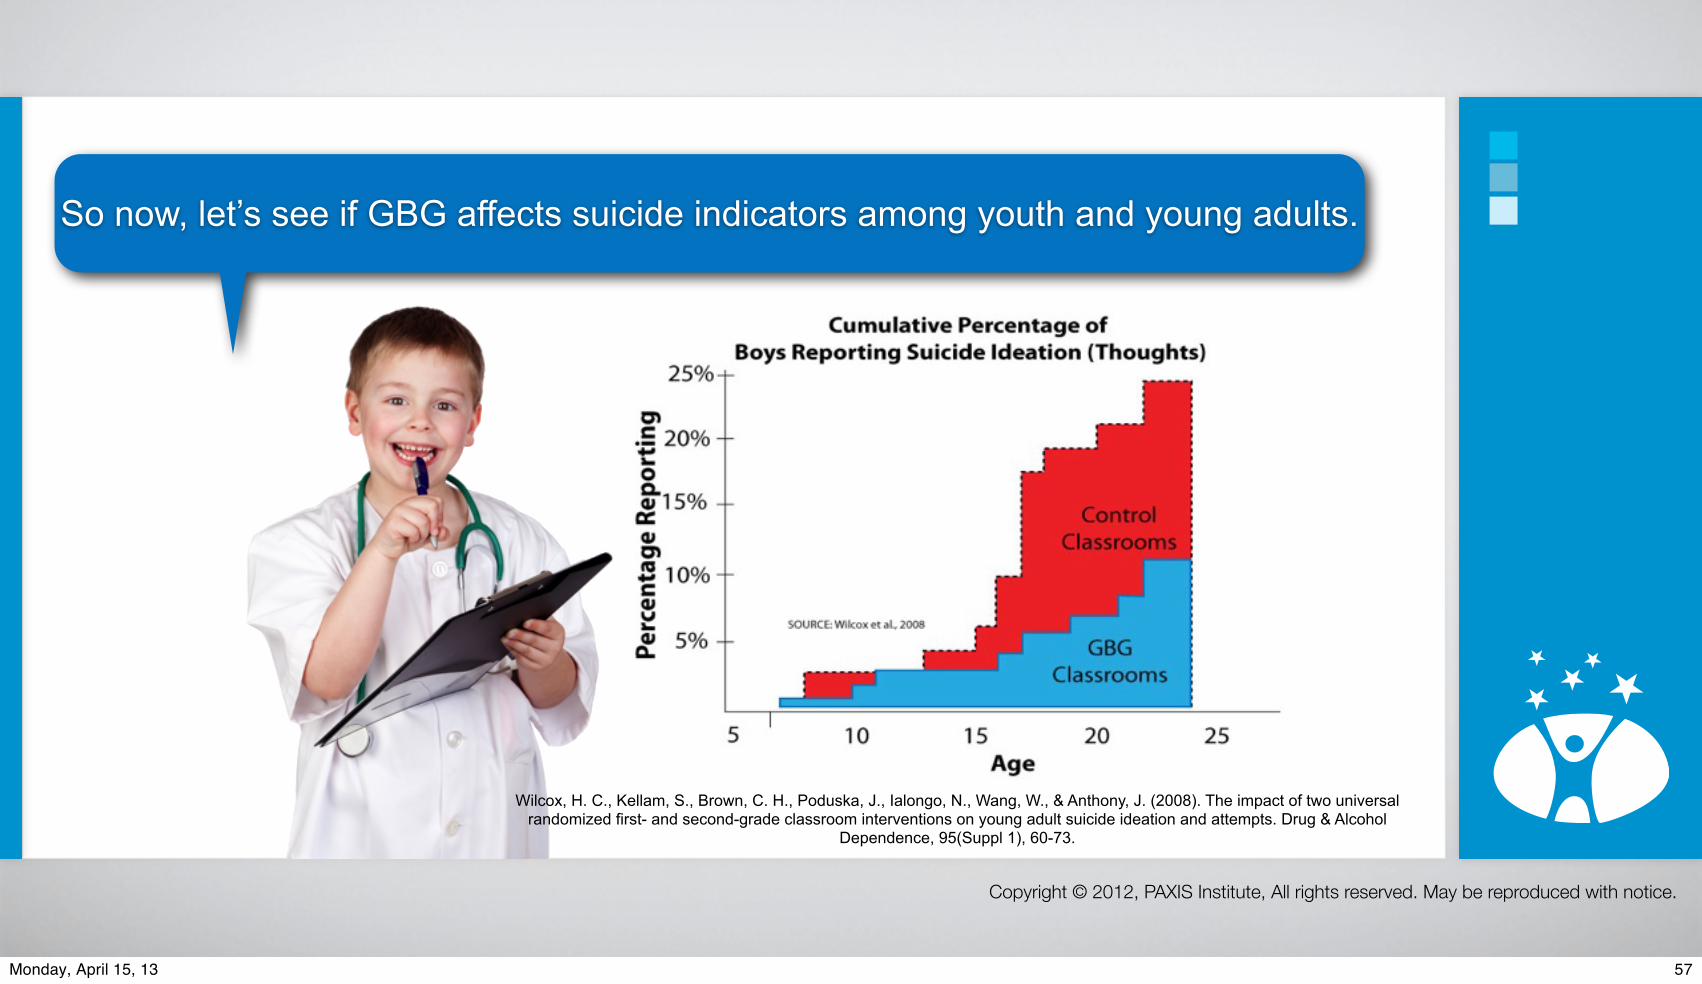

Timeline of Benefits…
Copyright © 2012, PAXIS Institute, All rights reserved. May be reproduced with notice.
58Monday, April 15, 13

Timeline of Benefits…
More time for teaching and learning
First MonthLess stress for
Staff & Students
Better Attendance
Better Academics
Less Illness
Fewer Service Needs
Fewer Referrals
First YearHappier Families
Less Vandalism
2nd & 3rd YearsADHD
AvertedOppositional
Defiance AvertedSpecial Education
Averted
5-15 YearsNo
TobaccoLess
AlcoholLess Conduct
DisordersLess
DepressionLess Crime,
Violence, SuicideHigh School Grad &
University
Copyright © 2012, PAXIS Institute, All rights reserved. May be reproduced with notice.
58Monday, April 15, 13

OUTCOMES STUDENT GROUPS GBG CLASSROOM STANDARD CLASSROOM
Drug abuse and All males 19 percent 38 percentdependence disorders
Highly aggressive males 29 percent 83 percent
Regular smoking All males 6 percent 19 percent
Highly aggressive males 0 percent 40 percent
Alcohol abuse and All males and females 13 percent 20 percent dependence disorders
Antisocial personality Highly aggressive males 40 percent 100 percent disorder (ASPD)
Violent and criminal Highly agressive males 34 percent 50 percent behavior (and ASPD)
Service use for All males 25 percent 42 percent problems with behavior, emotions, drugs, or alcohol
Suicidal thoughts All females 9 percent 19 percent
All males 11 percent 24 percent
Copyright © 2012, PAXIS Institute, All rights reserved. May be reproduced with notice.
59Monday, April 15, 13

Brain Brake
Copyright © 2012, PAXIS Institute, All rights reserved. May be reproduced with notice.
60Monday, April 15, 13

Brain Brake
How is this accomplished?
Copyright © 2012, PAXIS Institute, All rights reserved. May be reproduced with notice.
60Monday, April 15, 13
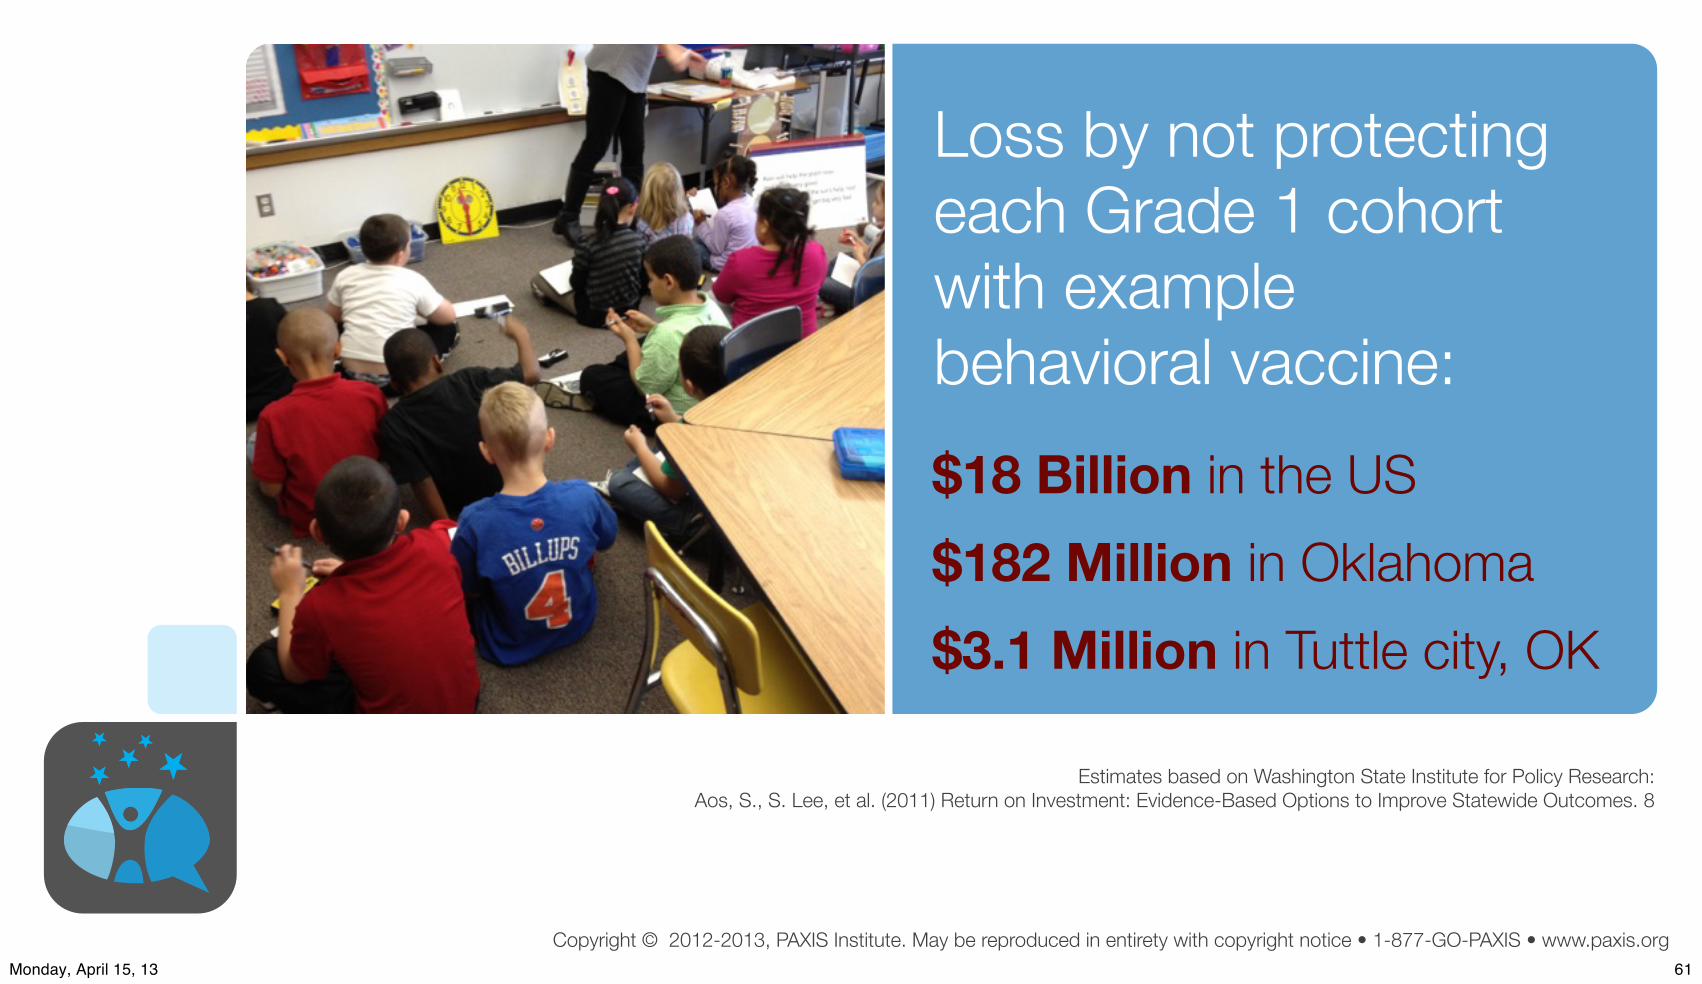
Copyright © 2012-2013, PAXIS Institute. May be reproduced in entirety with copyright notice • 1-877-GO-PAXIS • www.paxis.org
Loss by not protecting each Grade 1 cohort with example behavioral vaccine:$18 Billion in the US$182 Million in Oklahoma$3.1 Million in Tuttle city, OK
Estimates based on Washington State Institute for Policy Research:Aos, S., S. Lee, et al. (2011) Return on Investment: Evidence-Based Options to Improve Statewide Outcomes. 8
61Monday, April 15, 13

What if we provided parenting supports for every family?
62Monday, April 15, 13

Copyright © 2012-2013, PAXIS Institute. May be reproduced in entirety with copyright notice • 1-877-GO-PAXIS • www.paxis.org
Case Study #1:Universal Access to a Behavioral Vaccine for Families
NurturingOUR
Children
Biglan et al., American Psychologist, (4), 2012
Reduce Toxic In!uencesIncrease Psychological Flexibility
Richly Reinforce Pro-social BehaviorsLimit Problematic Behaviors
Credit: ITV
63Monday, April 15, 13

Copyright © 2012-2013, PAXIS Institute. May be reproduced in entirety with copyright notice • 1-877-GO-PAXIS • www.paxis.org
Case Study #1:Universal Access to a Behavioral Vaccine for Families
NurturingOUR
Children
Biglan et al., American Psychologist, (4), 2012
Reduce Toxic In!uencesIncrease Psychological Flexibility
Richly Reinforce Pro-social BehaviorsLimit Problematic Behaviors
✔
✔
✔
✔
Credit: ITV
63Monday, April 15, 13

Copyright © 2012-2013, PAXIS Institute. May be reproduced in entirety with copyright notice • 1-877-GO-PAXIS • www.paxis.org
Universal Access to Parenting Supports reduces child maltreatment in two years by…
64Monday, April 15, 13

Copyright © 2012-2013, PAXIS Institute. May be reproduced in entirety with copyright notice • 1-877-GO-PAXIS • www.paxis.org
Universal Access to Parenting Supports reduces child maltreatment in two years by…
25%
64Monday, April 15, 13

Copyright © 2012-2013, PAXIS Institute. May be reproduced in entirety with copyright notice • 1-877-GO-PAXIS • www.paxis.org
NurturingOUR
Children
Biglan et al., American Psychologist, (4), 2012
Reduce Toxic In!uencesIncrease Psychological Flexibility
Richly Reinforce Pro-social BehaviorsLimit Problematic Behaviors
Case Study from Ancient Wisdom:Universal Access to a Behavioral Vaccine for All
65Monday, April 15, 13

Copyright © 2012-2013, PAXIS Institute. May be reproduced in entirety with copyright notice • 1-877-GO-PAXIS • www.paxis.org
NurturingOUR
Children
Biglan et al., American Psychologist, (4), 2012
Reduce Toxic In!uencesIncrease Psychological Flexibility
Richly Reinforce Pro-social BehaviorsLimit Problematic Behaviors
✔
✔
✔
Case Study from Ancient Wisdom:Universal Access to a Behavioral Vaccine for All
65Monday, April 15, 13

Copyright © 2012-2013, PAXIS Institute. May be reproduced in entirety with copyright notice • 1-877-GO-PAXIS • www.paxis.org66Monday, April 15, 13

Omega-3 Status and US Military Suicide Deaths
e1J Clin Psychiatry
Suicide Deaths of Active-Duty US Military and Omega-3 Fatty-Acid Status: A Case-Control ComparisonMichael D. Lewis, MD; Joseph R. Hibbeln, MD; Jeremiah E. Johnson, RD; Yu Hong Lin, PhD; Duk Y. Hyun, BS; and James D. Loewke, BS
ABSTRACTBackground: The recent escalation of US military suicide deaths to record numbers has been a sentinel for impaired force efficacy and has accelerated the search for reversible risk factors.Objective: To determine whether deficiencies of neuroactive, highly unsaturated omega-3 essential fatty acids (n-3 HUFAs), in particular docosahexaenoic acid (DHA), are associated with increased risk of suicide death among a large random sample of active-duty US military.Method: In this retrospective case-control study, serum fatty acids were quantified as a percentage of total fatty acids among US military suicide deaths (n = 800) and controls (n = 800) matched for age, date of collection of sera, sex, rank, and year of incident. Participants were active-duty US military personnel (2002–2008). For cases, age at death ranged from 17–59 years (mean = 27.3 years, SD = 7.3 years). Outcome measures included death by suicide, postdeployment health assessment questionnaire (Department of Defense Form 2796), and ICD-9 mental health diagnosis data.Results: Risk of suicide death was 14% higher per SD of lower DHA percentage (OR = 1.14; 95% CI, 1.02–1.27; P < .03) in adjusted logistic regressions. Among men, risk of suicide death was 62% greater with low serum DHA status (adjusted OR = 1.62; 95% CI, 1.12–2.34; P < .01, comparing DHA below 1.75% [n = 1,389] to DHA of 1.75% and above [n = 141]). Risk of suicide death was 52% greater in those who reported having seen wounded, dead, or killed coalition personnel (OR = 1.52; 95% CI, 1.11–2.09; P < .01).Conclusion: This US military population had a very low and narrow range of n-3 HUFA status. Although these data suggest that low serum DHA may be a risk factor for suicide, well-designed intervention trials are needed to evaluate causality.J Clin Psychiatry© Copyright 2011 Physicians Postgraduate Press, Inc.
Submitted: January 24, 2011; accepted March 9, 2011.Online ahead of print: August 23, 2011 (doi:10.4088/JCP.11m06879).Corresponding author: Joseph R. Hibbeln, MD, USPHS, Section of Nutritional Neurosciences, Laboratory of Membrane Biochemistry and Biophysics, National Institute on Alcoholism and Alcohol Abuse, National Institutes of Health, 5625 Fishers Lane, Rm 3N-07, MSC 9410, Bethesda, MD 20892 ([email protected]).
Suicide rates among active-duty US military have increased to re-cord numbers, doubling since the inception of Operation Enduring
Freedom (Afghanistan) and Operation Iraqi Freedom and rivaling the battlefield in toll on the US military.1 Army Vice–Chief of Staff General Peter W. Chiarelli described the record suicide rate as “horrible” and voiced frustration that “the Army has not yet been able to identify any causal links among the suicide cases.”2(pA2)
Deficiencies of nutrients critical for brain function may be a signifi-cant contributing risk factor for psychiatric pathology, especially suicide and stress-related psychiatric symptoms.3 Highly unsaturated omega-3 essential fatty acids (n-3 HUFAs), in particular docosahexaenoic acid (DHA), are selectively concentrated in neural tissues and are required for optimal neural function.4 These fatty acids cannot be made de novo but are available only from dietary sources, with seafood being the richest source. Nutritional deficiencies in n-3 HUFAs may increase vulnerabil-ity to combat deployment stress, manifesting as psychiatric symptoms including adjustment disorders, major depression, impulsive violence, and suicide.5 In civilian populations, observational studies indicate that low fish consumption is associated with increased risk of completed sui-cides6,7 and greater suicidal ideation.8 Low DHA status was associated with increased risk of past suicide attempts9 and future suicide attempts.10 In comparison to placebo, 2 grams per day of n-3 HUFA reduced suicidal thinking and depressive symptoms and reduced the perception of stress among subjects (n = 49) with deliberate self-harm.11
These findings suggest that low DHA levels may be a contributing factor for adverse psychiatric symptoms. In this study, we posited that low DHA status would be associated with increased risk of suicide death among military personnel. Prospectively collected serum and supporting data were available from the Armed Forces Health Surveillance Center (AFHSC) for a large number of active-duty suicide deaths (n = 800) and matched controls (n = 800). To our knowledge, this is the largest study of biological factors among suicide deaths.
METHOD
Study DesignThis case-control study compared total serum fatty-acid composi-
tions from among 800 randomly selected active-duty US military suicide deaths to 800 matched controls (2002–2008). The AFHSC is a repository of more than 40 million serum samples with matched health data from US military personnel. Data from service members’ postdeployment health assessment (Department of Defense [DD] Form 2796, obtained within 6 months of completion of last deployment) closest to the date of serum sample provided information regarding time and theater of deployment (if applicable), exposure to stresses during deployment, self-report of mental health status, and indication for referral to mental health services; demographic data and frozen serum samples were provided by the AFHSC. Mental health and substance abuse–related ICD-9-CM diagnosis data reports were similarly obtained.
67Monday, April 15, 13

REVIEW Open Access
Clearance of fear memory from the hippocampusthrough neurogenesis by omega-3 fatty acids:a novel preventive strategy for posttraumaticstress disorder?Yutaka Matsuoka1,2
AbstractNot only has accidental injury been shown to account for a significant health burden on all populations, regardlessof age, sex and geographic region, but patients with accidental injury frequently present with the psychiatriccondition of posttraumatic stress disorder (PTSD). Prevention of accident-related PTSD thus represents a potentiallyimportant goal. Physicians in the field of psychosomatic medicine and critical care medicine have the opportunityto see injured patients in the immediate aftermath of an accident. This article first briefly reviews the prevalenceand associated factors of accident-related PTSD, then focuses on a conceptual model of fear memory andproposes a new, rationally hypothesized translational preventive intervention for PTSD through promotinghippocampal neurogenesis by omega-3 fatty acid supplementation. The results of an open-label pilot trial ofinjured patients admitted to the intensive care unit suggest that omega-3 fatty acid supplementation immediatelyafter accidental injury can reduce subsequent PTSD symptoms.
Matsuoka BioPsychoSocial Medicine 2011, 5:3http://www.bpsmedicine.com/content/5/1/3
Clearance of fear memory from the hippocampusthrough neurogenesis by omega-3 fatty acids: a novelpreventive strategy for posttraumatic stress disorder?Matsuoka
Matsuoka BioPsychoSocial Medicine 2011, 5:3http://www.bpsmedicine.com/content/5/1/3 (8 February 2011)
Omega-3 for PTSD symptoms could be used routinely for the patients exposed to trauma
REVIEW Open Access
Clearance of fear memory from the hippocampusthrough neurogenesis by omega-3 fatty acids:a novel preventive strategy for posttraumaticstress disorder?Yutaka Matsuoka1,2
AbstractNot only has accidental injury been shown to account for a significant health burden on all populations, regardlessof age, sex and geographic region, but patients with accidental injury frequently present with the psychiatriccondition of posttraumatic stress disorder (PTSD). Prevention of accident-related PTSD thus represents a potentiallyimportant goal. Physicians in the field of psychosomatic medicine and critical care medicine have the opportunityto see injured patients in the immediate aftermath of an accident. This article first briefly reviews the prevalenceand associated factors of accident-related PTSD, then focuses on a conceptual model of fear memory andproposes a new, rationally hypothesized translational preventive intervention for PTSD through promotinghippocampal neurogenesis by omega-3 fatty acid supplementation. The results of an open-label pilot trial ofinjured patients admitted to the intensive care unit suggest that omega-3 fatty acid supplementation immediatelyafter accidental injury can reduce subsequent PTSD symptoms.
Matsuoka BioPsychoSocial Medicine 2011, 5:3http://www.bpsmedicine.com/content/5/1/3
Clearance of fear memory from the hippocampusthrough neurogenesis by omega-3 fatty acids: a novelpreventive strategy for posttraumatic stress disorder?Matsuoka
Matsuoka BioPsychoSocial Medicine 2011, 5:3http://www.bpsmedicine.com/content/5/1/3 (8 February 2011)
68Monday, April 15, 13
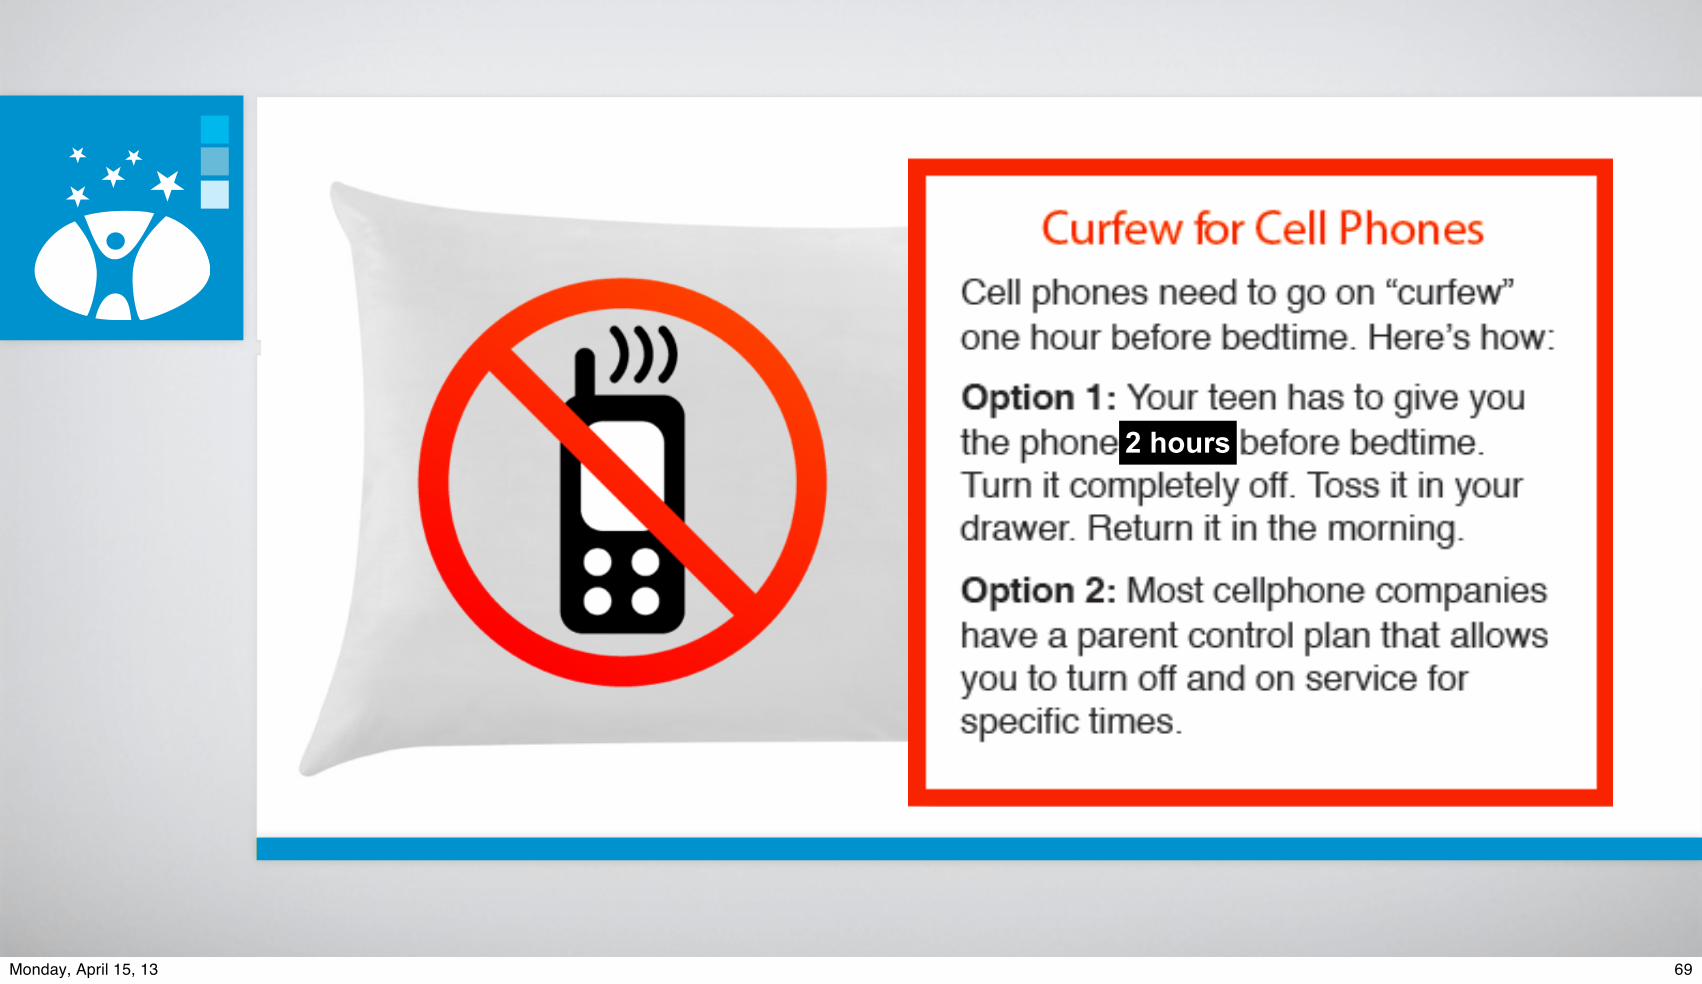
2 hours
69Monday, April 15, 13

Estimate the costs of NOT acting…Estimate the benefits of acting to the public and private purse sort, medium and long term…
Predict Benefits (including economic)70Monday, April 15, 13

Quantify by epidemiology how much suffering will happen by NOT acting
Make the numbers real and human
71Monday, April 15, 13

Quantify by epidemiology how much suffering will happen by NOT acting
Four fully loaded Boeing 747 with adults and children will land every day in Washington, DC to claim lifetime disabiity for mental, emotional and behavioral disorders…
Make the numbers real and human
71Monday, April 15, 13

Quantify by epidemiology how much suffering will happen by NOT acting
Quantify by epidemiology the positive outcomes will happen from action
Four fully loaded Boeing 747 with adults and children will land every day in Washington, DC to claim lifetime disabiity for mental, emotional and behavioral disorders…
Everyday in America, 2,000+ more adults and children will wake up to happier, healthier, and more productive lives…
Make the numbers real and human
71Monday, April 15, 13

Create policy, advocacy, and organizational supports to foster cooperation for common good
72Monday, April 15, 13

Copyright © 2012-2013, PAXIS Institute. May be reproduced in entirety with copyright notice • 1-877-GO-PAXIS • www.paxis.org
Policy Example: Children’s Futures as Common Pool Resource
73Monday, April 15, 13
Copyright © 2012-2013, PAXIS Institute. May be reproduced in entirety with copyright notice • 1-877-GO-PAXIS • www.paxis.org
Develop community prevention scoreboards to monitor progress
You Win
74Monday, April 15, 13

Copyright © 2012-2013, PAXIS Institute. May be reproduced in entirety with copyright notice • 1-877-GO-PAXIS • www.paxis.org
Develop community prevention scoreboards to monitor progress
74Monday, April 15, 13
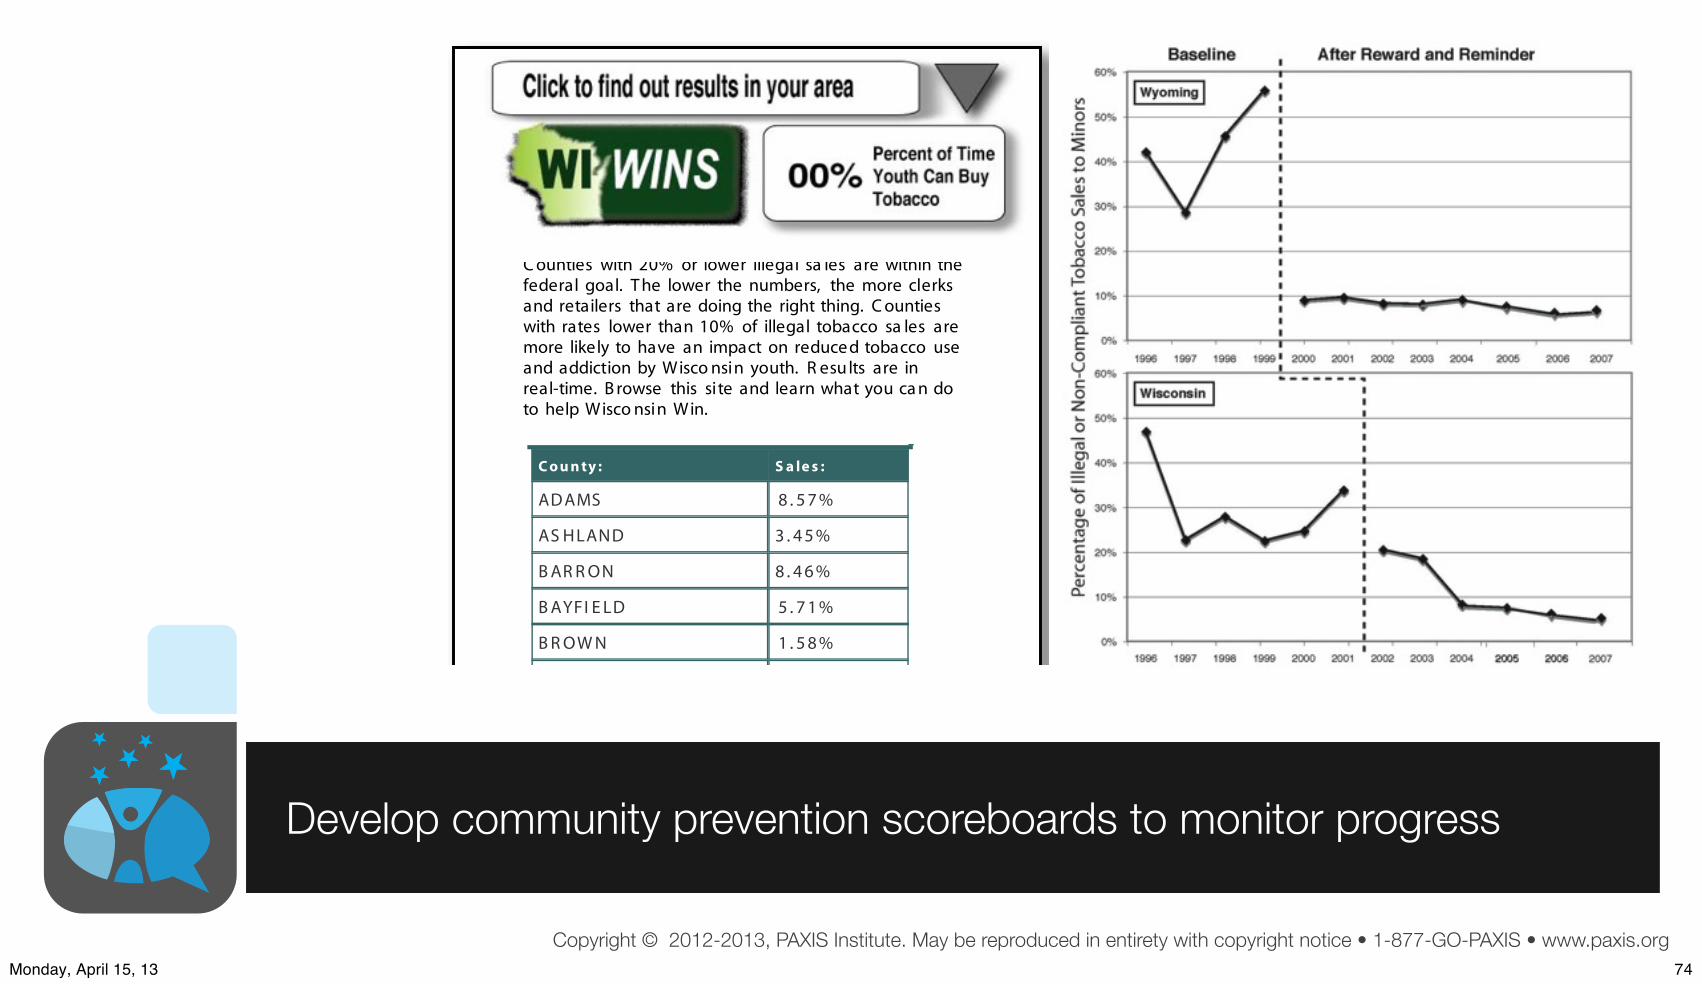
Copyright © 2012-2013, PAXIS Institute. May be reproduced in entirety with copyright notice • 1-877-GO-PAXIS • www.paxis.org
C o u n ty : S a le s :
ADAMS 8 . 5 7 %
AS HLAND 3 . 4 5 %
B AR R ON 8 . 4 6 %
B AYFI E LD 5 . 7 1 %
B R OW N 1 . 5 8 %
C ounties with 20% or lower illegal sa les are within thefederal goal. T he lower the numbers, the more clerksand retailers that are doing the right thing. C ountieswith rates lower than 10% of illegal tobacco sa les aremore likely to have an impact on reduce d tobacco useand addiction by Wisco nsin youth. R esu lts are inreal-time. B rowse this site and learn what you ca n doto help Wisco nsin Win.
Develop community prevention scoreboards to monitor progress
74Monday, April 15, 13

Social Marketing ofMental Health Prevention and Promotion
It’s NOT about the Problem
75Monday, April 15, 13

Recognize & Reward successes in/by��0HGLD��3ROLWLFDO�DUHQD��2WKHU�OHDGHUV��,PPLWDWDEOH�PRGHOV�IURP��DOO�DJHV�DQG�EDFNJURXQGV
Create CommunityPreventionScore/Dashboard
Multi-problem analyses
NurturingEnvironmentsLogic Model forpopulation-level
benefits
Identify%HKDYLRUVWR�,QFUHDVH�
Identify %HKDYLRUV�WR�'HFUHDVH
PredictBenefits:
(VWLPDWHORFDO��VWDWH���QDWLRQDOSUHYDOHQFH�FRVWV�VDYHG�E\SURSRVHGSUHYHQWLRQUHFLSHV��Update Research
Databases for ProvenPrevention Solutions3V\FKLQIR��SXEPHG�JRY�HWF��6HH�)OD\�HW�DO�������IRU�VWDQGDUGV�RI�HYLGHQFH�
Document 8VHU�([SHULHQFHV��/HVVRQV�/HDUQHG�DW�/RFDO��6WDWH�
�1DWLRQDO�/HYHOV
&LWH�SRZHUIXOVWXGLHV��OLQNVWR�FXOWXUDO�SUDFWLFHV�
&LWH�UHOHYDQW�HQGRUVHPHQWV�RU�VWDQGDUGV
Create�SROLF\�RUJDQL]DWLRQDO��DGYRFDF\�VXSSRUWVWR�QXUWXUH�HIIRUWV�
Cultivate VRPHFXUUHQW�RU�HDUO\�DGRSWHUV�IRU�ORFDOLPSDFW�GDWD�DQGORFDO�WHVWLPRQLDOV����
/R���+L
Launch Social Marketing: Advocacy & Media
Products KDYHFDWFK\��SRVLWLYHQDPH��D�PHPH�
PerformanceQDPHV�EHQHILWV��OLWWOH�SDLQ�
Place�IRU�JHWWLQJSURGXFW�LV�HDV\�QRQ�VWLJPDWL]LQJ
Promotion IRFXVHV�RQ�SRSXODULW\��MRLQLQJ��DOLJQHG�YDOXHV��EHQHILWV�IRU�DOO�&UHDWLYH�HSLGHPLRORJ\�DOLJQV�SHRSOH�RUJDQL]DWLRQV�IRU�FRPPRQ�DFWLRQ��
Create ZRUNIRUFH�WUDLQLQJV\VWHPV
�Report
RQ�PRQQLWRULQJ�HYDOXDWLRQ�RI�TXLFN��PHGLXP��ORQJHUWHUP�RXWFRPHV
Monitor & CoachLPSOHPHQWDWLRQ &SUR[LPDO�RXWFRPHV�
Plan Population-Level Change:5HDFK��(IÀFDF\�$GRSWLRQ��,PSOHPHQWDWLRQ�0DLQWHQDQFH
Price�LV�ORZ�IRUWR�XVH�LQ�PRQH\RU�WLPH�
Developmental stages
Multiple Settings
Families
SchoolsCommunities
Organiations
Birth Childhood Adolescence Adulthood
Inte
nsity
/reac
h le
vels
High IntensityLow reach
Low Intensity
A
B
C
Hi reach
Note: Workforce development e!ciency achieved by broad use of similar/same evidence-based strategies or evidence-based kernels.
&UHDWH�V\VWHPIRU�PRQLWRULQJ��HYDOXDWLRQ�UHVHDUFK��
Population-Level Targeting
Developed by PAXIS Institute © 2010-2012, all rights reserved. May be freely reporduced in total with attribution and notice
See:
Safe PlayingProgrammeCase Study
New Zealand
76Monday, April 15, 13

Now is this the time…
77Monday, April 15, 13

Dennis D. [email protected]
Thank you
Please see this and other presentations or papers at:
www.SlideShare.net/drdennisembry78Monday, April 15, 13