Embed Size (px)
Citation preview

Cribado, identificación y ensayos in vitro de nuevos compuestos inhibidores de la pproteasa NS3 del virus de la Hepatitis C
OLGA [email protected]
Zaragoza, 8 de noviembre de 2010Patología digestiva
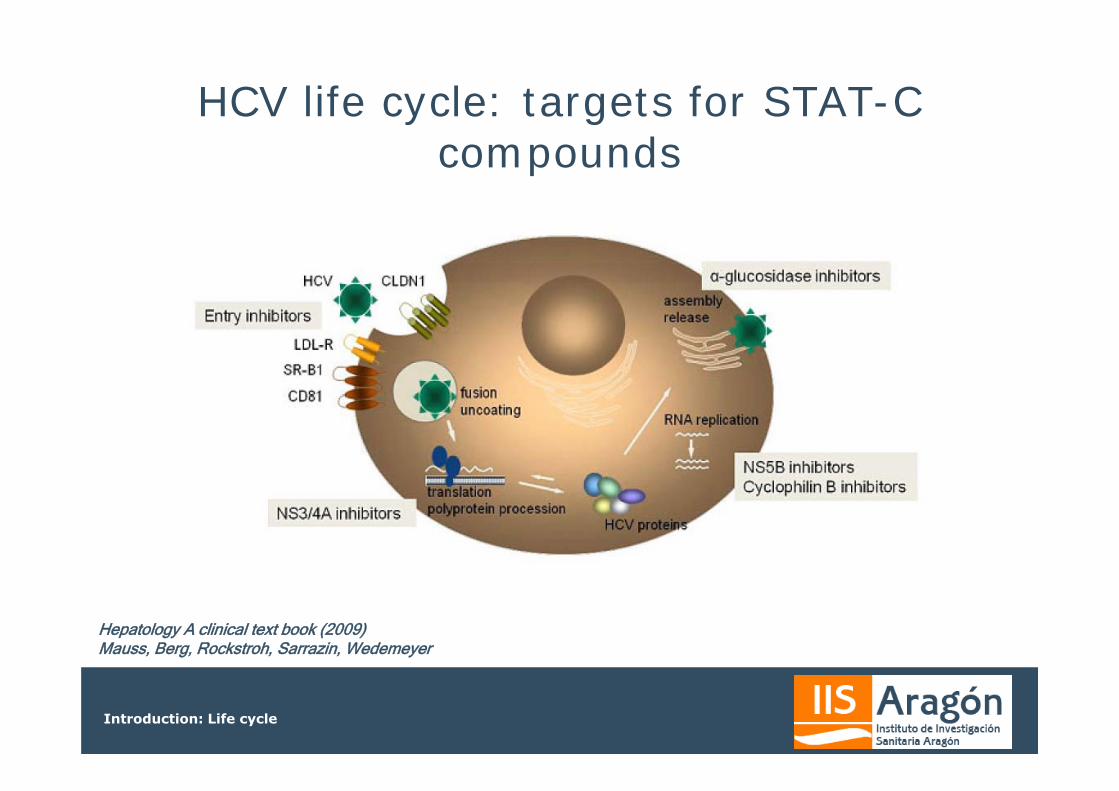
HCV life cycle: targets for STAT-C compounds
Hepatology A clinical text book (2009)Mauss, Berg, Rockstroh, Sarrazin, Wedemeyer
Introduction: Life cycle

Genomic organization of HCV and l t i ipolyprotein processing
HCV RNA NS4BNS4Ap7
5’ 3’C E1 E2 NS3 NS5A NS5BNS2
Structural Proteins Non-Structural Proteins
Polyprotein NS4BNS4Ap7
C E1 E2 NS3 NS5A NS5BNS2
NS2-3 protease
C E1 E2 NS3 NS5A NS5BNS2
Cellular protease NS3 protease
NS2C E1 E2 NS3 NS5A NS5B
p7capsid envelope RNA-dependentRNA polymerase
NS3
NS4BNS4A
NS3protease
NS3NTPasehelicase
protease Cofactor
Introduction: The importance of searching drugs against Hepatitis C disease

NS3 proteinNS3 protein
HelicaseHelicaseNTPase
Protease
Introduction: General Characteristics of the target molecule: NS3 protease
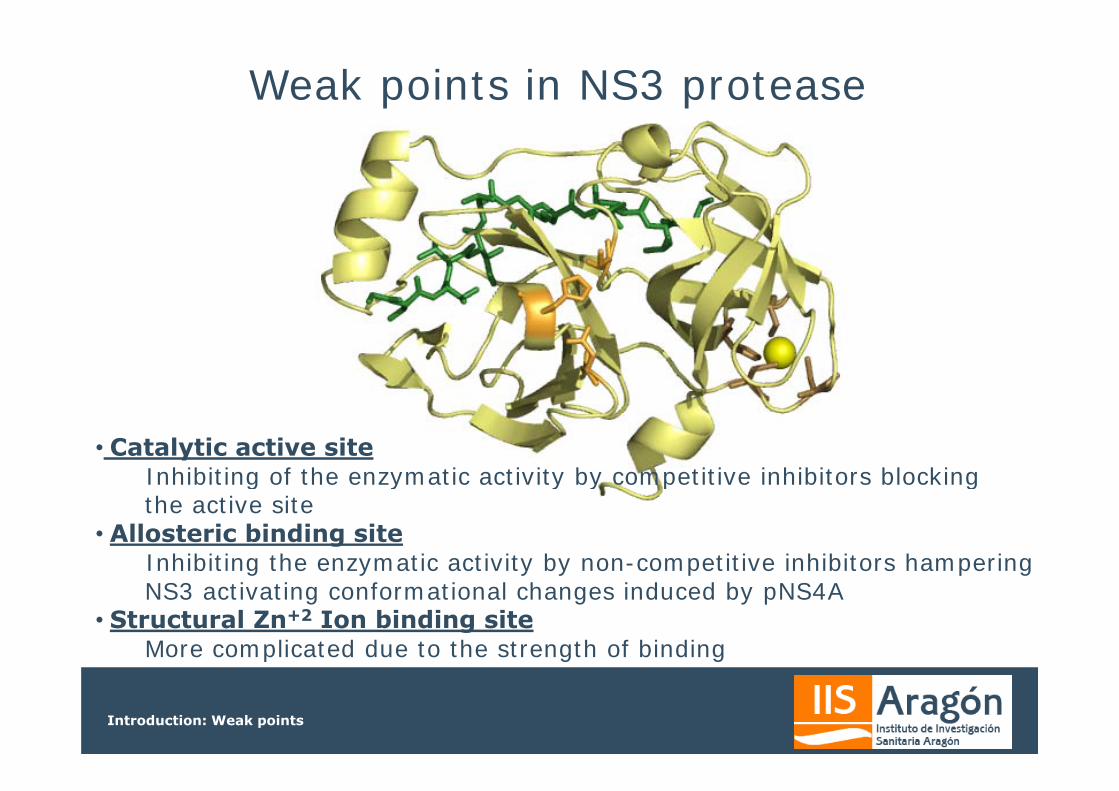
Weak points in NS3 protease
• Catalytic active siteInhibiting of the enzymatic activity by competitive inhibitors blockingg y y y p gthe active site
• Allosteric binding siteInhibiting the enzymatic activity by non-competitive inhibitors hamperingg y y y p p gNS3 activating conformational changes induced by pNS4A
• Structural Zn+2 Ion binding siteMore complicated due to the strength of binding
Introduction: Weak points

NS4A interacts with NS3
NS4A peptide (21-34 NS4A)
NS3NS3/pNS4A
Ser
His
AspCatalytic triad
NS3 is an allosteric protein
Introduction: General Characteristics of the target molecule: NS3 protease
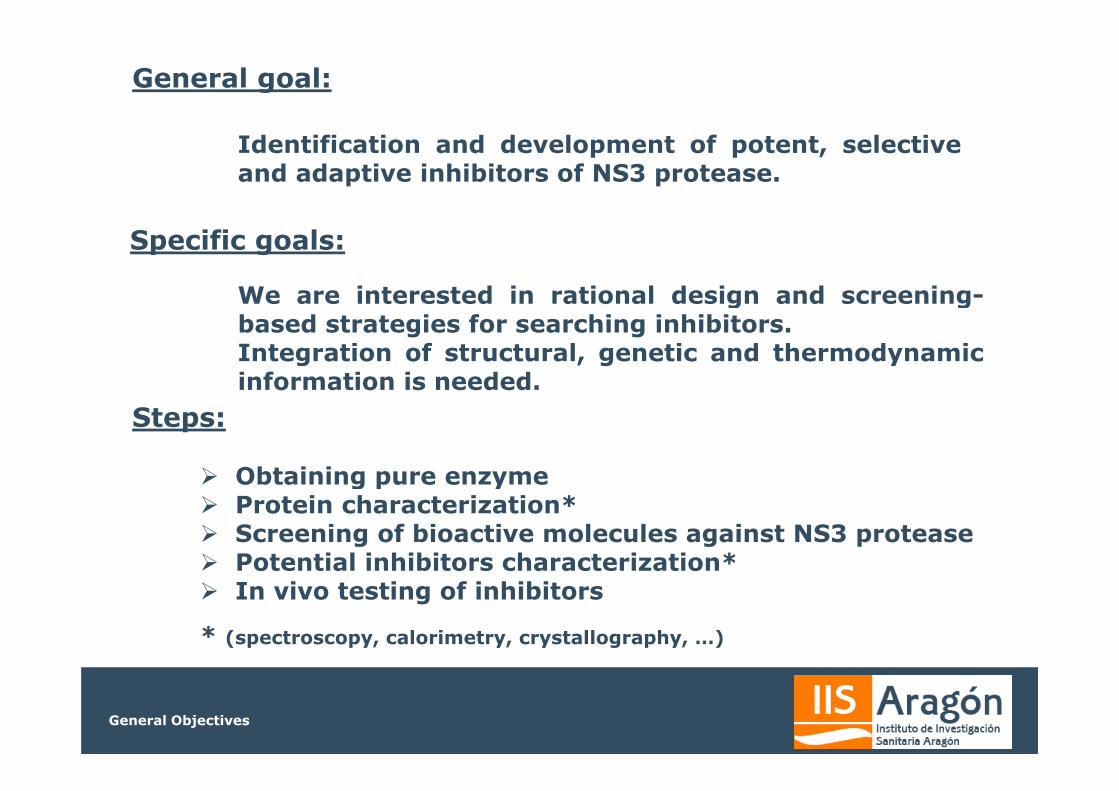
General goal:
Identification and development of potent, selectiveand adaptive inhibitors of NS3 protease.
Specific goals:
We are interested in rational design and screening-g gbased strategies for searching inhibitors.Integration of structural, genetic and thermodynamicinformation is needed.
Obtaining pure enzyme
Steps:
g p y Protein characterization* Screening of bioactive molecules against NS3 protease Potential inhibitors characterization* In vivo testing of inhibitors
* (spectroscopy, calorimetry, crystallography, …)
General Objectives
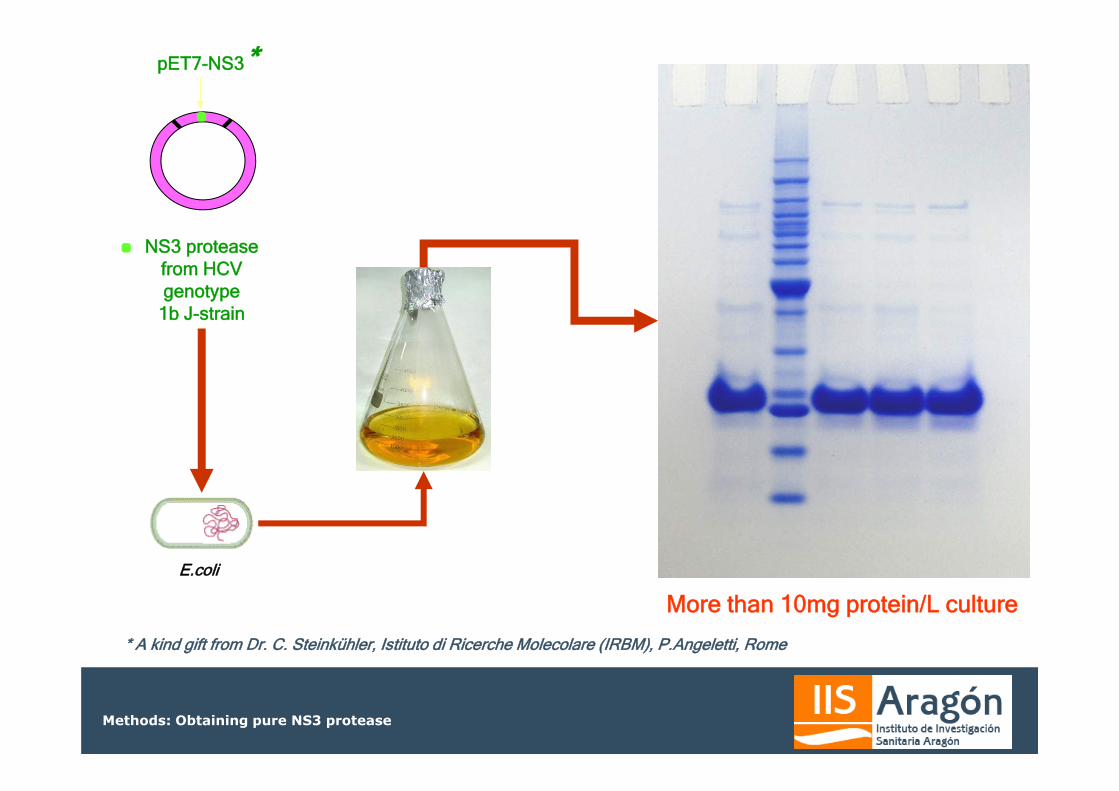
pET7-NS3*
NS3 protease from HCV genotype
1b J-strain
E.coliE.coli
* A kind gift from Dr. C. Steinkühler, Istituto di Ricerche Molecolare (IRBM), P.Angeletti, Rome
More than 10mg protein/L culture
Methods: Obtaining pure NS3 protease
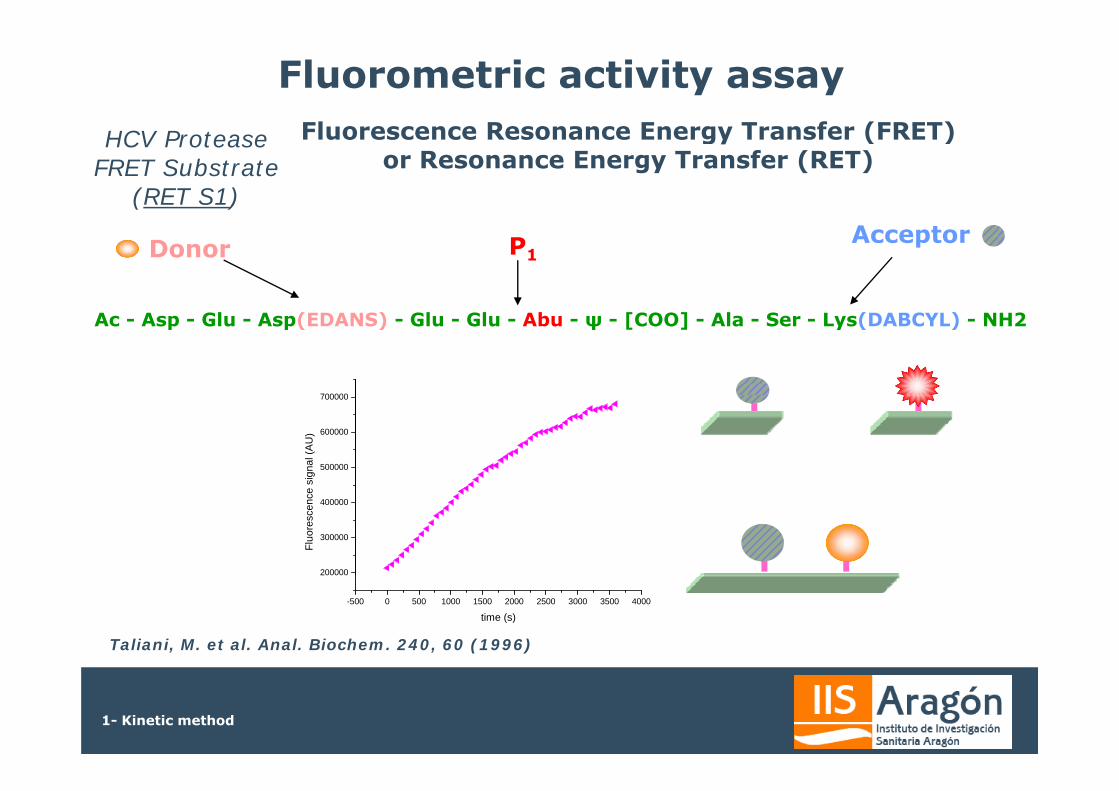
Fl o escence Resonance Ene g T ansfe (FRET)
Fluorometric activity assayHCV Protease
FRET Substrate (RET S1)
Fluorescence Resonance Energy Transfer (FRET)or Resonance Energy Transfer (RET)
P1Donor Acceptor
700000
Ac - Asp - Glu - Asp(EDANS) - Glu - Glu - Abu - ψ - [COO] - Ala - Ser - Lys(DABCYL) - NH2
500000
600000
700000
sign
al (A
U)
200000
300000
400000
Fluo
resc
ence
Taliani, M. et al. Anal. Biochem. 240, 60 (1996)
-500 0 500 1000 1500 2000 2500 3000 3500 4000
200000
time (s)
1- Kinetic method

Isothermal Titration Calorimetry (ITC)
3.00 30 60 90 120
tim e (m in)
MLLM
1.0
1.5
2.0
2.5
dt (
cal/s
)
MLLM
Ligand
10.00.0
0.5
1.0
dQ/d
4.0
6.0
8.0
cal/m
ol)
H Ka
Protein(NS3)
0 0 0 5 1 0 1 5 2 0 2 5 3 0
0.0
2.0
Q (k
c
n
0.0 0.5 1.0 1.5 2.0 2.5 3.0
[Ligand]T/[Macromolecule]T
2- Calorimetric method

4 OAV08 OAV06
-4
0
mol
STΔHΔGΔ -12
-8
kcal
/m
-16 G H -TS
G = H – TSconf – TSsolv – TStr
Interaction P-L• van der Waals• hydrogen bonds
Entropy gain due to release of water
Entropy loss due torestricted conformational• de/protonation
Desolvation moleculesrestricted conformational degrees of freedom
Potential Inhibitors Characterization

Inhibitors of NS3 Protease HighInhibitors of NS3 Protease High Throughput Screening (HTS)
Inhibitors of NS3 protease HTS

High Throughput Screening (HTS)
Materials:
with a chemical library Materials:
Chemical Library: Thousand of potentials ligands (e.g. inhibitors)
Equipment: Equipment:
Plate-Reader Fluorimeter:
FluoDia T70 Microbeam, S.A
Assay: Assay:
NS3 + Library compound + FRET Substrate (RET S1)
Inhibitors of NS3 protease HTS
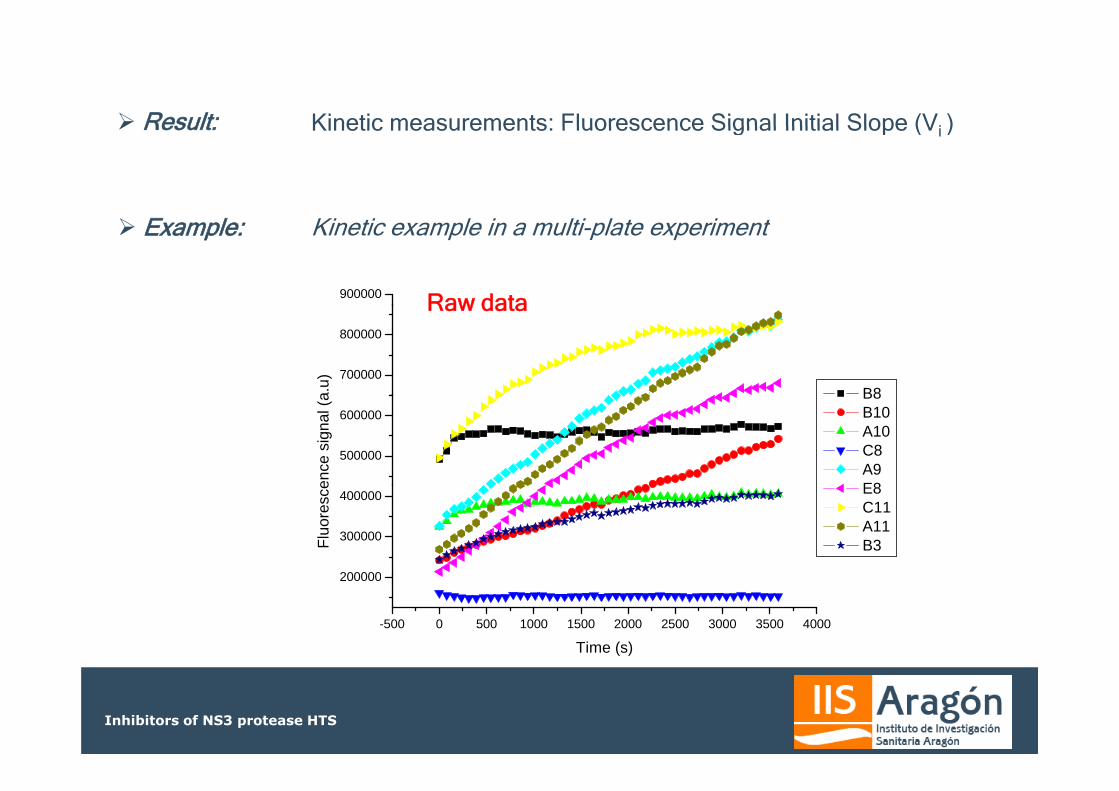
Result: Kinetic measurements: Fluorescence Signal Initial Slope (Vi ) Result: Kinetic measurements: Fluorescence Signal Initial Slope (Vi )
900000
Example:
Raw data
Kinetic example in a multi-plate experiment
700000
800000a.
u)
B8
Raw data
500000
600000
ence
sig
nal (
a B8 B10 A10 C8 A9E8
200000
300000
400000
Fluo
resc
e E8 C11 A11 B3
-500 0 500 1000 1500 2000 2500 3000 3500 4000
200000
Time (s)
Inhibitors of NS3 protease HTS

Data processing:
Analyzed data
processing:400
Library compoundsu)
200
y p Controls (Without ligand) Upper Limit2 Upper Limit1 Upper Limit2 Upper Limit1
nitia
l rat
es (a
.u
0
In
Vi (i iti l t ) I iti l l
A10 B8 C7 D5 E3 F1 G2 G12 H10
Wells
Vi (initial rate)= Initial slopeThe lower the slope, the greater the inhibition
Control positive limitsAverage of control slopes (M)Average of control slopes (M)Standard deviation of control slopes (SD)Upper Limit (M+3SD) and Lower Limit (M-3SD)
Inhibitors of NS3 protease HTS
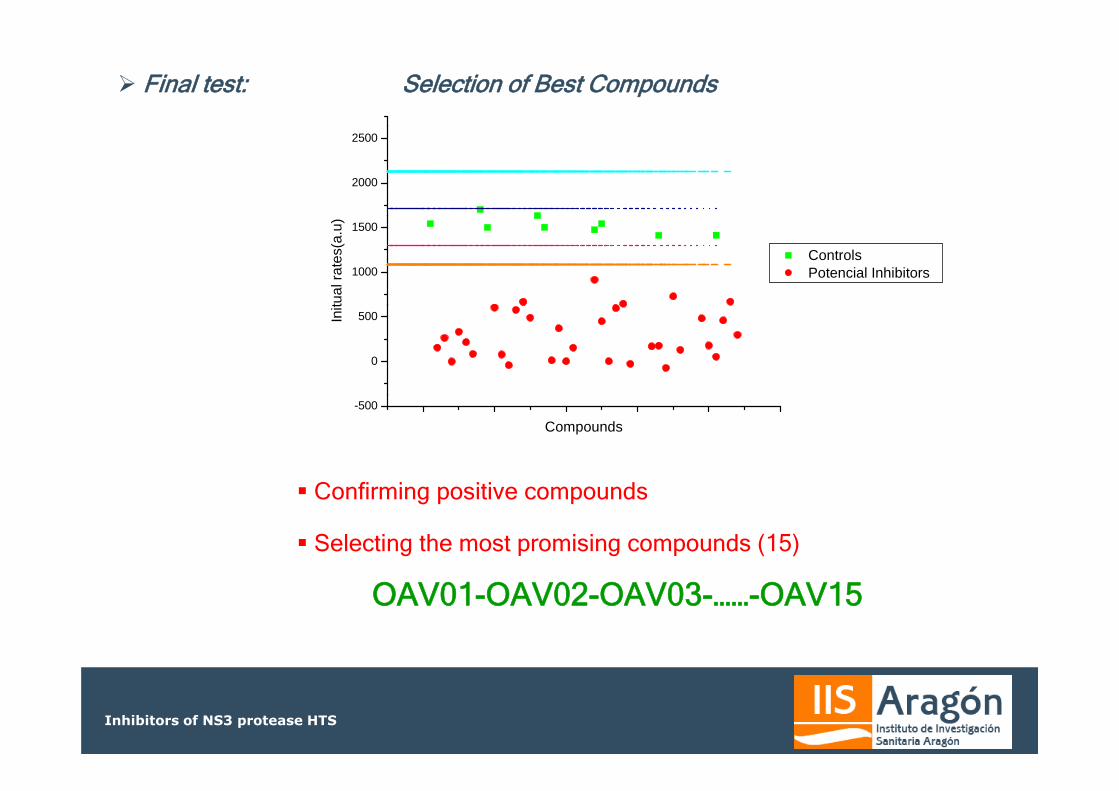
Final test: Selection of Best Compounds
2000
2500
1000
1500
tual
rate
s(a.
u)
Controls Potencial Inhibitors
0
500Init
C fi i iti d
-500
Compounds
Confirming positive compounds
Selecting the most promising compounds (15)
OAV01-OAV02-OAV03-……-OAV15
Inhibitors of NS3 protease HTS