Embed Size (px)
Citation preview
DATA MANAGEMENT AND
PRESENTATION.
Presented By:
Mian Muhammad Syed Hassan Iqbal.Naveed Iqbal.Yaser Ud-din.Faisal Zahir.Mehboob Ali.Aftab Ahmad.
Royal College Of Nursing (SSSS).
OBJECTIVES:
By the end of presentation the students will be able to:
Define the term data ?? ??
Discuss the types of data and various methods of data
collection ?? ??
Discuss the different means and interpretation of data
presentation through:
Tables ?? ??
Graphs ?? ??
Charts ?? ??
12/19/2014 2
“DATA”
Data is a collection of facts, such as values or measurements.
It can Be:
o Numbers, words, measurements, observations or even just
descriptions of things.
Simply data is information.
12/19/2014 3
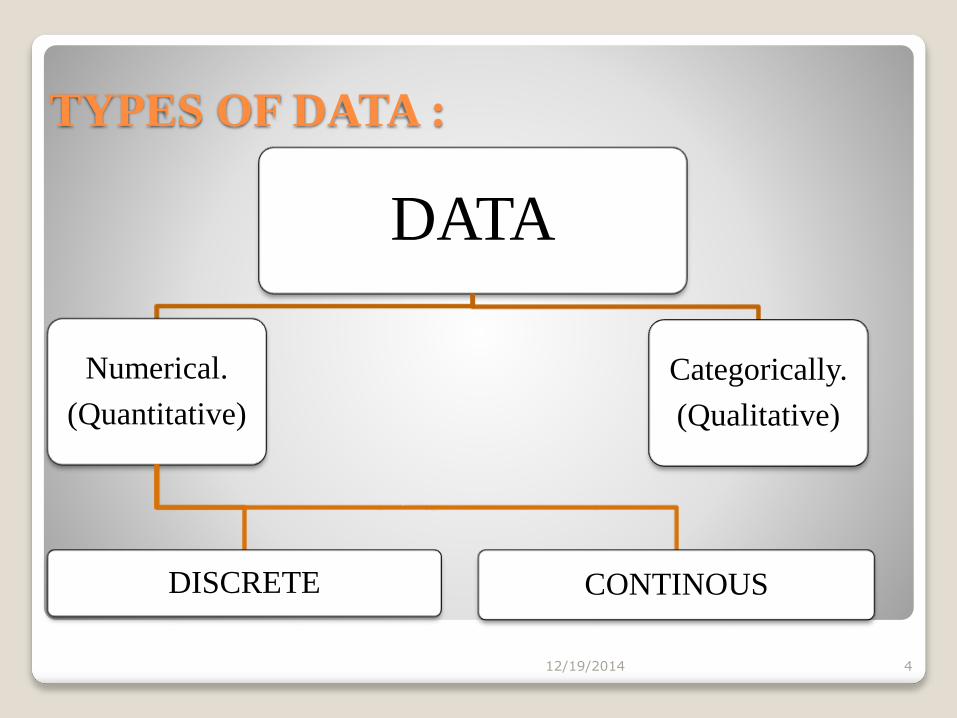
TYPES OF DATA :
DATA
Numerical.
(Quantitative)
DISCRETE CONTINOUS
Categorically.
(Qualitative)
12/19/2014 4
QUALITATIVE vs. QUANTITATIVE:
Data can be qualitative or quantitative.
• Qualitative data is descriptive information.
(It describes something).
• Quantitative data is numerical information.
(Numbers).
12/19/2014 5
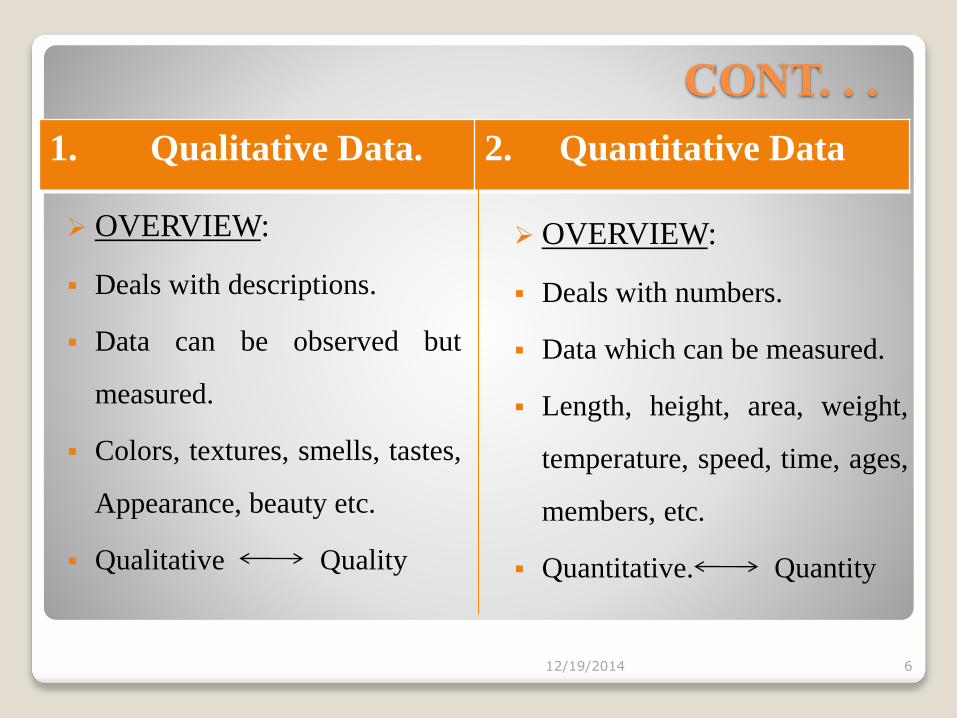
CONT. . .
1. Qualitative Data. 2. Quantitative Data
12/19/2014 6
OVERVIEW:
Deals with descriptions.
Data can be observed but
measured.
Colors, textures, smells, tastes,
Appearance, beauty etc.
Qualitative Quality
OVERVIEW:
Deals with numbers.
Data which can be measured.
Length, height, area, weight,
temperature, speed, time, ages,
members, etc.
Quantitative. Quantity
QUANTITATIVE DATA CAN ALSO BE:
Discrete or Continuous.
Discrete data can only takes certain values.
(Like whole numbers).
Continuous data can take any value.
(Within a range).
a) Discrete data is counted.
b) Continuous data is measured.
12/19/2014 7
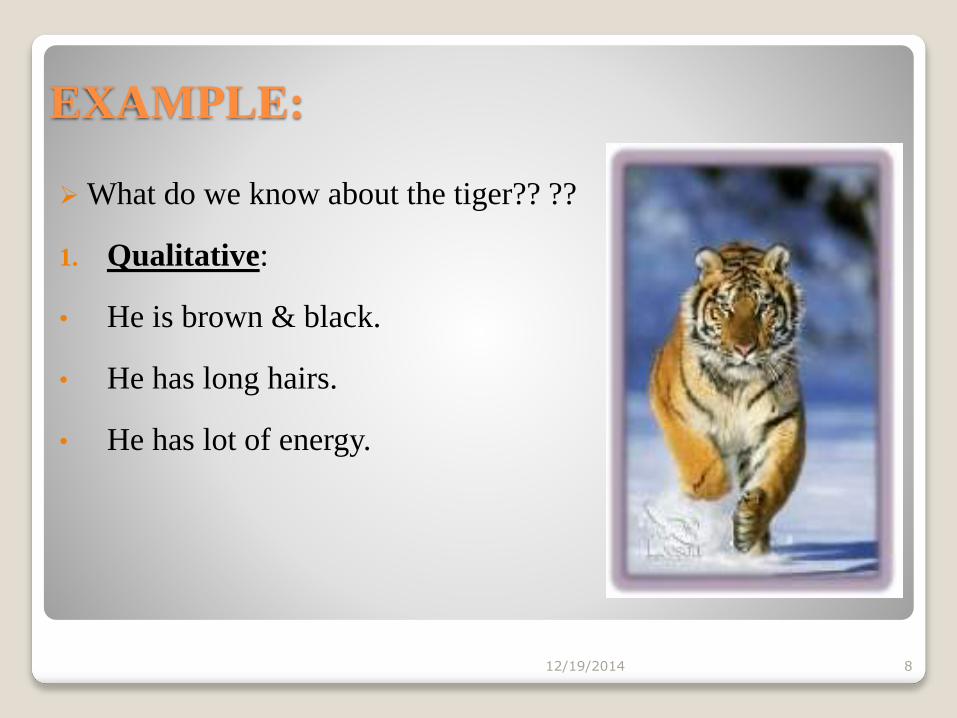
EXAMPLE:
12/19/2014 8
What do we know about the tiger?? ??
1. Qualitative:
• He is brown & black.
• He has long hairs.
• He has lot of energy.
EXAMPLE:
12/19/2014 9
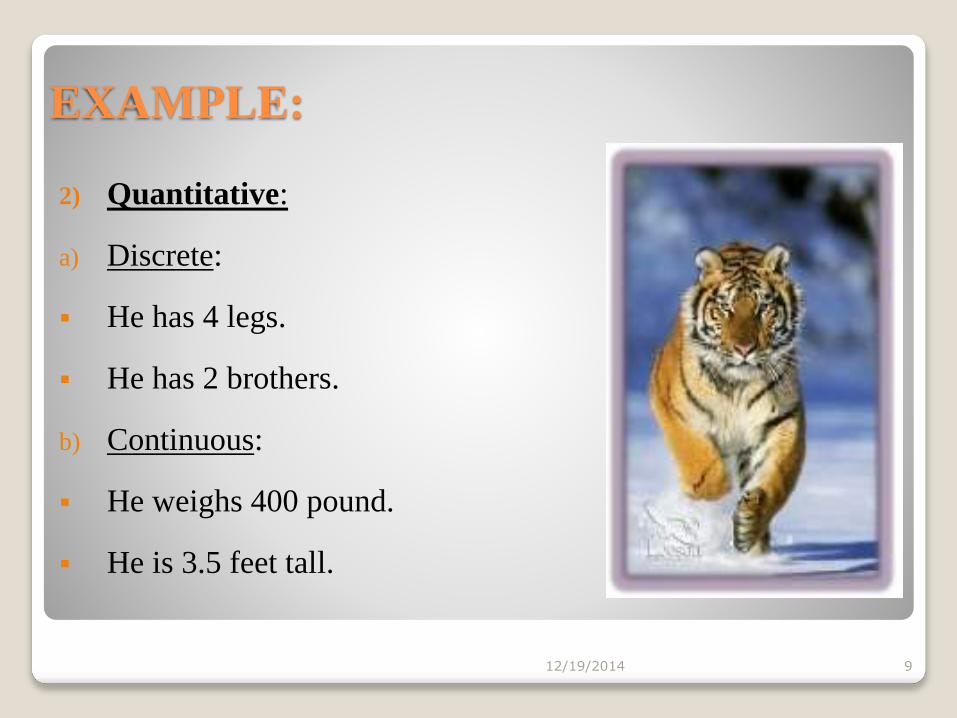
2) Quantitative:
a) Discrete:
He has 4 legs.
He has 2 brothers.
b) Continuous:
He weighs 400 pound.
He is 3.5 feet tall.
ANOTHER TYPES OF DATA :SPATIAL DATA. DEFINITIVE DATA.
12/19/2014 10
Which is normally presented
on maps and plans and
provides an indication of
where things are.
Usually provide in the form
of a drawing, which define a
particular item and the way
in which it has been or is to
be build.
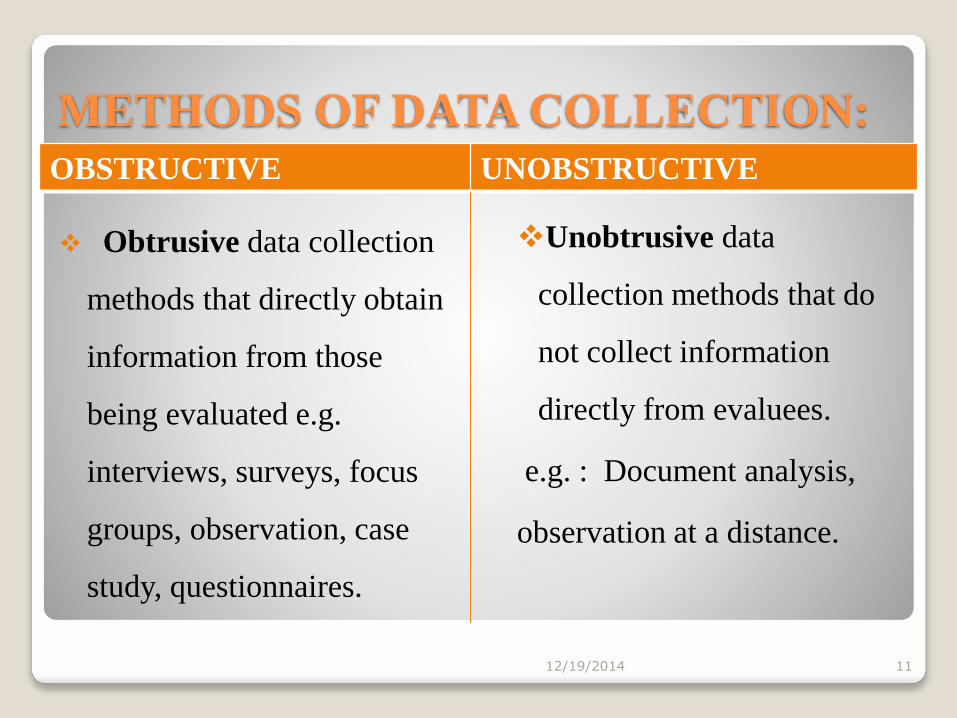
METHODS OF DATA COLLECTION:OBSTRUCTIVE UNOBSTRUCTIVE
12/19/2014 11
Obtrusive data collection
methods that directly obtain
information from those
being evaluated e.g.
interviews, surveys, focus
groups, observation, case
study, questionnaires.
Unobtrusive data
collection methods that do
not collect information
directly from evaluees.
e.g. : Document analysis,
observation at a distance.
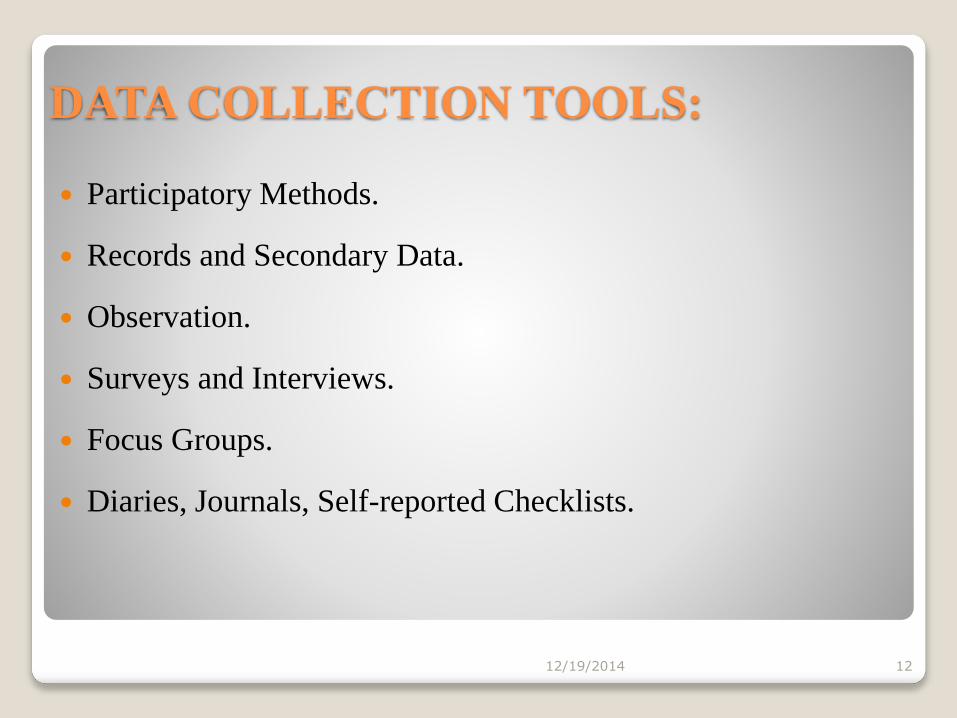
DATA COLLECTION TOOLS:
Participatory Methods.
Records and Secondary Data.
Observation.
Surveys and Interviews.
Focus Groups.
Diaries, Journals, Self-reported Checklists.
12/19/2014 12
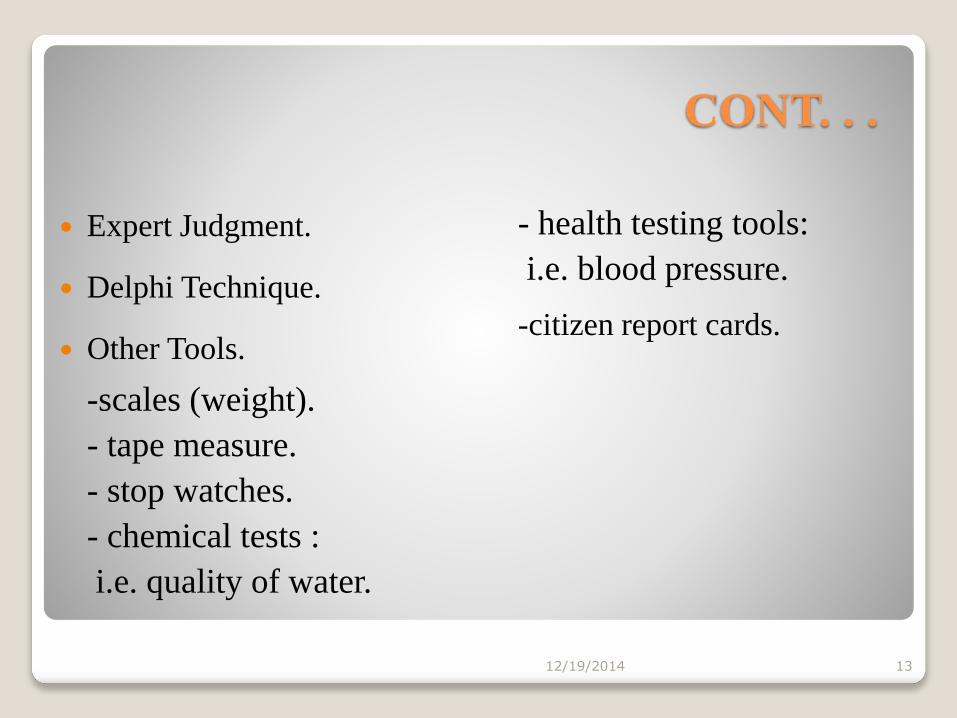
CONT. . .
Expert Judgment.
Delphi Technique.
Other Tools.
-scales (weight).
- tape measure.
- stop watches.
- chemical tests :
i.e. quality of water.
12/19/2014 13
- health testing tools:
i.e. blood pressure.
-citizen report cards.
DATA PRESENTATIONS:
1. TABLES.
2. GRAPH.
3. CHART.
12/19/2014 14
DATA PRESENTATIONS:
Tables:
◦ Simplest way to summarize data.
◦ Data are presented as absolute numbers or percentages.
12/19/2014 15
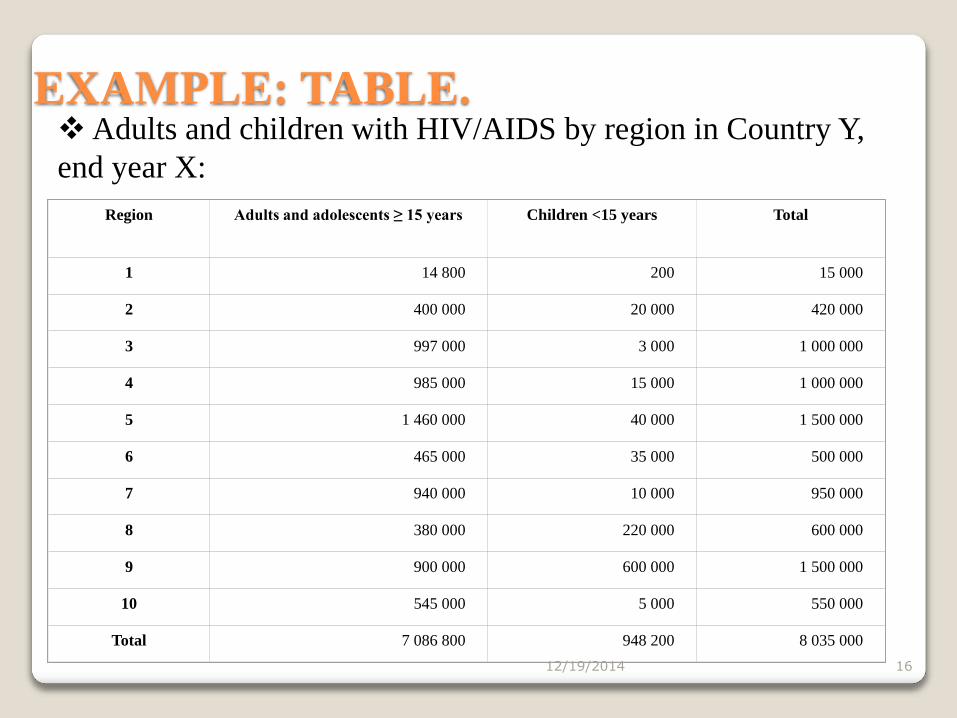
Adults and children with HIV/AIDS by region in Country Y,
end year X:
EXAMPLE: TABLE.
Region Adults and adolescents ≥ 15 years Children <15 years Total
1 14 800 200 15 000
2 400 000 20 000 420 000
3 997 000 3 000 1 000 000
4 985 000 15 000 1 000 000
5 1 460 000 40 000 1 500 000
6 465 000 35 000 500 000
7 940 000 10 000 950 000
8 380 000 220 000 600 000
9 900 000 600 000 1 500 000
10 545 000 5 000 550 000
Total 7 086 800 948 200 8 035 000
12/19/2014 16
CHARTS AND GRAPS:
Charts and graphs:
◦ Visual representation of data.
◦ Data are presented as absolute numbers or percentages
12/19/2014 17
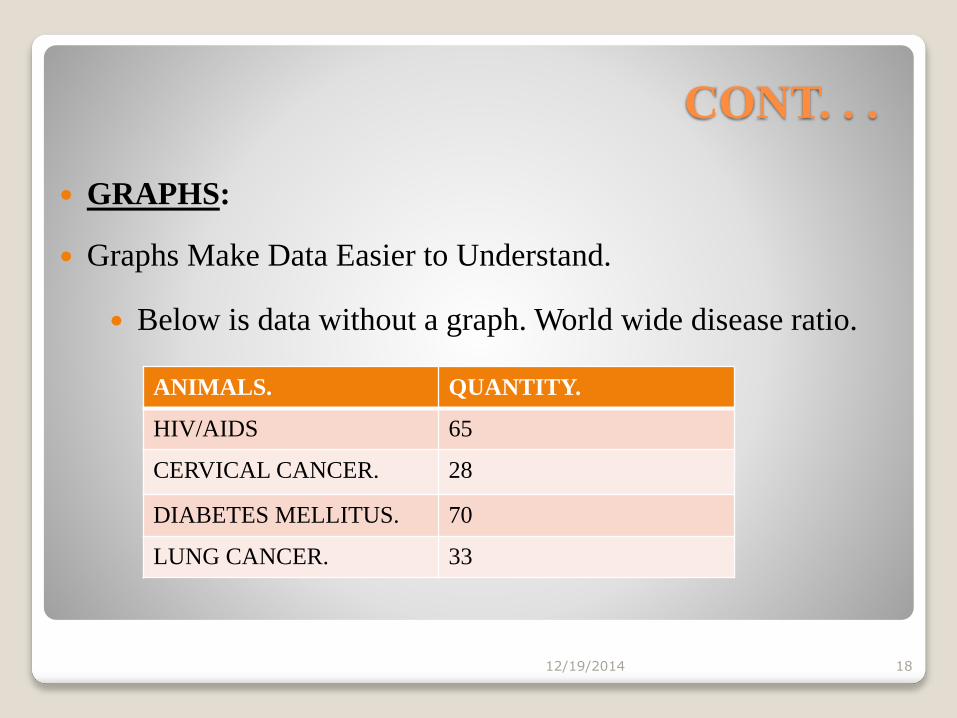
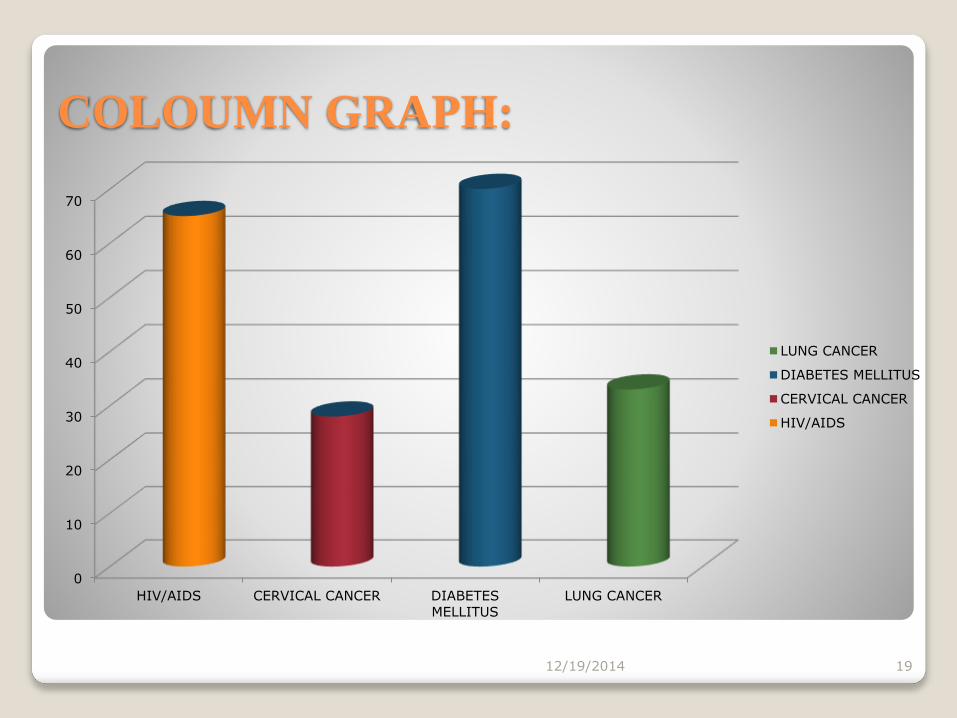
CONT. . .
GRAPHS:
Graphs Make Data Easier to Understand.
Below is data without a graph. World wide disease ratio.
12/19/2014 18
ANIMALS. QUANTITY.
HIV/AIDS 65
CERVICAL CANCER. 28
DIABETES MELLITUS. 70
LUNG CANCER. 33
12/19/2014 19
0
10
20
30
40
50
60
70
HIV/AIDS CERVICAL CANCER DIABETES
MELLITUS
LUNG CANCER
LUNG CANCER
DIABETES MELLITUS
CERVICAL CANCER
HIV/AIDS
COLOUMN GRAPH:
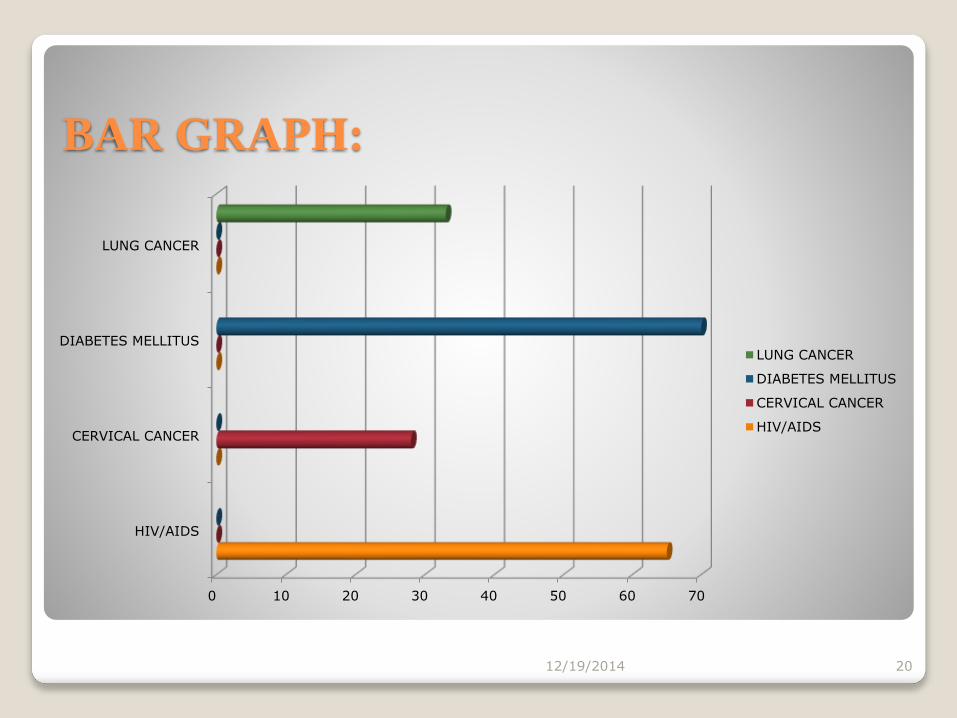
BAR GRAPH:
12/19/2014 20
0 10 20 30 40 50 60 70
HIV/AIDS
CERVICAL CANCER
DIABETES MELLITUS
LUNG CANCER
LUNG CANCER
DIABETES MELLITUS
CERVICAL CANCER
HIV/AIDS
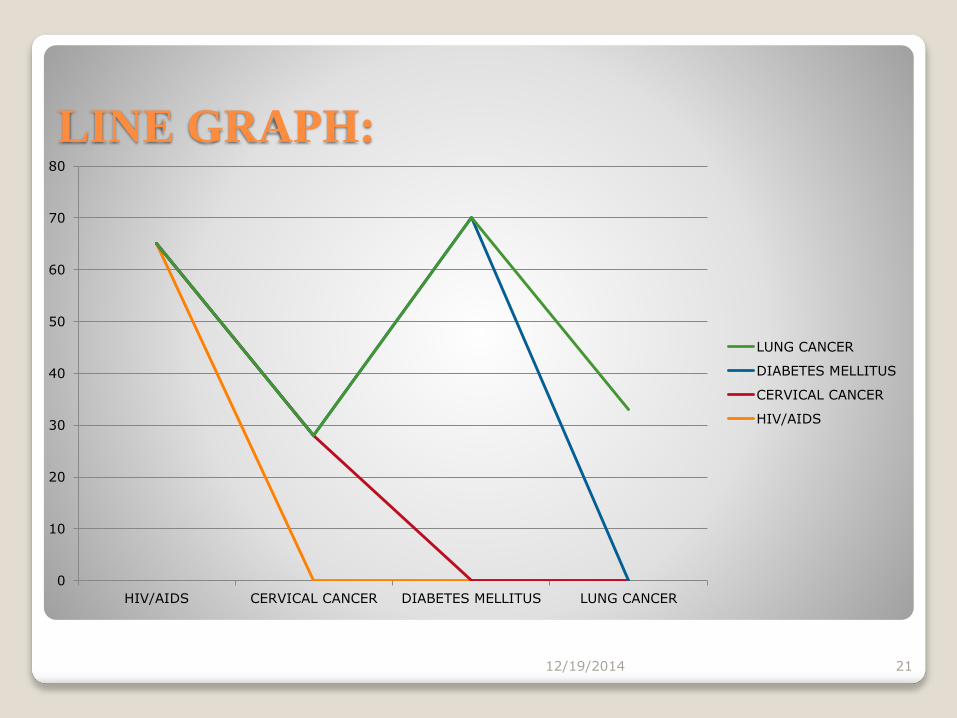
LINE GRAPH:
12/19/2014 21
0
10
20
30
40
50
60
70
80
HIV/AIDS CERVICAL CANCER DIABETES MELLITUS LUNG CANCER
LUNG CANCER
DIABETES MELLITUS
CERVICAL CANCER
HIV/AIDS
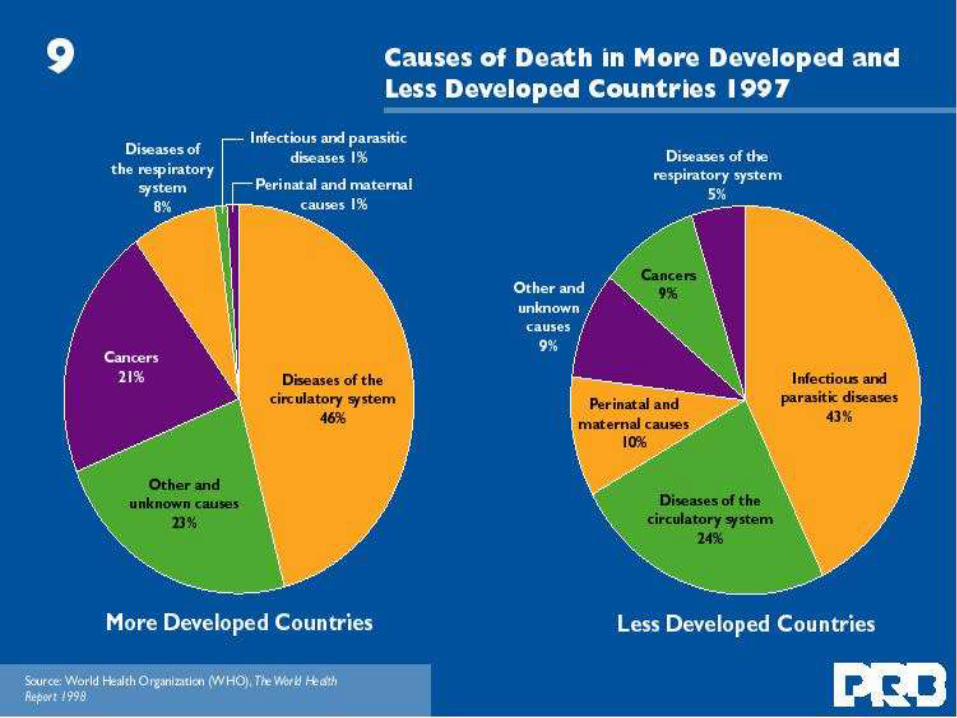
PIE CHARTS:
A circular (360 degree) graphic representation
Compares subclasses or categories to the whole class or
category using differently coloured or patterned segments.
12/19/2014 22
12/19/2014 23
DATA INTERPRETATION:
1. It involves 2 terms:
• ‘Results’ – presentation of data/findings
(statistics).
• ‘Discussion’ – interpretation of data/findings.
2. Things to consider when interpreting your data:
• Interpret findings based on the purpose and
objectives of your study.
• Relate the findings to real life context.
12/19/2014 24
CONT. . .
• Use persuasive language to convince your readers.
• To see the research from your point of view.
• Order your interpretation to highlight the most
important findings.
• Include limitations to your research.
• Use simple, clear language.
12/19/2014 25

12/19/2014 26

12/19/2014 27

12/19/2014 28