Embed Size (px)
Citation preview

DKA mythology
Sergei Shushunov, MD

MYTH:
A popular belief or tradition that has grown up around
something or someoneMerriam-Webster dictionary
A traditional or legendary story, usually concerning some
being or hero or event, with or without a determinable
basis of fact or a natural explanation, especially one that
is concerned with deities or demigods and explains some
practice, rite, or phenomenon of nature.Dictionary.com
A sacred narrationWikipedia.com
Patients with DKA have at least 10% dehydration
Patients with DKA have at least 10% dehydration
Rehydration should be started with isotonic saline solution
Patients with DKA have at least 10% dehydration
Rehydration should be started with isotonic saline solution
Effective serum osmolarity is a good estimate of total serum osmolarity
Patients with DKA have at least 10% dehydration
Rehydration should be started with isotonic saline solution
Effective serum osmolarity is a good estimate of total serum osmolarity
Measured serum sodium should be converted to adjusted serum sodium using a correction factor.
Patients with DKA have at least 10% dehydration
Rehydration should be started with isotonic saline solution
Effective serum osmolarity is a good estimate of total serum osmolarity
Measured serum sodium should be converted to adjusted serum sodium using a correction factor.
Hyponatremia should not be corrected if the serum sodium value adjusted forthe degree of hyperglycemia is within normal range
Patients with DKA have at least 10% dehydration
Rehydration should be started with isotonic saline solution
Effective serum osmolarity is a good estimate of total serum osmolarity
Measured serum sodium should be converted to adjusted serum sodium usinga correction factor.
Do not correct hyponatremia if the serum sodium value adjusted forthe degree of hyperglycemia is within normal range
Insulin should be administered at a low dose of 0.1U/kg/h.
Patients with DKA have at least 10% dehydration
Rehydration should be started with isotonic saline solution
Effective serum osmolarity is a good estimate of total serum osmolarity
Measured serum sodium should be converted to adjusted serum sodium using a correction factor.
Do not correct hyponatremia if the serum sodium value adjusted forthe degree of hyperglycemia is within normal range
Insulin should be administered at a low dose of 0.1U/kg/h.
Serum glucose should be allowed to decrease by 50 to 100 mg% per hour
Patients with DKA have at least 10% dehydration
Rehydration should be started with isotonic saline solution
Effective serum osmolarity is a good estimate of total serum osmolarity
Measured serum sodium should be converted to adjusted serum sodium usinga correction factor.
Do not correct hyponatremia if the serum sodium value adjusted forthe degree of hyperglycemia is within normal range
Insulin should be administered at a low dose of 0.1U/kg/h.
Serum glucose should decrease by 50 to 100 mg% per hour
5% to 10% dextrose should be added once the serum glucose concentration falls to approximately 250 mg%
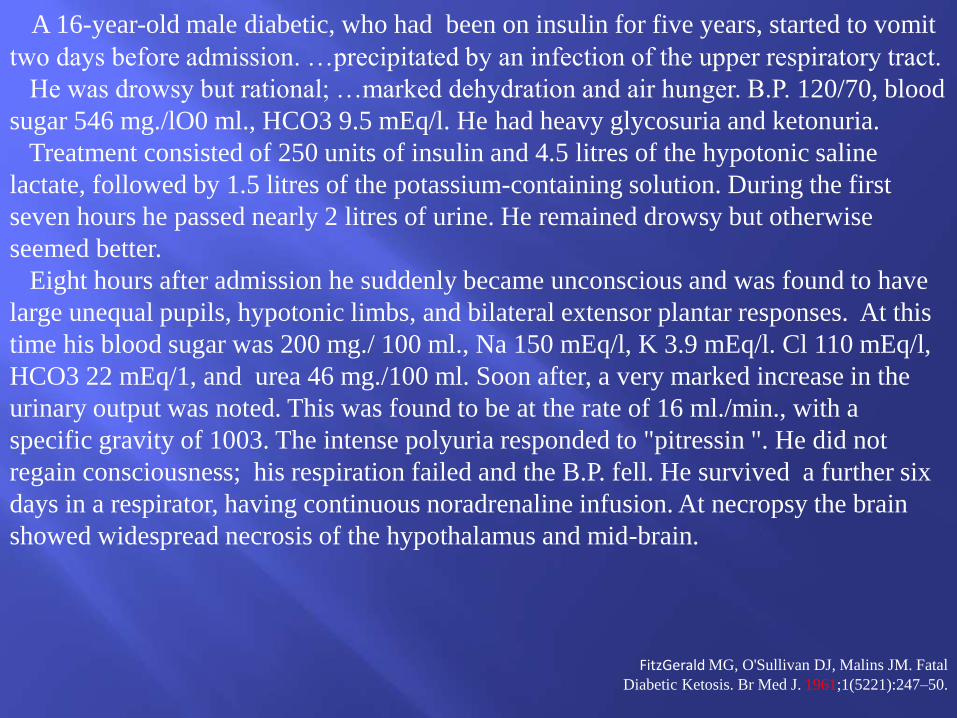
A 16-year-old male diabetic, who had been on insulin for five years, started to vomit
two days before admission. …precipitated by an infection of the upper respiratory tract.
He was drowsy but rational; …marked dehydration and air hunger. B.P. 120/70, blood
sugar 546 mg./lO0 ml., HCO3 9.5 mEq/l. He had heavy glycosuria and ketonuria.
Treatment consisted of 250 units of insulin and 4.5 litres of the hypotonic saline
lactate, followed by 1.5 litres of the potassium-containing solution. During the first
seven hours he passed nearly 2 litres of urine. He remained drowsy but otherwise
seemed better.
Eight hours after admission he suddenly became unconscious and was found to have
large unequal pupils, hypotonic limbs, and bilateral extensor plantar responses. At this
time his blood sugar was 200 mg./ 100 ml., Na 150 mEq/l, K 3.9 mEq/l. Cl 110 mEq/l,
HCO3 22 mEq/1, and urea 46 mg./100 ml. Soon after, a very marked increase in the
urinary output was noted. This was found to be at the rate of 16 ml./min., with a
specific gravity of 1003. The intense polyuria responded to "pitressin ". He did not
regain consciousness; his respiration failed and the B.P. fell. He survived a further six
days in a respirator, having continuous noradrenaline infusion. At necropsy the brain
showed widespread necrosis of the hypothalamus and mid-brain.
FitzGerald MG, O'Sullivan DJ, Malins JM. Fatal
Diabetic Ketosis. Br Med J. 1961;1(5221):247–50.
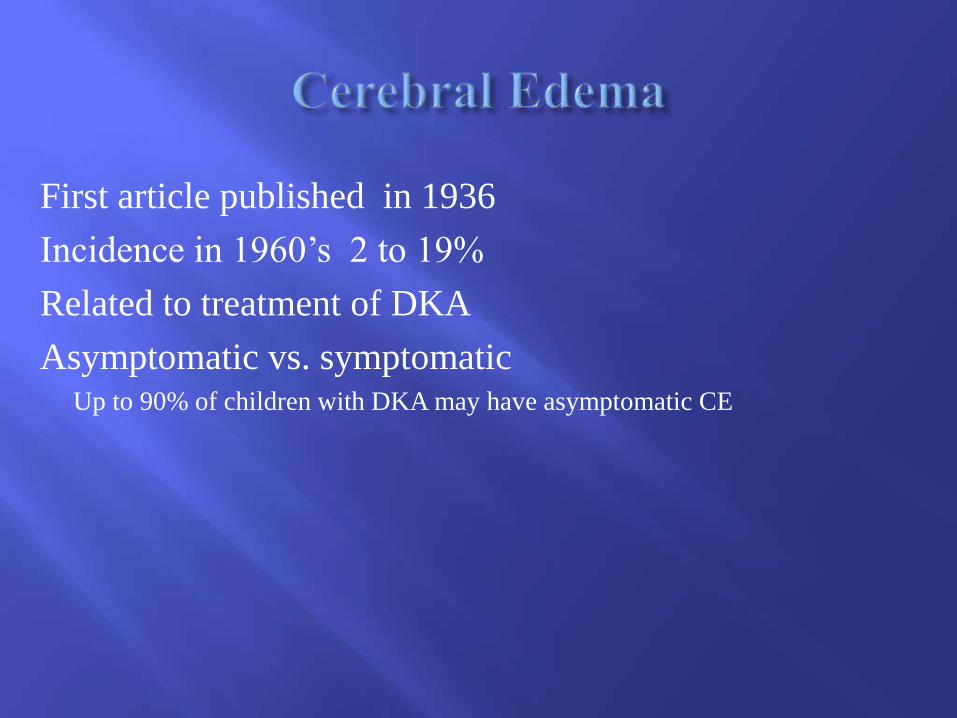
First article published in 1936
First article published in 1936
Incidence in 1960’s 2 to 19%
First article published in 1936
Incidence in 1960’s 2 to 19%
Related to treatment of DKA
First article published in 1936
Incidence in 1960’s 2 to 19%
Related to treatment of DKA
Asymptomatic vs. symptomaticUp to 90% of children with DKA may have asymptomatic CE
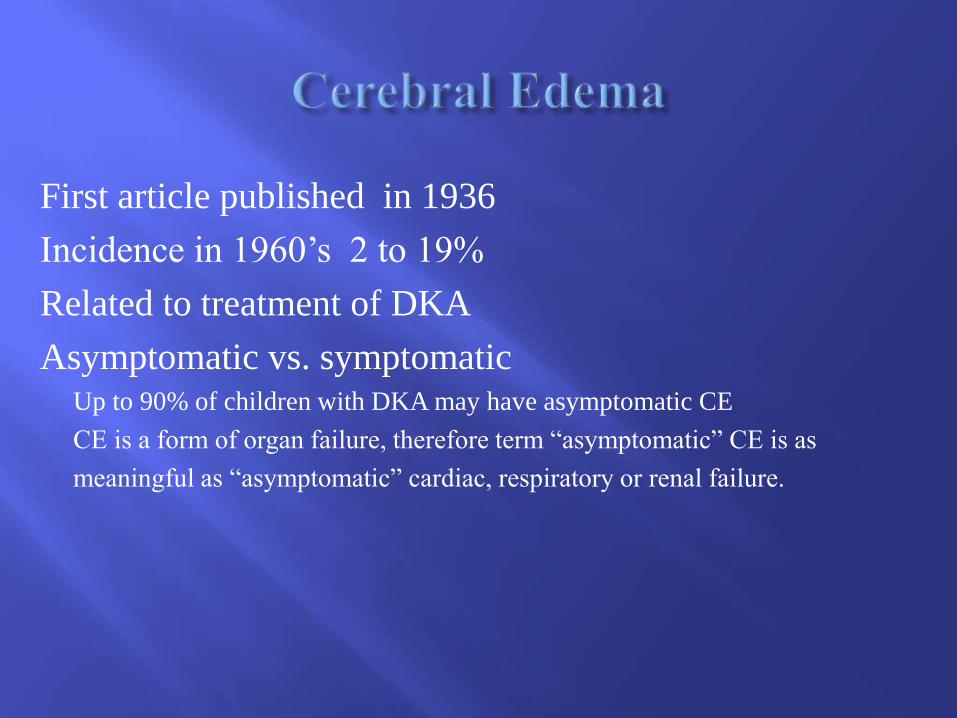
First article published in 1936
Incidence in 1960’s 2 to 19%
Related to treatment of DKA
Asymptomatic vs. symptomaticUp to 90% of children with DKA may have asymptomatic CE
CE is a form of organ failure, therefore term “asymptomatic” CE is as
meaningful as “asymptomatic” cardiac, respiratory or renal failure.
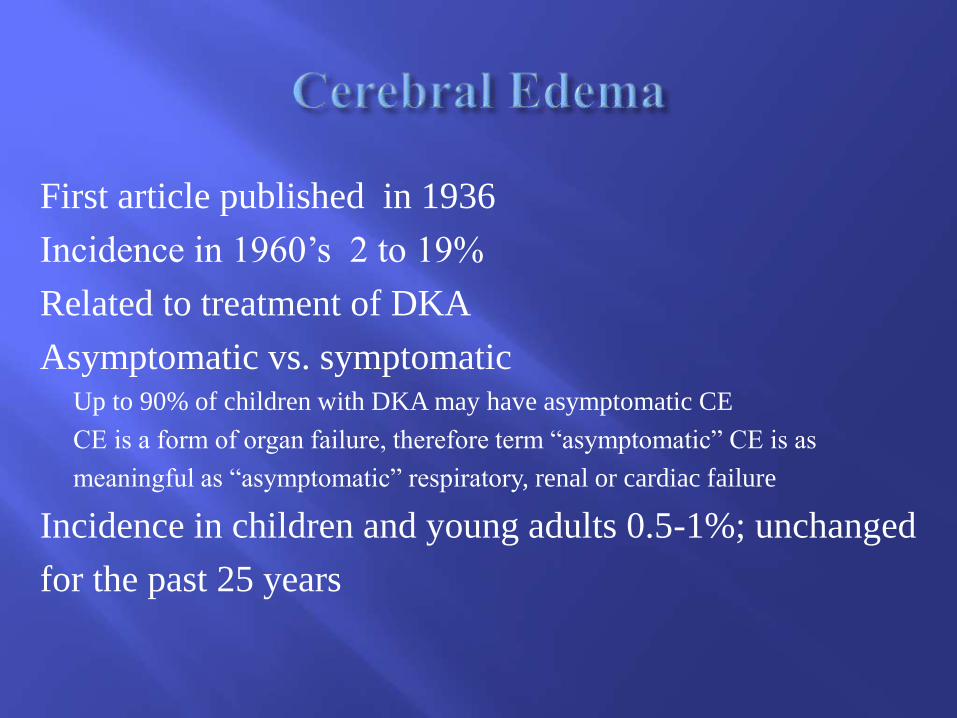
First article published in 1936
Incidence in 1960’s 2 to 19%
Related to treatment of DKA
Asymptomatic vs. symptomaticUp to 90% of children with DKA may have asymptomatic CE
CE is a form of organ failure, therefore term “asymptomatic” CE is as
meaningful as “asymptomatic” respiratory, renal or cardiac failure
Incidence in children and young adults 0.5-1%; unchanged
for the past 25 years
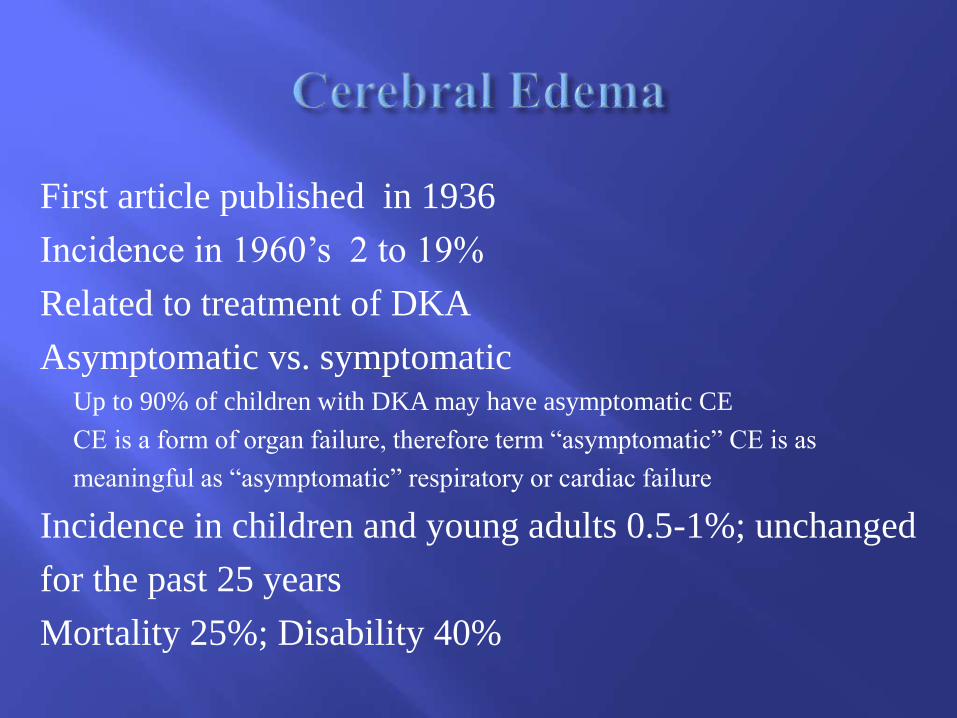
First article published in 1936
Incidence in 1960’s 2 to 19%
Related to treatment of DKA
Asymptomatic vs. symptomaticUp to 90% of children with DKA may have asymptomatic CE
CE is a form of organ failure, therefore term “asymptomatic” CE is as
meaningful as “asymptomatic” respiratory or cardiac failure
Incidence in children and young adults 0.5-1%; unchanged
for the past 25 years
Mortality 25%; Disability 40%
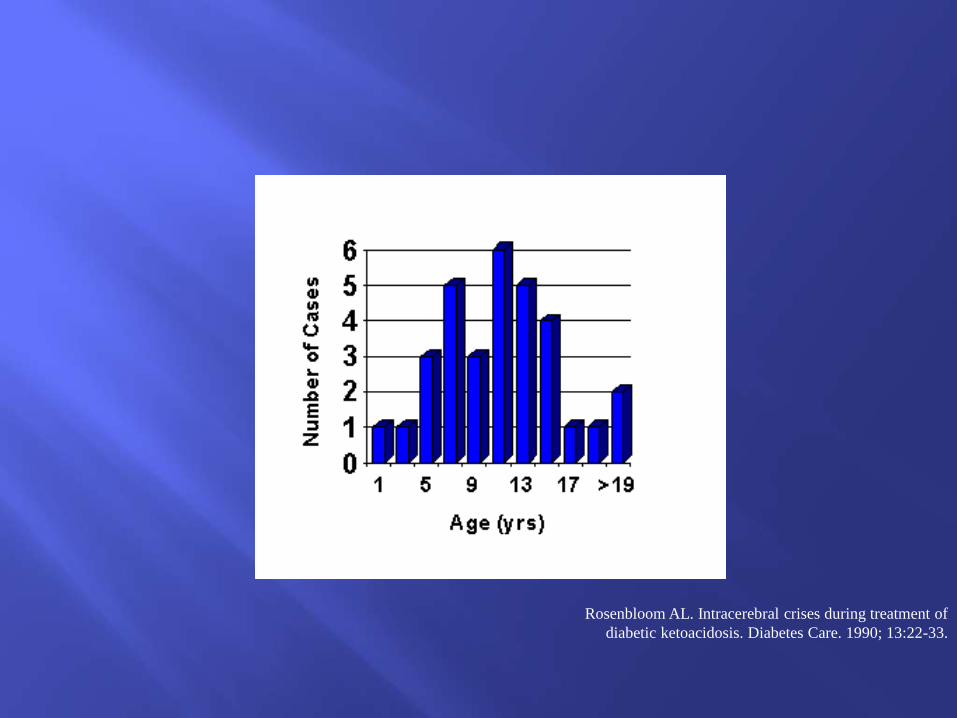
Rosenbloom AL. Intracerebral crises during treatment of
diabetic ketoacidosis. Diabetes Care. 1990; 13:22-33.
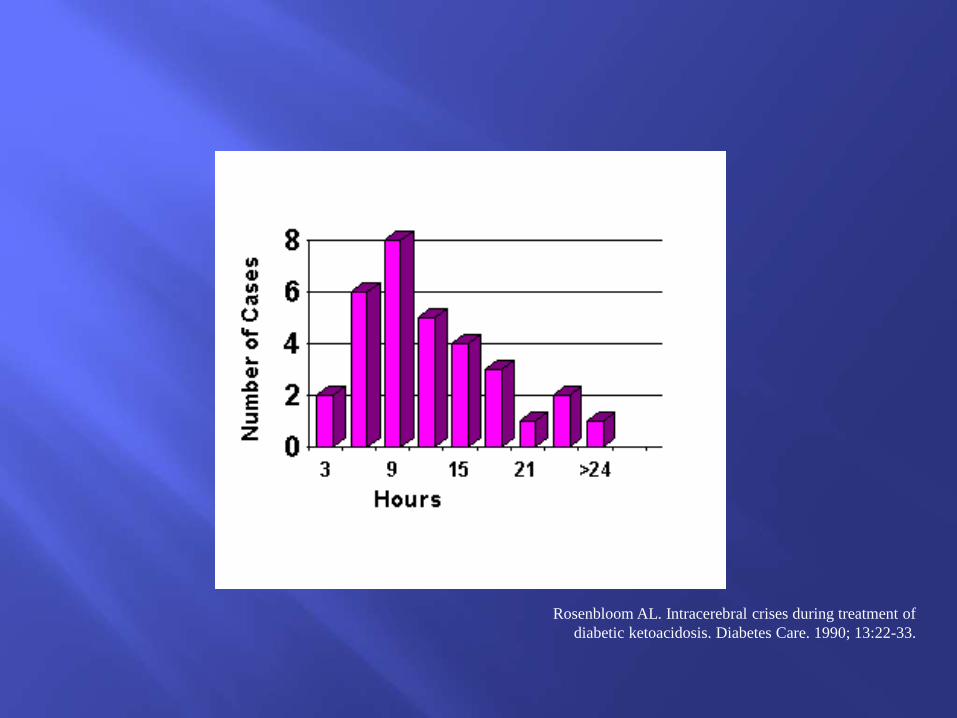
Rosenbloom AL. Intracerebral crises during treatment of
diabetic ketoacidosis. Diabetes Care. 1990; 13:22-33.
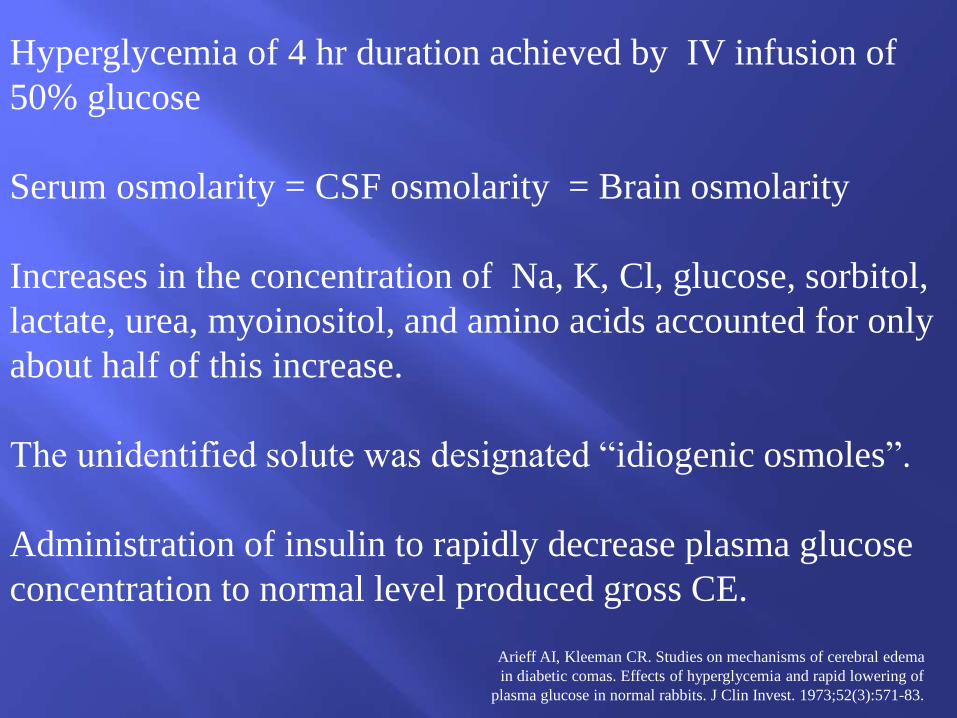
Arieff AI, Kleeman CR. Studies on mechanisms of cerebral edema
in diabetic comas. Effects of hyperglycemia and rapid lowering of
plasma glucose in normal rabbits. J Clin Invest. 1973;52(3):571-83.
Hyperglycemia of 4 hr duration achieved by IV infusion of
50% glucose
Serum osmolarity = CSF osmolarity = Brain osmolarity
Increases in the concentration of Na, K, Cl, glucose, sorbitol,
lactate, urea, myoinositol, and amino acids accounted for only
about half of this increase.
The unidentified solute was designated “idiogenic osmoles”.
Administration of insulin to rapidly decrease plasma glucose
concentration to normal level produced gross CE.
Ayus JC, Armstrong DL, Arieff AI. Effects of hypernatremia in the central nervous
system and its therapy in rats and rabbits Journal of Physiology;1999:492(1)243-55
Hypernatremic rabbits (serum Na 170-190 mEq/L) treated
with 1/2 NS IV to normalize plasma Na over 4-24 h
intervals.
Therapy resulted in significant brain edema.
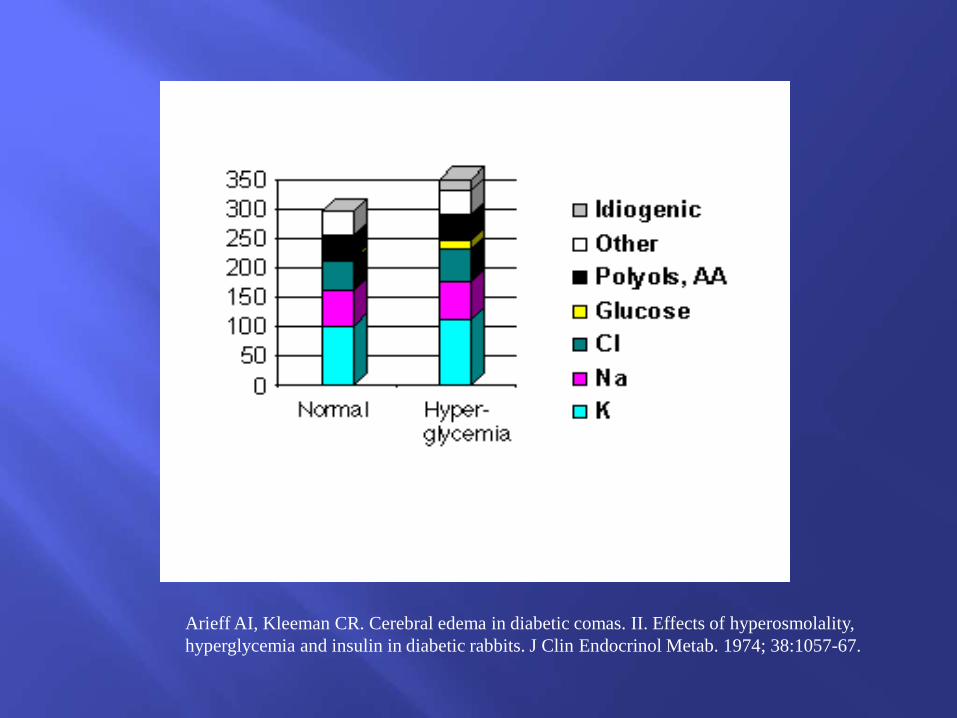
Arieff AI, Kleeman CR. Cerebral edema in diabetic comas. II. Effects of hyperosmolality,
hyperglycemia and insulin in diabetic rabbits. J Clin Endocrinol Metab. 1974; 38:1057-67.
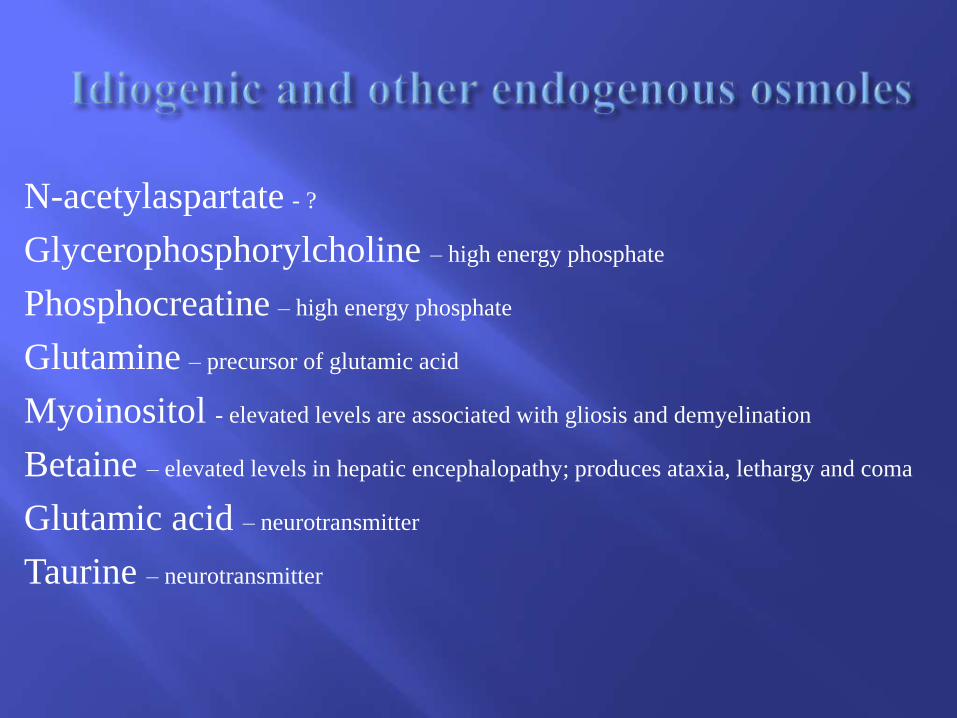
N-acetylaspartate - ?
Glycerophosphorylcholine – high energy phosphate
Phosphocreatine – high energy phosphate
Glutamine – precursor of glutamic acid
Myoinositol - elevated levels are associated with gliosis and demyelination
Betaine – elevated levels in hepatic encephalopathy; produces ataxia, lethargy and coma
Glutamic acid – neurotransmitter
Taurine – neurotransmitter

Patients with DKA have at least 10% dehydration
Fluid resuscitation!
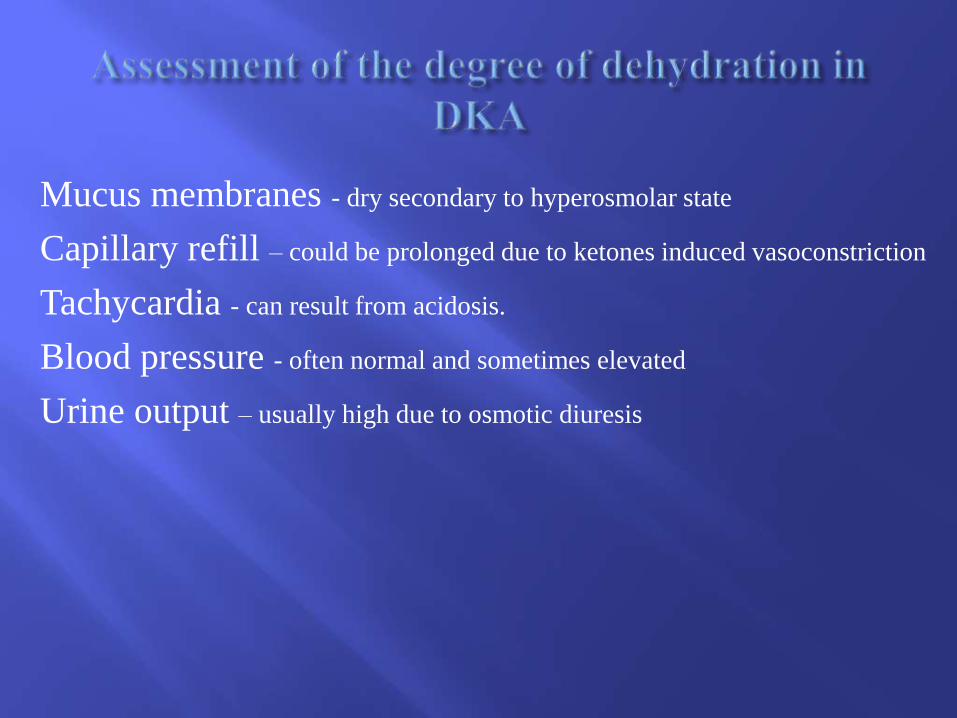
Mucus membranes - dry secondary to hyperosmolar state
Mucus membranes - dry secondary to hyperosmolar state
Capillary refill – could be prolonged due to ketones induced vasoconstriction
Mucus membranes - dry secondary to hyperosmolar state
Capillary refill – could be prolonged due to ketones induced vasoconstriction
Tachycardia - can result from acidosis.
Mucus membranes - dry secondary to hyperosmolar state
Capillary refill – could be prolonged due to ketones induced vasoconstriction
Tachycardia - can result from acidosis.
Blood pressure - often normal and sometimes elevated
Mucus membranes - dry secondary to hyperosmolar state
Capillary refill – could be prolonged due to ketones induced vasoconstriction
Tachycardia - can result from acidosis.
Blood pressure - often normal and sometimes elevated
Urine output – usually high due to osmotic diuresis
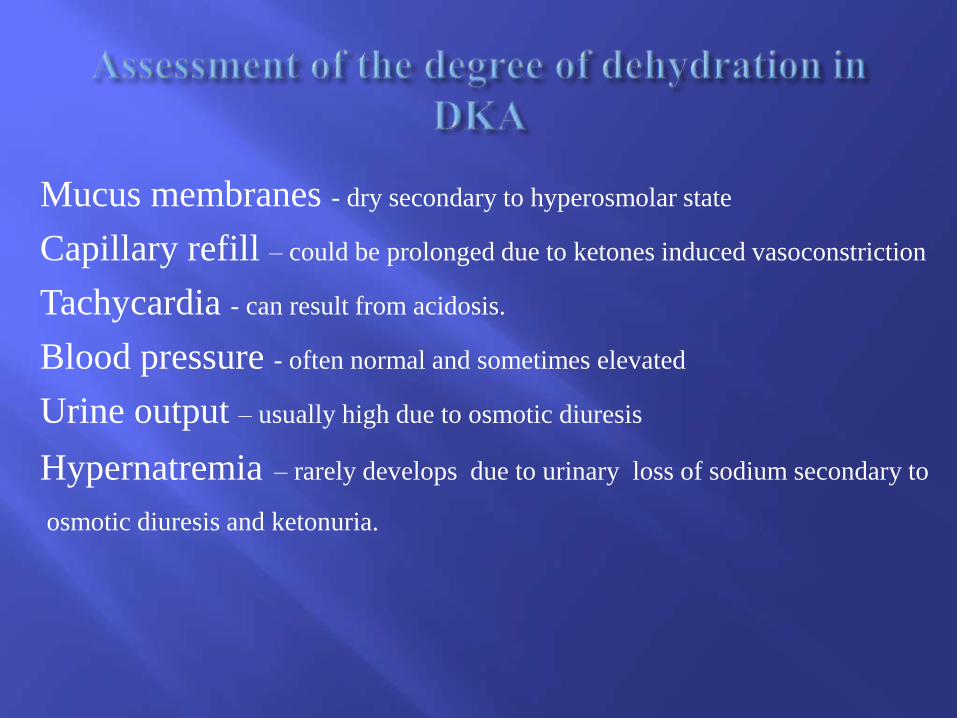
Mucus membranes - dry secondary to hyperosmolar state
Capillary refill – could be prolonged due to ketones induced vasoconstriction
Tachycardia - can result from acidosis.
Blood pressure - often normal and sometimes elevated
Urine output – usually high due to osmotic diuresis
Hypernatremia – rarely develops due to urinary loss of sodium secondary to
osmotic diuresis and ketonuria.
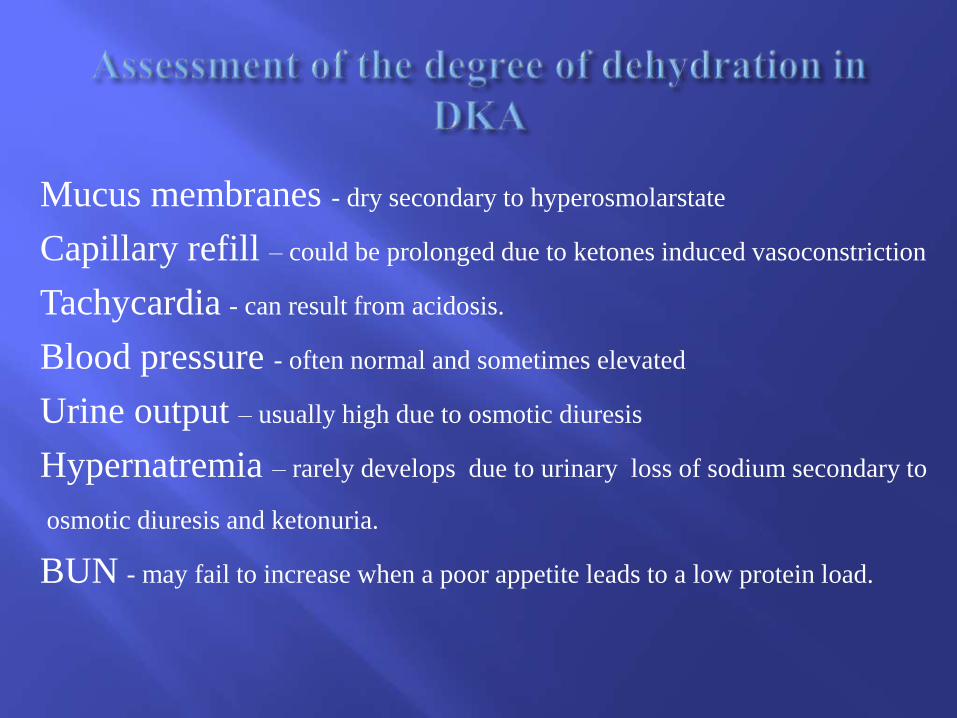
Mucus membranes - dry secondary to hyperosmolarstate
Capillary refill – could be prolonged due to ketones induced vasoconstriction
Tachycardia - can result from acidosis.
Blood pressure - often normal and sometimes elevated
Urine output – usually high due to osmotic diuresis
Hypernatremia – rarely develops due to urinary loss of sodium secondary to
osmotic diuresis and ketonuria.
BUN - may fail to increase when a poor appetite leads to a low protein load.
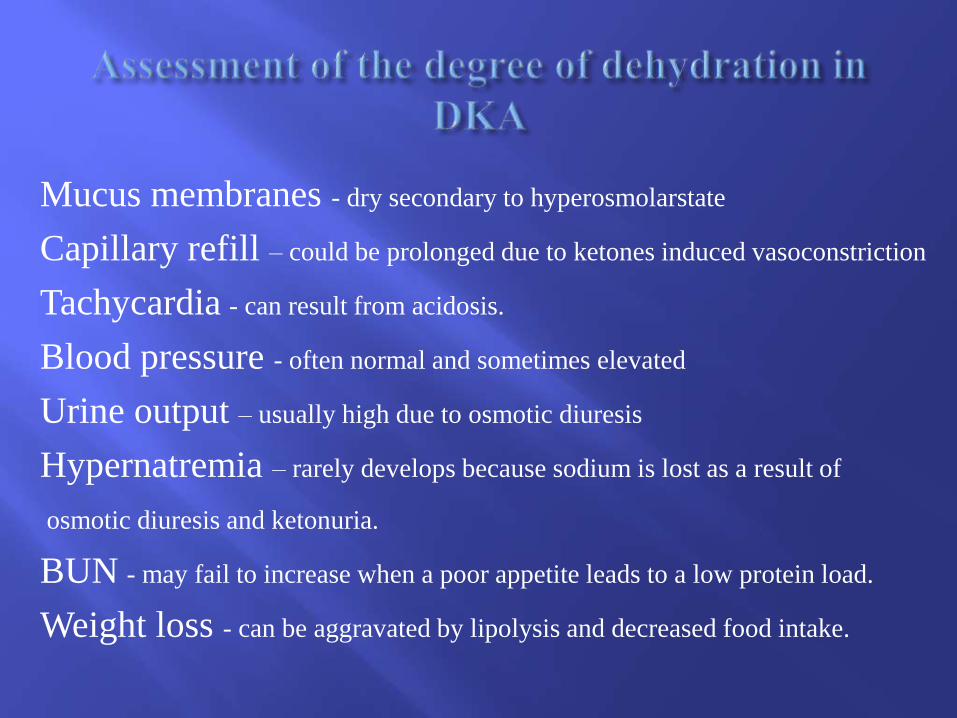
Mucus membranes - dry secondary to hyperosmolarstate
Capillary refill – could be prolonged due to ketones induced vasoconstriction
Tachycardia - can result from acidosis.
Blood pressure - often normal and sometimes elevated
Urine output – usually high due to osmotic diuresis
Hypernatremia – rarely develops because sodium is lost as a result of
osmotic diuresis and ketonuria.
BUN - may fail to increase when a poor appetite leads to a low protein load.
Weight loss - can be aggravated by lipolysis and decreased food intake.
No correlation with the degree of ketoacidosis
Misleading physical examination with overestimation of
the degree in dehydration in the majority of patients
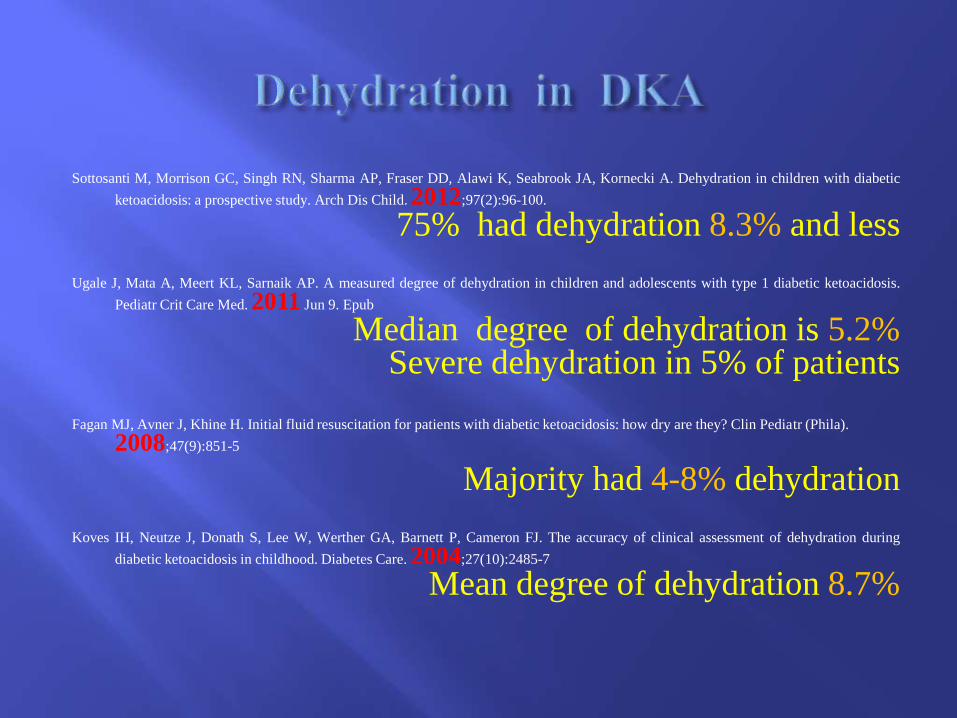
Sottosanti M, Morrison GC, Singh RN, Sharma AP, Fraser DD, Alawi K, Seabrook JA, Kornecki A. Dehydration in children with diabetic
ketoacidosis: a prospective study. Arch Dis Child. 2012;97(2):96-100.
75% had dehydration 8.3% and less
Ugale J, Mata A, Meert KL, Sarnaik AP. A measured degree of dehydration in children and adolescents with type 1 diabetic ketoacidosis.
Pediatr Crit Care Med. 2011 Jun 9. Epub
Median degree of dehydration is 5.2%Severe dehydration in 5% of patients
Fagan MJ, Avner J, Khine H. Initial fluid resuscitation for patients with diabetic ketoacidosis: how dry are they? Clin Pediatr (Phila).
2008;47(9):851-5
Majority had 4-8% dehydration
Koves IH, Neutze J, Donath S, Lee W, Werther GA, Barnett P, Cameron FJ. The accuracy of clinical assessment of dehydration during
diabetic ketoacidosis in childhood. Diabetes Care. 2004;27(10):2485-7
Mean degree of dehydration 8.7%
What Fluid resuscitation?

Rehydration should be started with isotonic saline
solution


It depends on the patient’s serum osmolarity

Effective serum osmolarity is a good estimate of
factors influencing water shift between the serum and
cerebral cells in patients with DKA
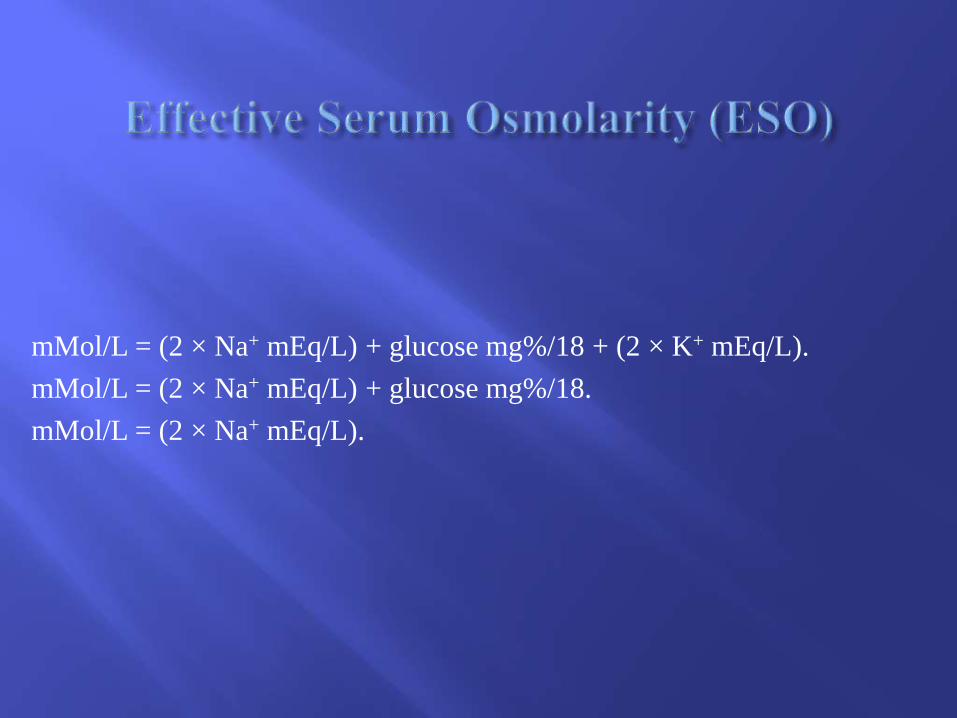
mMol/L = (2 × Na+ mEq/L) + glucose mg%/18 + (2 × K+ mEq/L).
mMol/L = (2 × Na+ mEq/L) + glucose mg%/18.
mMol/L = (2 × Na+ mEq/L).
The exclusion of potassium from some of the equations is
justified by the fact that changes of serum potassium level in
humans occur within a very narrow range, which precludes
significant changes of serum osmolarity due to changes in
serum potassium concentration.
The exclusion of urea is based on the notion that urea moves
freely across cellular membranes of almost all organs, and for
this reason, does not have a significant contribution to water
movement across biological membranes.
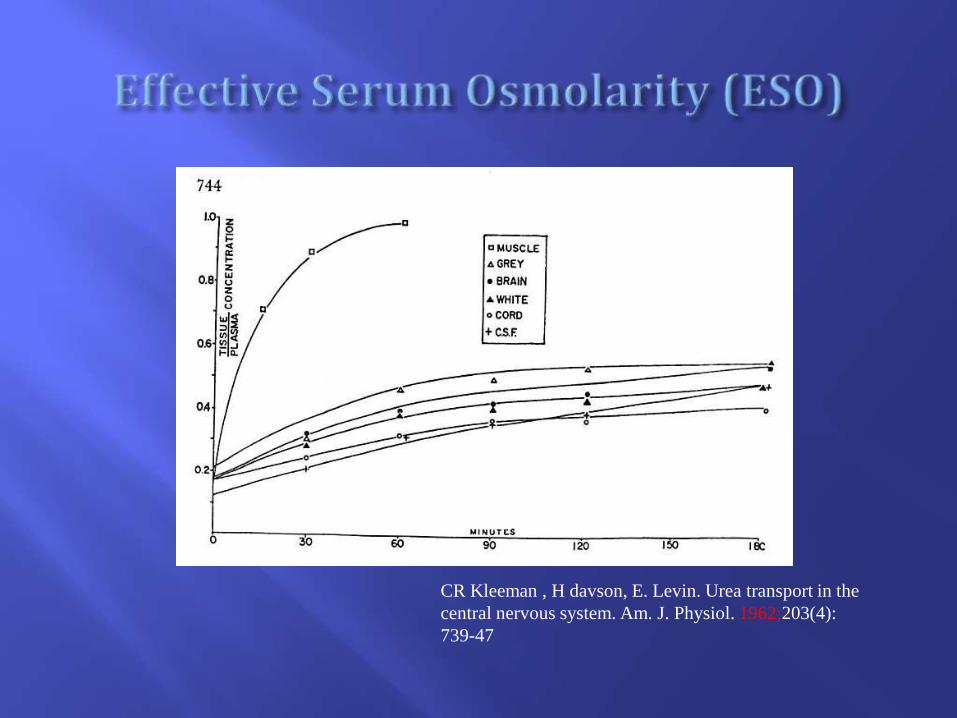
CR Kleeman , H davson, E. Levin. Urea transport in the
central nervous system. Am. J. Physiol. 1962;203(4):
739-47
Despite its apparent distribution throughout total body
water…, urea causes marked reduction in intraocular and
CSF pressure…
…(urea) transport kinetics with respect to CSF and central
neural tissues differ considerably from non-neural tissuesCR Kleeman , H davson, E. Levin. Urea transport in the
Central nervous system. Am. J. Physiol. 1962;203(4): 739-47
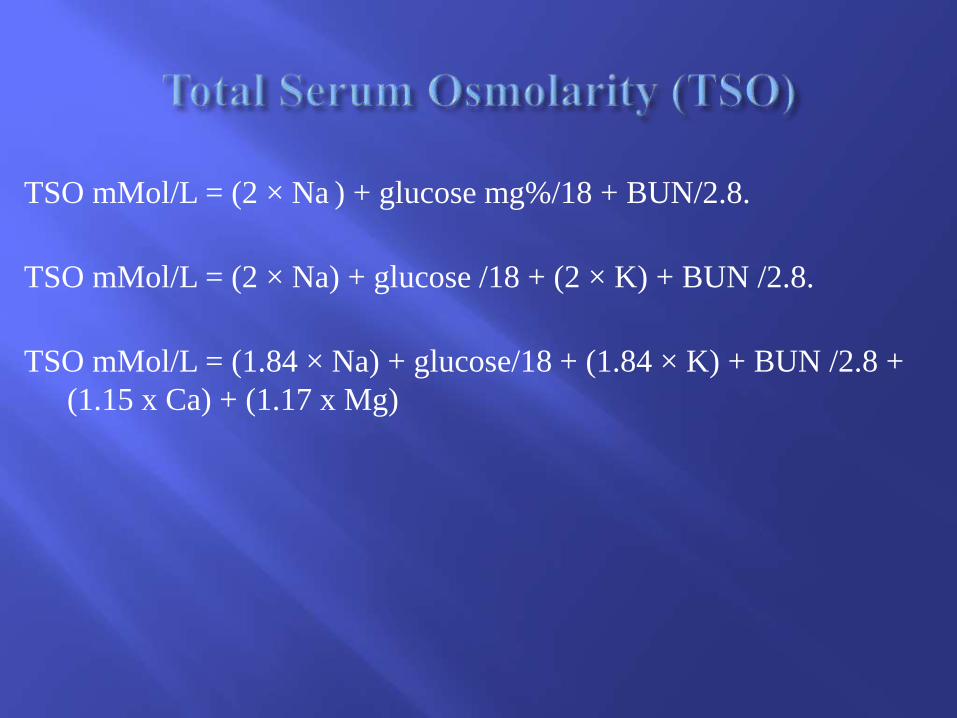
TSO mMol/L = (2 × Na ) + glucose mg%/18 + BUN/2.8.
TSO mMol/L = (2 × Na) + glucose /18 + (2 × K) + BUN /2.8.
TSO mMol/L = (1.84 × Na) + glucose/18 + (1.84 × K) + BUN /2.8 +
(1.15 x Ca) + (1.17 x Mg)
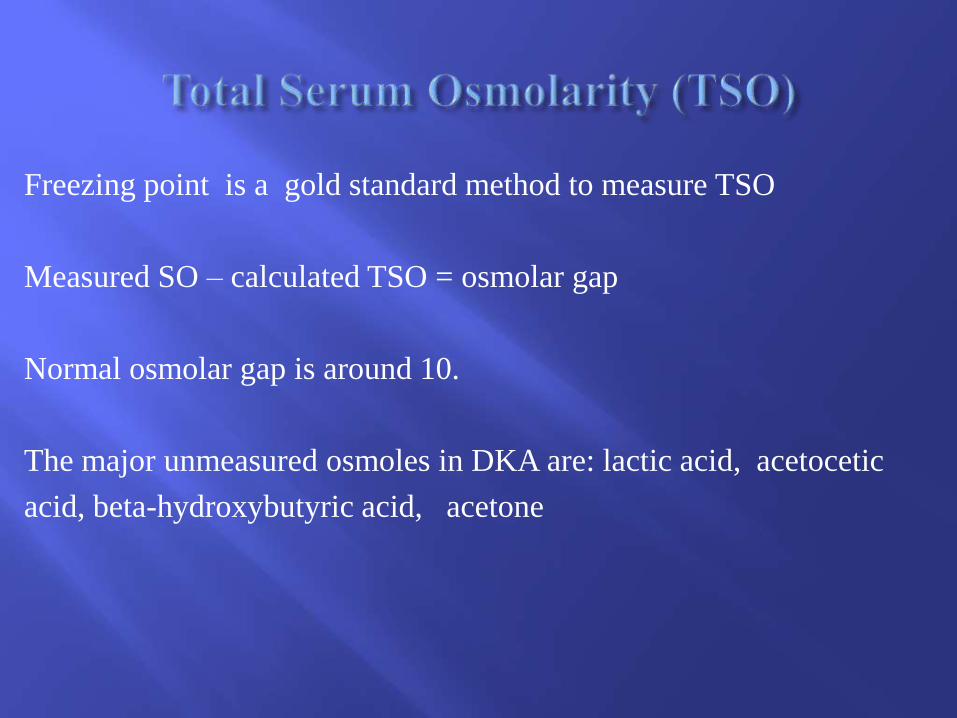
Freezing point is a gold standard method to measure TSO
Measured SO – calculated TSO = osmolar gap
Normal osmolar gap is around 10.
The major unmeasured osmoles in DKA are: lactic acid, acetocetic
acid, beta-hydroxybutyric acid, acetone
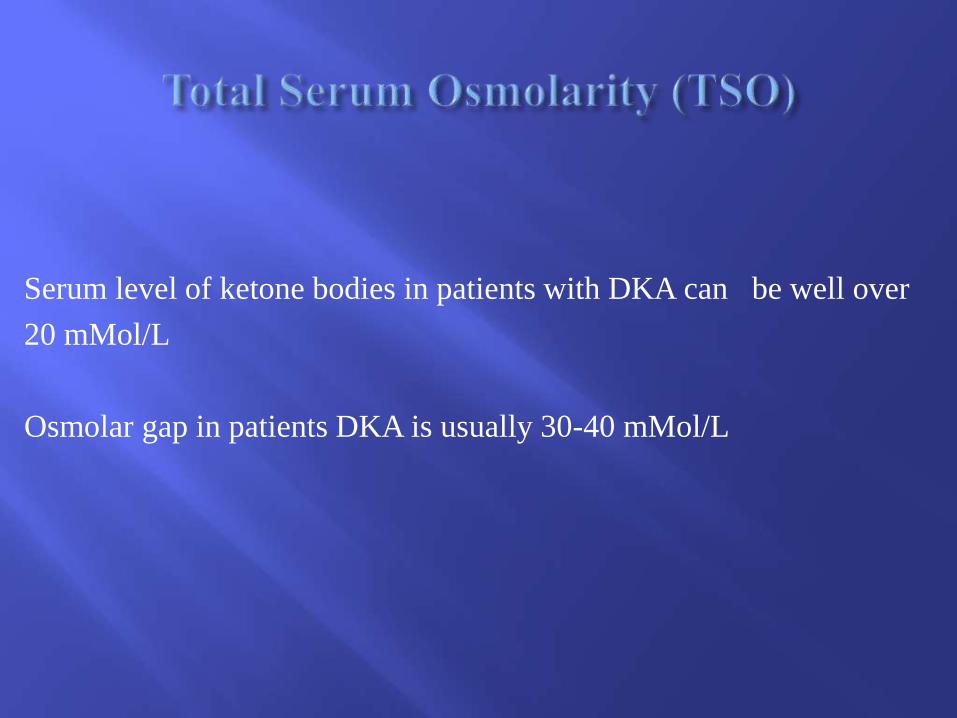
Serum level of ketone bodies in patients with DKA can be well over
20 mMol/L
Osmolar gap in patients DKA is usually 30-40 mMol/L
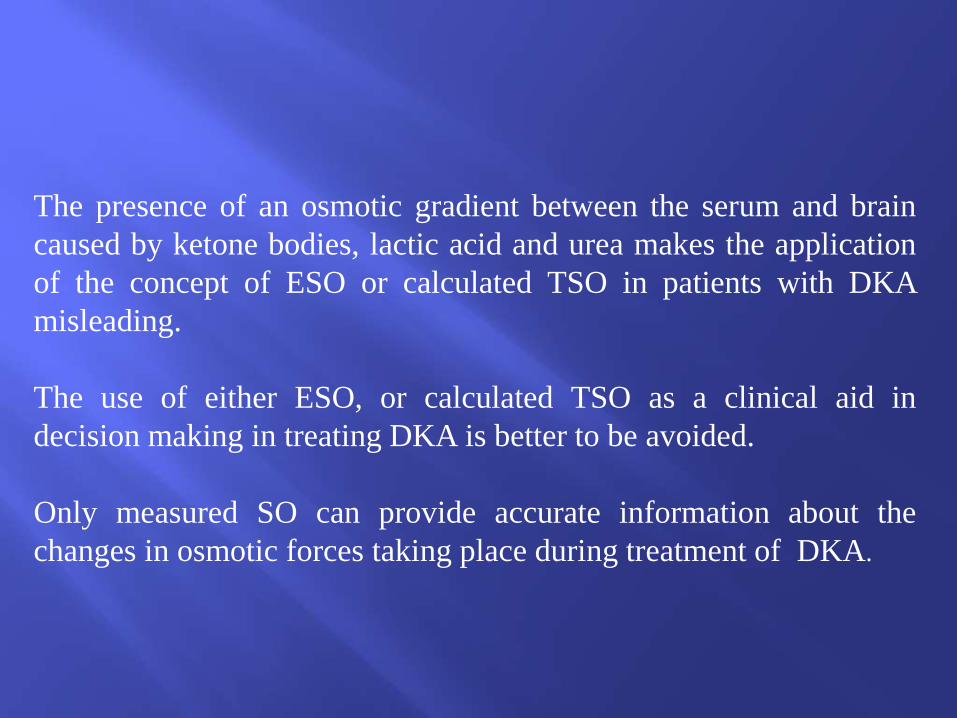
The presence of an osmotic gradient between the serum and brain
caused by ketone bodies, lactic acid and urea makes the application
of the concept of ESO or calculated TSO in patients with DKA
misleading.
The use of either ESO, or calculated TSO as a clinical aid in
decision making in treating DKA is better to be avoided.
Only measured SO can provide accurate information about the
changes in osmotic forces taking place during treatment of DKA.
Measured serum sodium in patients with DKA should
be converted to adjusted serum sodium using a
correction factor.
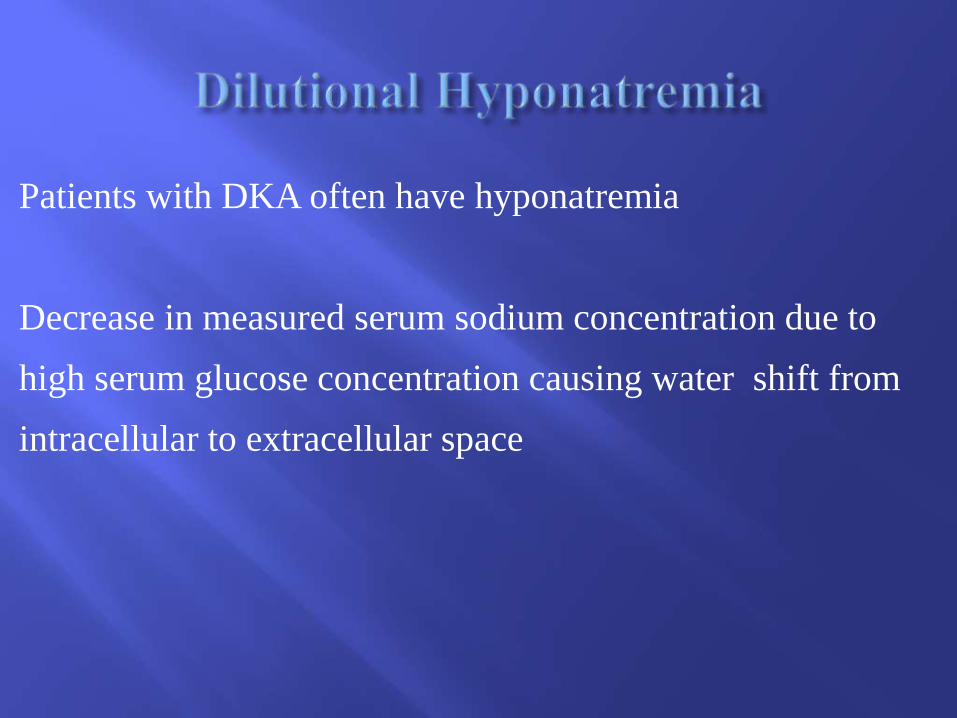
Patients with DKA often have hyponatremia
Decrease in measured serum sodium concentration due to
high serum glucose concentration causing water shift from
intracellular to extracellular space
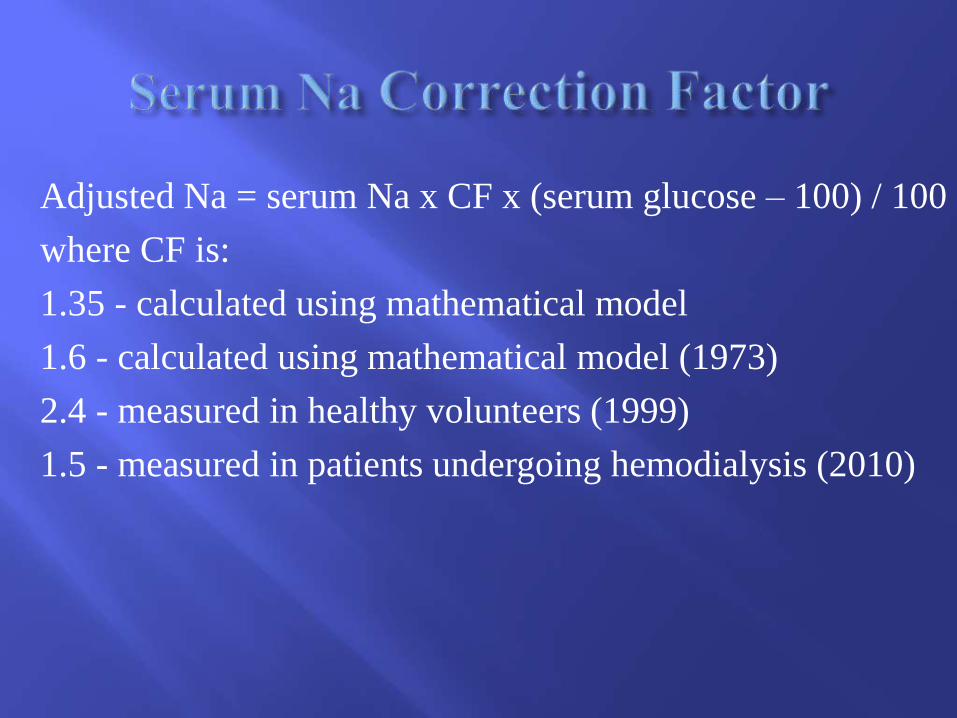
Adjusted Na = serum Na x CF x (serum glucose – 100) / 100
where CF is:
1.35 - calculated using mathematical model
1.6 - calculated using mathematical model (1973)
2.4 - measured in healthy volunteers (1999)
1.5 - measured in patients undergoing hemodialysis (2010)
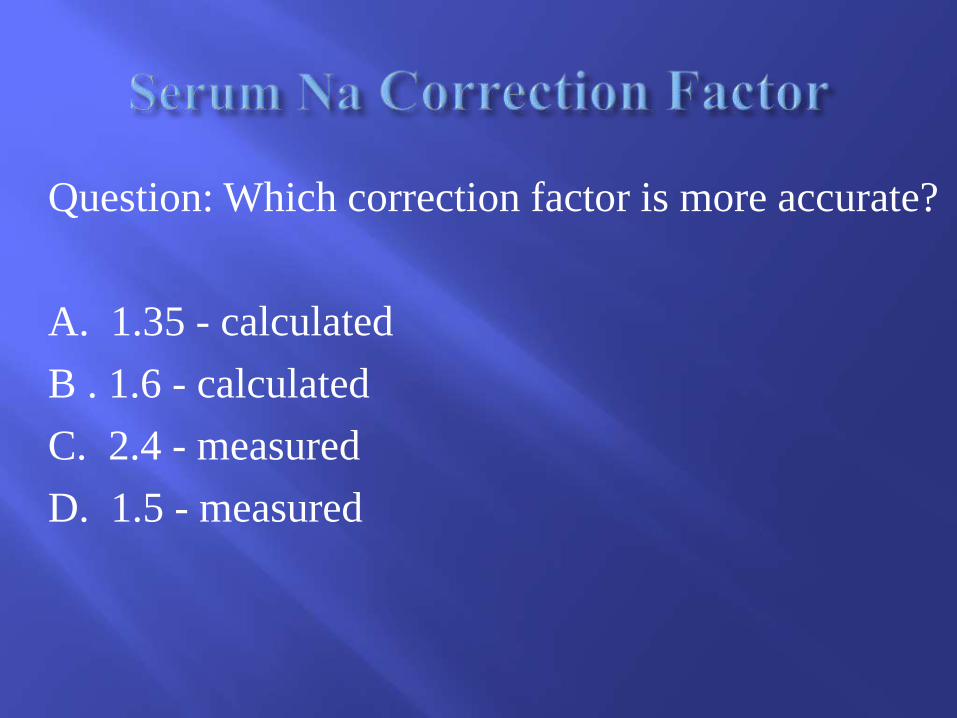
Question: Which correction factor is more accurate?
A. 1.35 - calculated
B . 1.6 - calculated
C. 2.4 - measured
D. 1.5 - measured
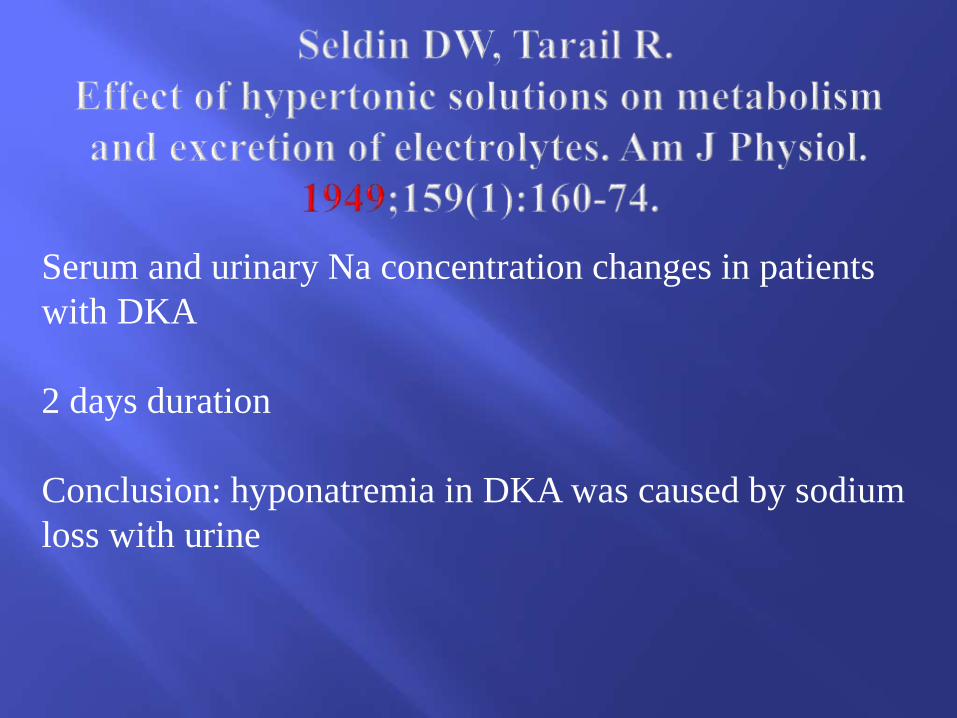
Serum and urinary Na concentration changes in patients
with DKA
2 days duration
Conclusion: hyponatremia in DKA was caused by sodium
loss with urine
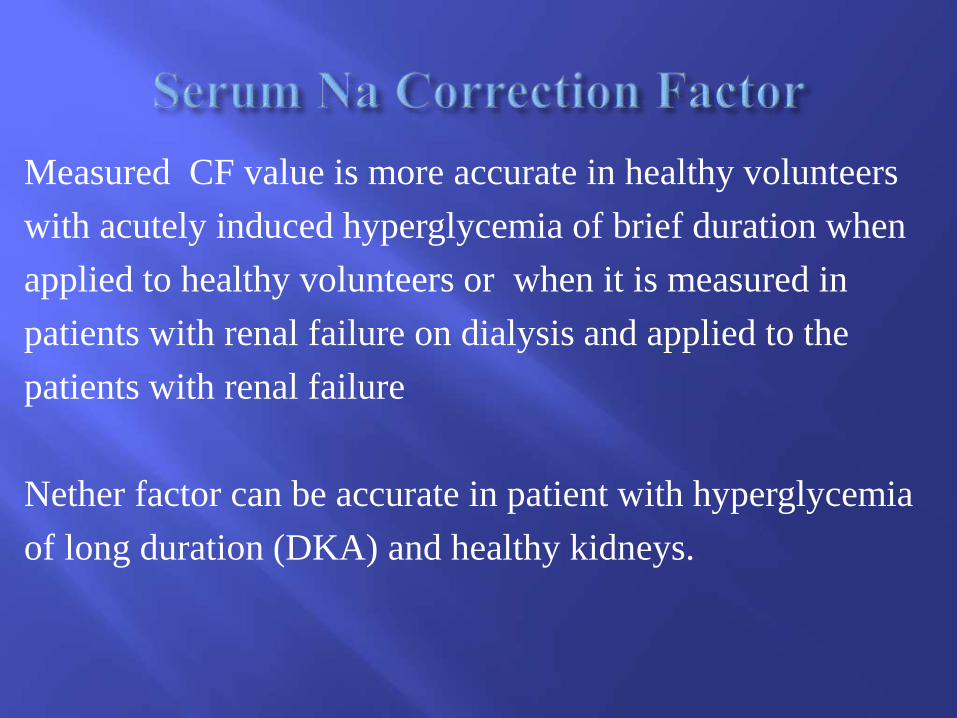
Measured CF value is more accurate in healthy volunteers
with acutely induced hyperglycemia of brief duration when
applied to healthy volunteers or when it is measured in
patients with renal failure on dialysis and applied to the
patients with renal failure
Nether factor can be accurate in patient with hyperglycemia
of long duration (DKA) and healthy kidneys.
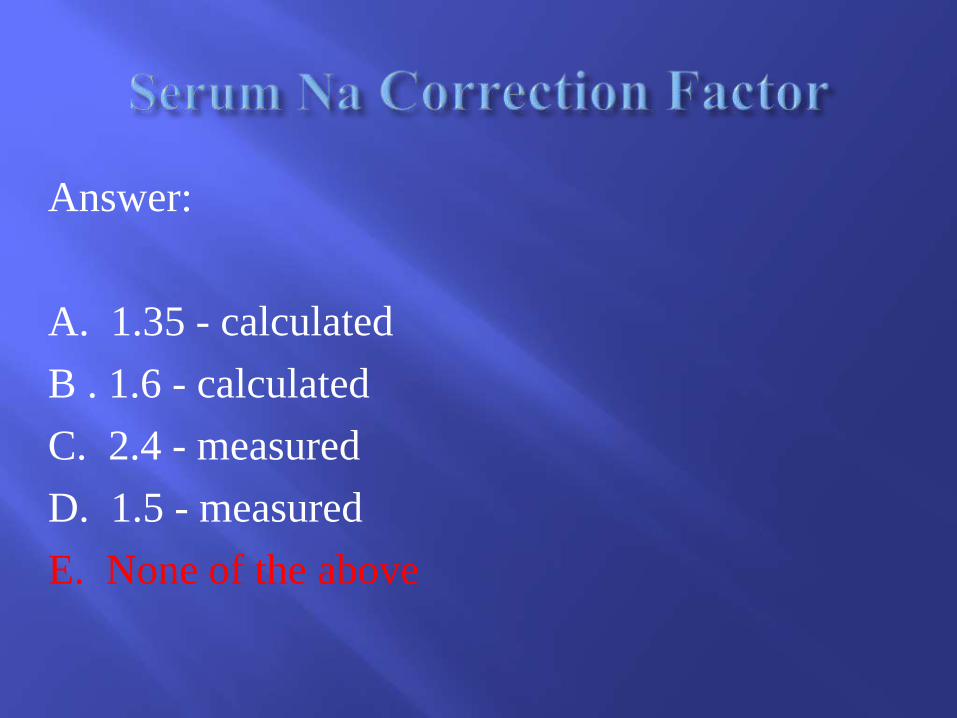
Answer:
A. 1.35 - calculated
B . 1.6 - calculated
C. 2.4 - measured
D. 1.5 - measured
E. None of the above
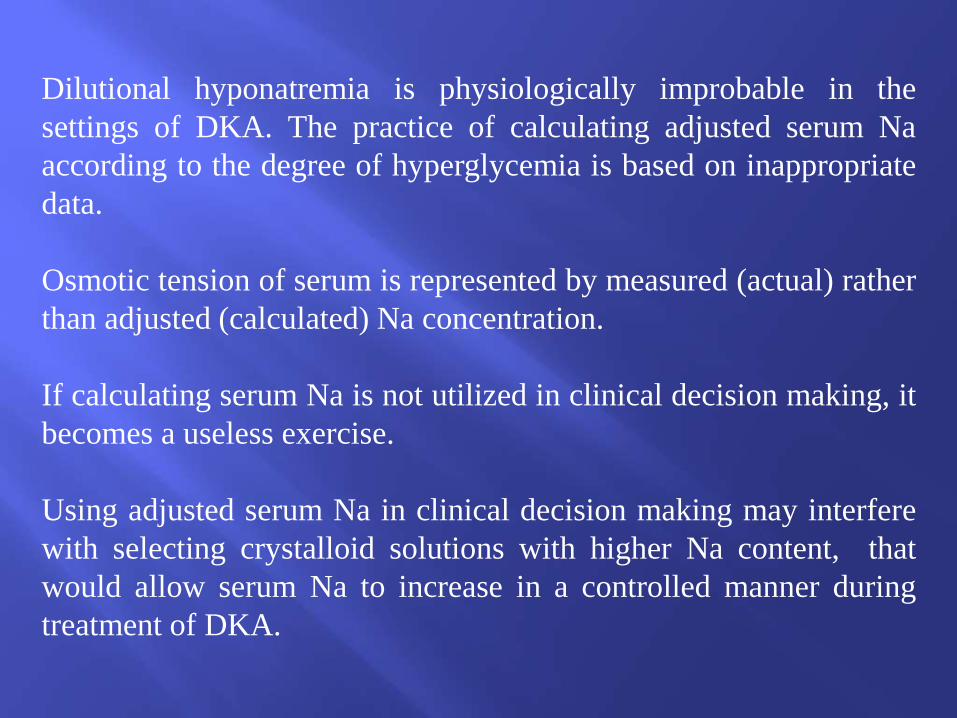
Dilutional hyponatremia is physiologically improbable in the
settings of DKA. The practice of calculating adjusted serum Na
according to the degree of hyperglycemia is based on inappropriate
data.
Osmotic tension of serum is represented by measured (actual) rather
than adjusted (calculated) Na concentration.
If calculating serum Na is not utilized in clinical decision making, it
becomes a useless exercise.
Using adjusted serum Na in clinical decision making may interfere
with selecting crystalloid solutions with higher Na content, that
would allow serum Na to increase in a controlled manner during
treatment of DKA.
Do not correct hyponatremia if the serum sodium
value adjusted for the degree of hyperglycemia is
within normal range
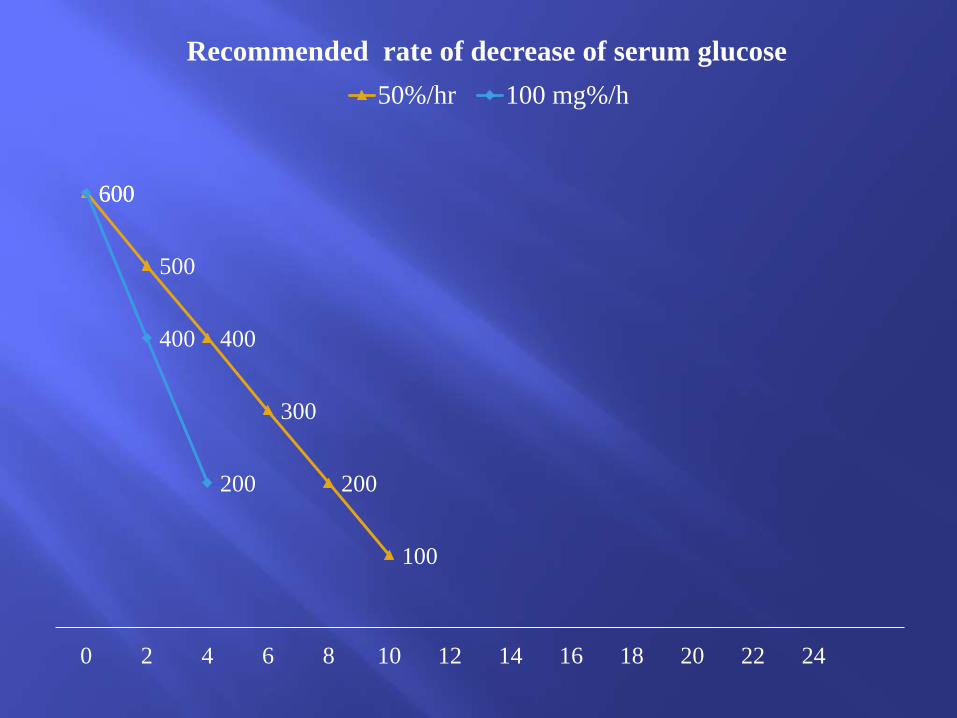
Allow serum glucose to decrease by
50 to 100 mg/%
600
500
400
300
200
100
600
400
200
0 2 4 6 8 10 12 14 16 18 20 22 24
Recommended rate of decrease of serum glucose
50%/hr 100 mg%/h
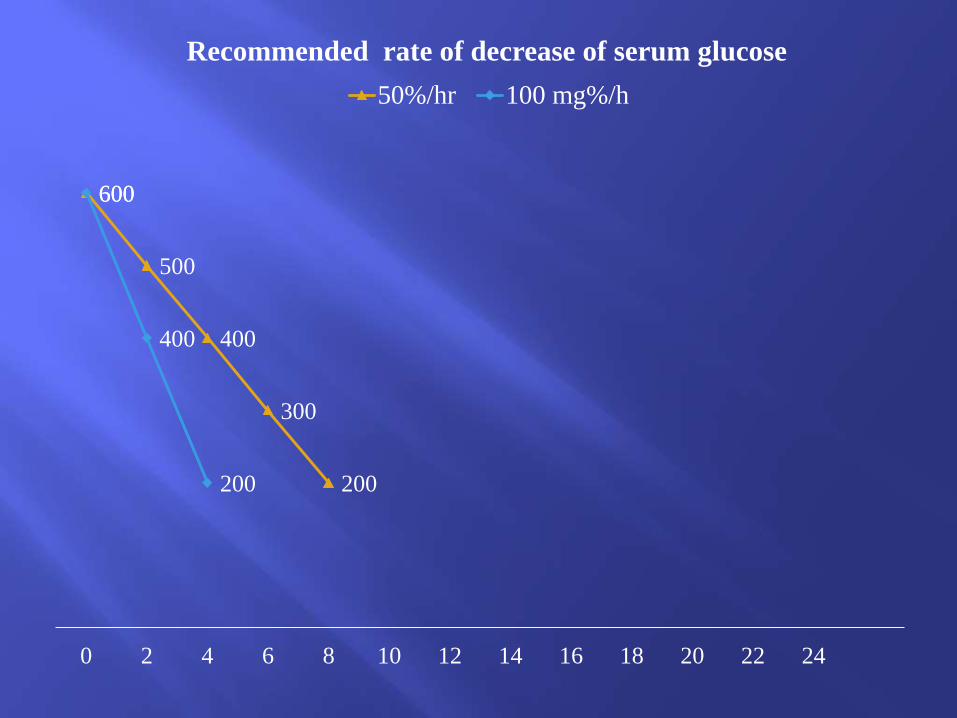
600
500
400
300
200
600
400
200
0 2 4 6 8 10 12 14 16 18 20 22 24
Recommended rate of decrease of serum glucose
50%/hr 100 mg%/h

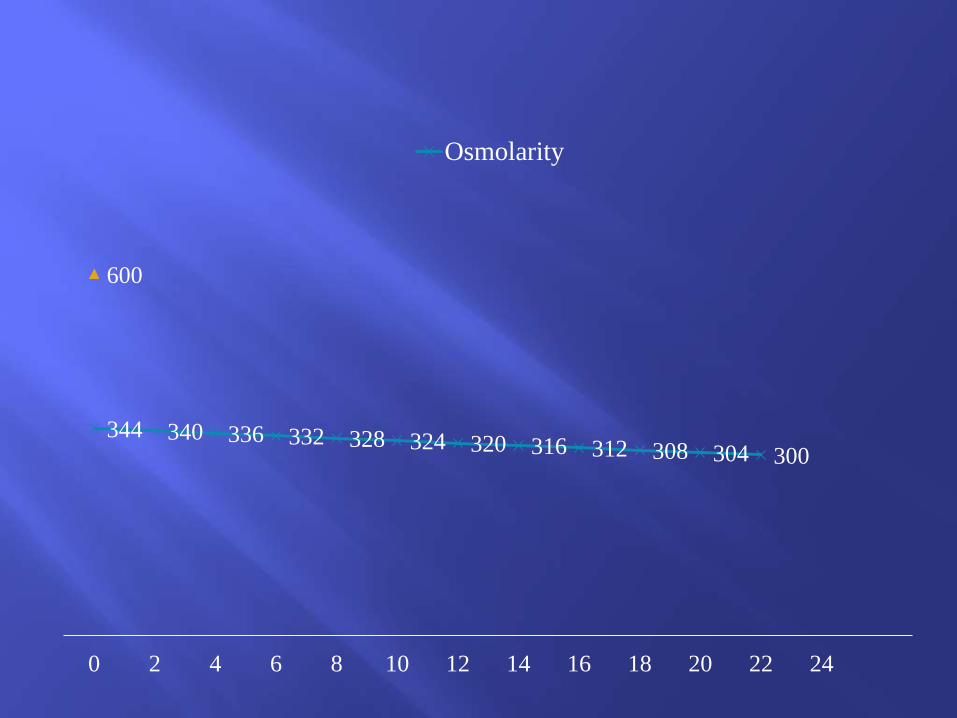
600
344 340 336 332 328 324 320 316 312 308 304 300
0 2 4 6 8 10 12 14 16 18 20 22 24
Osmolarity
50 mg% of glucose = 2.7 mOsm
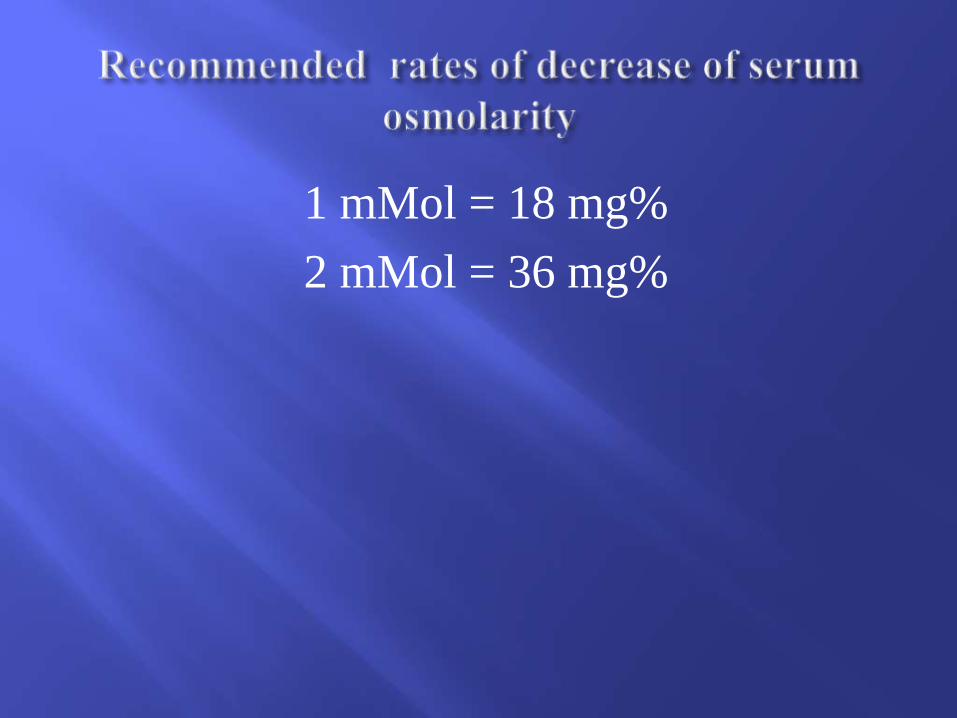
1 mMol = 18 mg%
2 mMol = 36 mg%
600
500
400
300
200
100
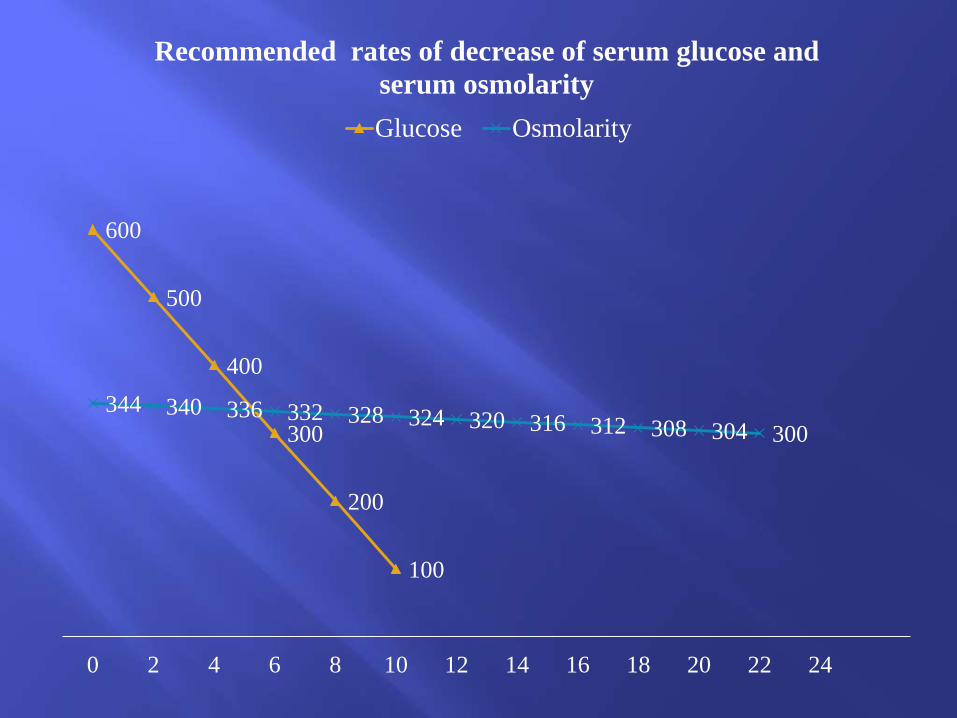
344 340 336 332 328 324 320 316 312 308 304 300
0 2 4 6 8 10 12 14 16 18 20 22 24
Recommended rates of decrease of serum glucose and
serum osmolarity
Glucose Osmolarity
600
500
400
300
200
100
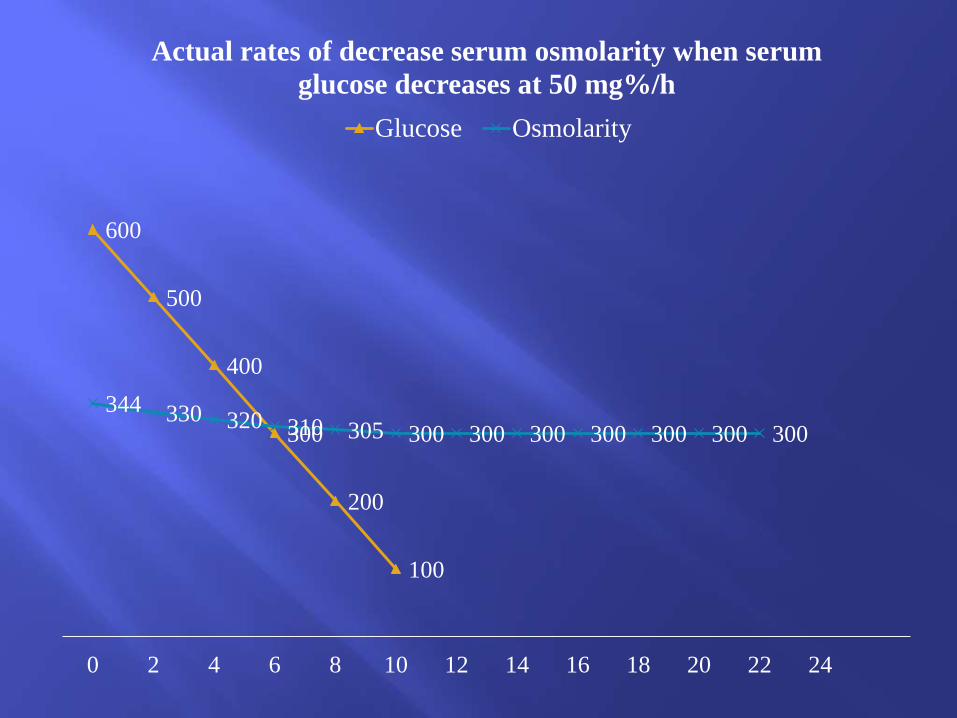
344 330 320 310 305 300 300 300 300 300 300 300
0 2 4 6 8 10 12 14 16 18 20 22 24
Actual rates of decrease serum osmolarity when serum
glucose decreases at 50 mg%/h
Glucose Osmolarity
600
555
510470
425
380
335
290
245
200
155
100
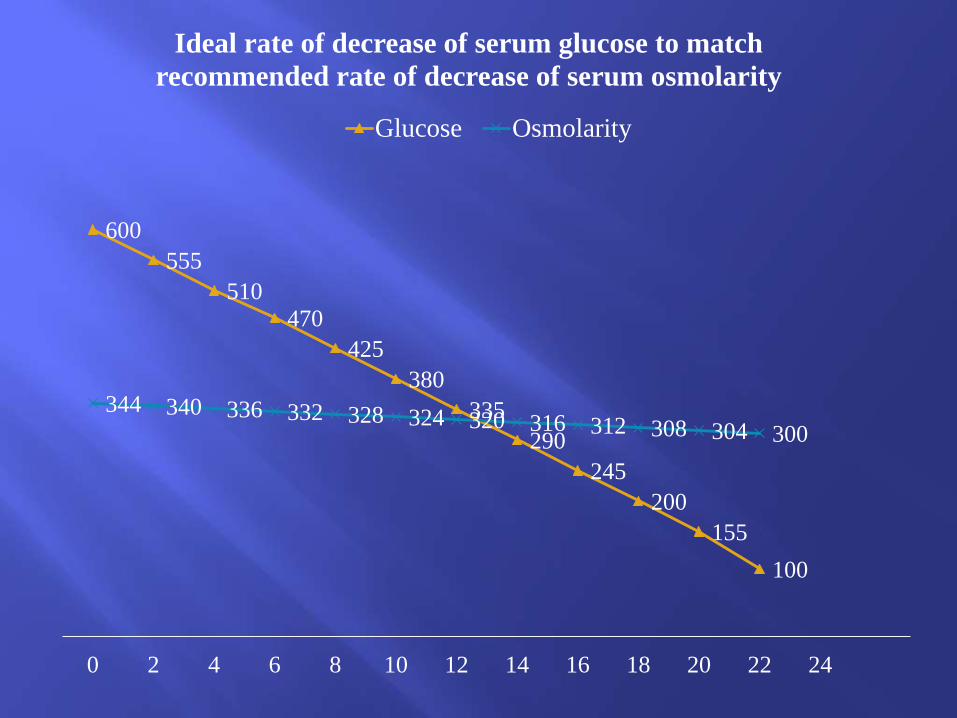
344 340 336 332 328 324 320 316 312 308 304 300
0 2 4 6 8 10 12 14 16 18 20 22 24
Ideal rate of decrease of serum glucose to match
recommended rate of decrease of serum osmolarity
Glucose Osmolarity
600
500
400
300
200
100 100 100 100 100 100 100
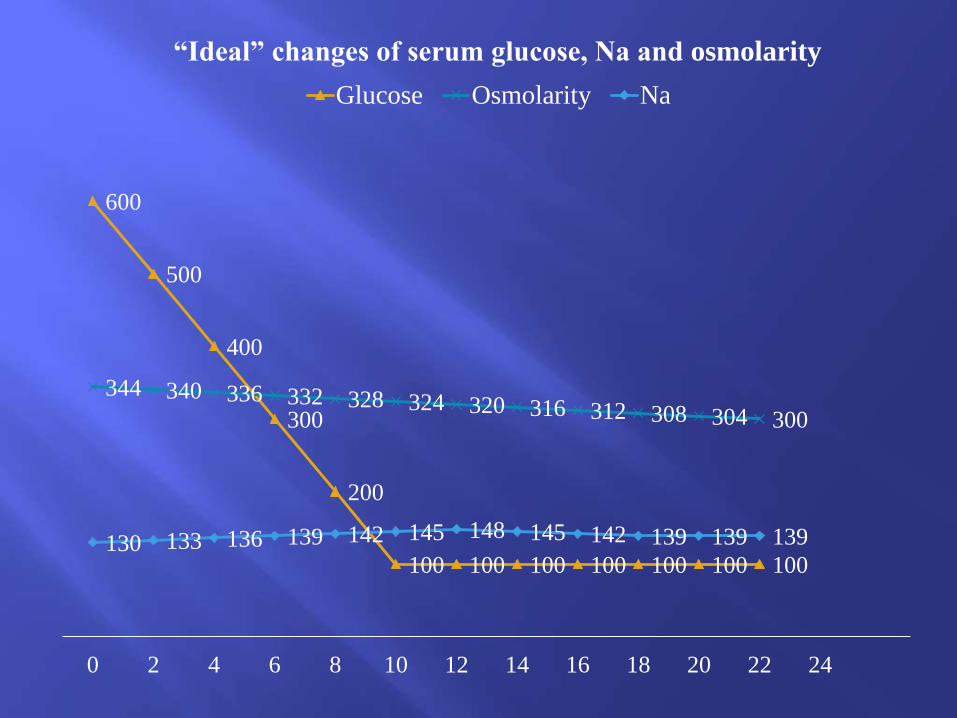
344 340 336 332 328 324 320 316 312 308 304 300
130 133 136 139 142 145 148 145 142 139 139 139
0 2 4 6 8 10 12 14 16 18 20 22 24
“Ideal” changes of serum glucose, Na and osmolarity
Glucose Osmolarity Na
Insulin should be administered at a low dose of
0.1U/kg/h.
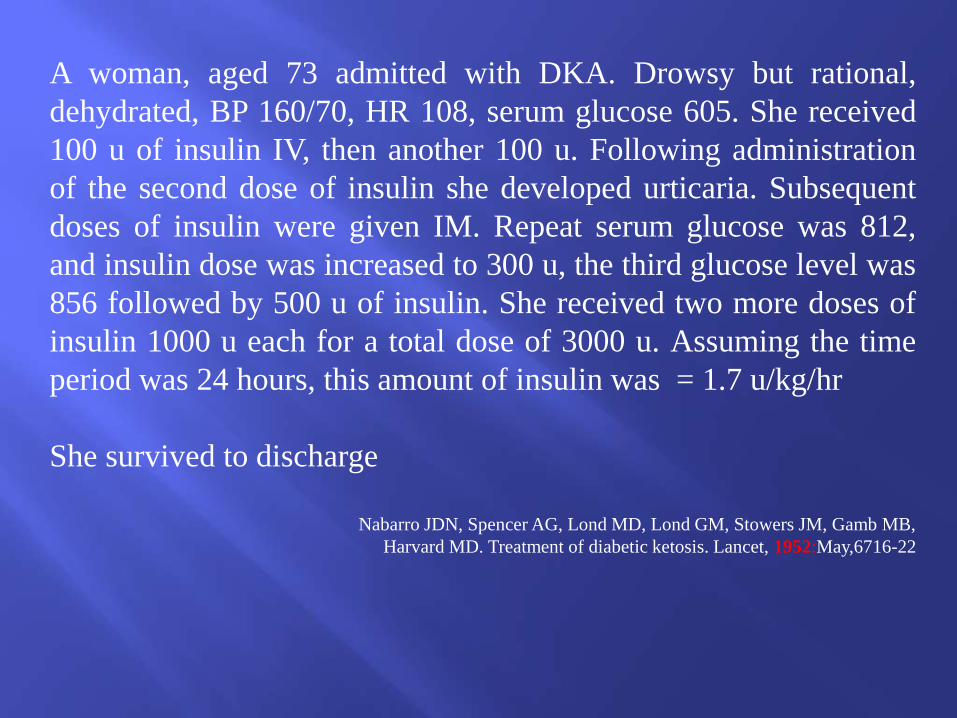
A woman, aged 73 admitted with DKA. Drowsy but rational,
dehydrated, BP 160/70, HR 108, serum glucose 605. She received
100 u of insulin IV, then another 100 u. Following administration
of the second dose of insulin she developed urticaria. Subsequent
doses of insulin were given IM. Repeat serum glucose was 812,
and insulin dose was increased to 300 u, the third glucose level was
856 followed by 500 u of insulin. She received two more doses of
insulin 1000 u each for a total dose of 3000 u. Assuming the time
period was 24 hours, this amount of insulin was = 1.7 u/kg/hr
She survived to discharge
Nabarro JDN, Spencer AG, Lond MD, Lond GM, Stowers JM, Gamb MB,
Harvard MD. Treatment of diabetic ketosis. Lancet, 1952:May,6716-22
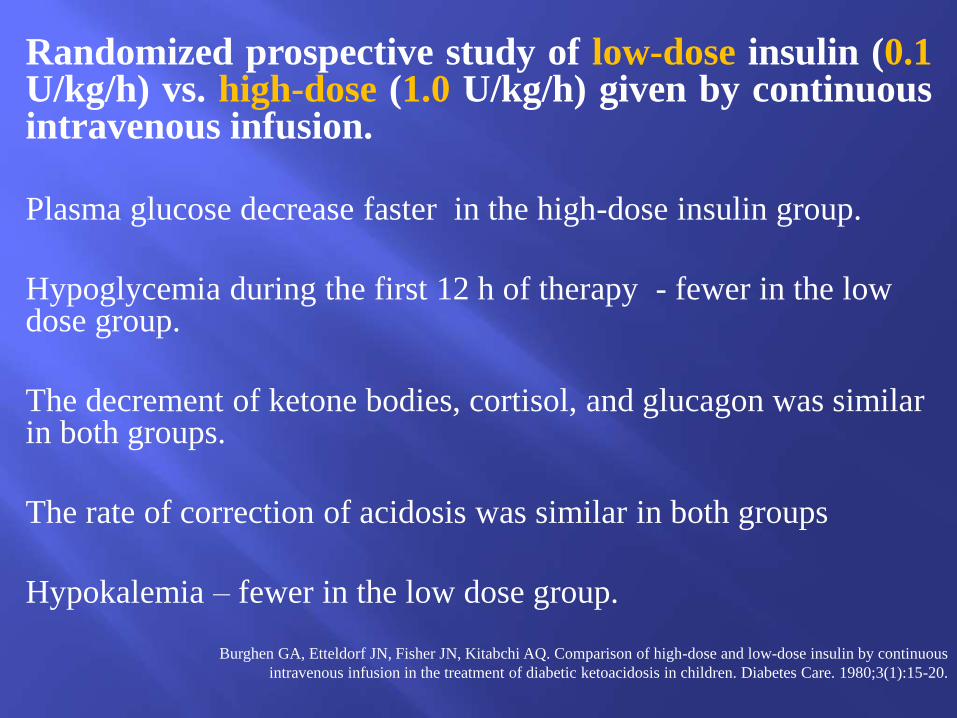
Randomized prospective study of low-dose insulin (0.1U/kg/h) vs. high-dose (1.0 U/kg/h) given by continuousintravenous infusion.
Plasma glucose decrease faster in the high-dose insulin group.
Hypoglycemia during the first 12 h of therapy - fewer in the low dose group.
The decrement of ketone bodies, cortisol, and glucagon was similar in both groups.
The rate of correction of acidosis was similar in both groups
Hypokalemia – fewer in the low dose group.
Burghen GA, Etteldorf JN, Fisher JN, Kitabchi AQ. Comparison of high-dose and low-dose insulin by continuous
intravenous infusion in the treatment of diabetic ketoacidosis in children. Diabetes Care. 1980;3(1):15-20.
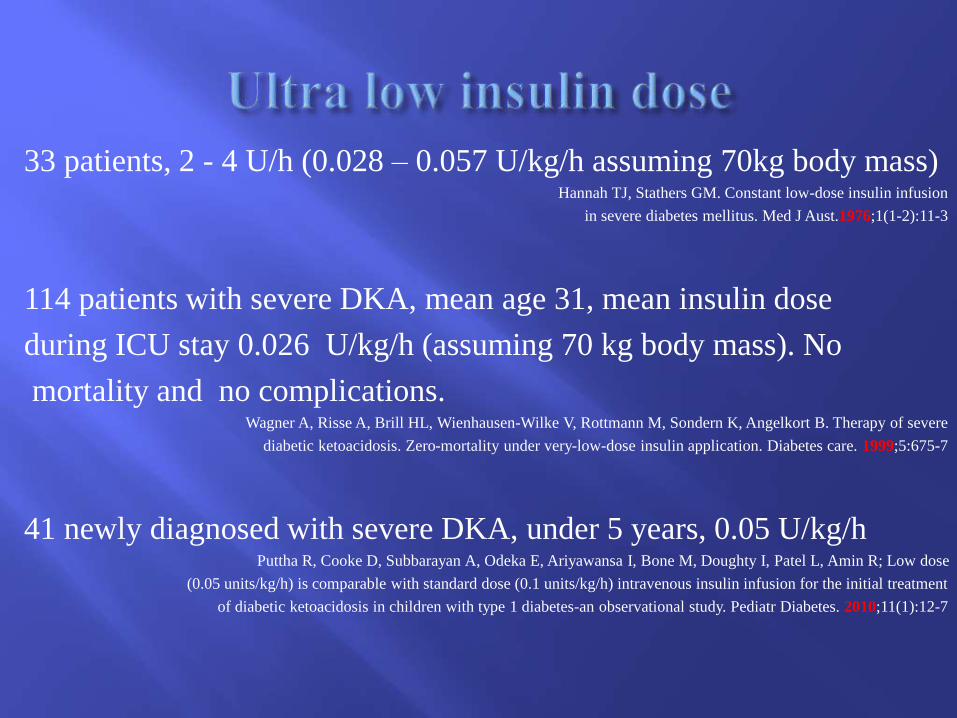
33 patients, 2 - 4 U/h (0.028 – 0.057 U/kg/h assuming 70kg body mass)Hannah TJ, Stathers GM. Constant low-dose insulin infusion
in severe diabetes mellitus. Med J Aust.1976;1(1-2):11-3
114 patients with severe DKA, mean age 31, mean insulin dose
during ICU stay 0.026 U/kg/h (assuming 70 kg body mass). No
mortality and no complications.Wagner A, Risse A, Brill HL, Wienhausen-Wilke V, Rottmann M, Sondern K, Angelkort B. Therapy of severe
diabetic ketoacidosis. Zero-mortality under very-low-dose insulin application. Diabetes care. 1999;5:675-7
41 newly diagnosed with severe DKA, under 5 years, 0.05 U/kg/h Puttha R, Cooke D, Subbarayan A, Odeka E, Ariyawansa I, Bone M, Doughty I, Patel L, Amin R; Low dose
(0.05 units/kg/h) is comparable with standard dose (0.1 units/kg/h) intravenous insulin infusion for the initial treatment
of diabetic ketoacidosis in children with type 1 diabetes-an observational study. Pediatr Diabetes. 2010;11(1):12-7
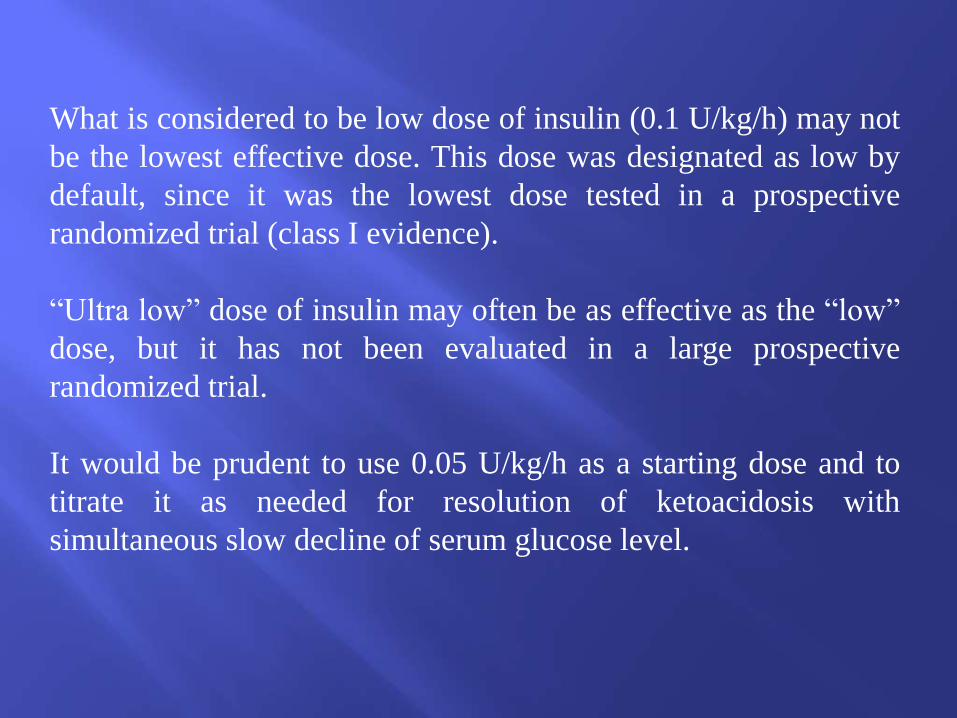
What is considered to be low dose of insulin (0.1 U/kg/h) may not
be the lowest effective dose. This dose was designated as low by
default, since it was the lowest dose tested in a prospective
randomized trial (class I evidence).
“Ultra low” dose of insulin may often be as effective as the “low”
dose, but it has not been evaluated in a large prospective
randomized trial.
It would be prudent to use 0.05 U/kg/h as a starting dose and to
titrate it as needed for resolution of ketoacidosis with
simultaneous slow decline of serum glucose level.
Add 5% to 10% dextrose when the serum glucose
concentration falls to approximately 250 mg%
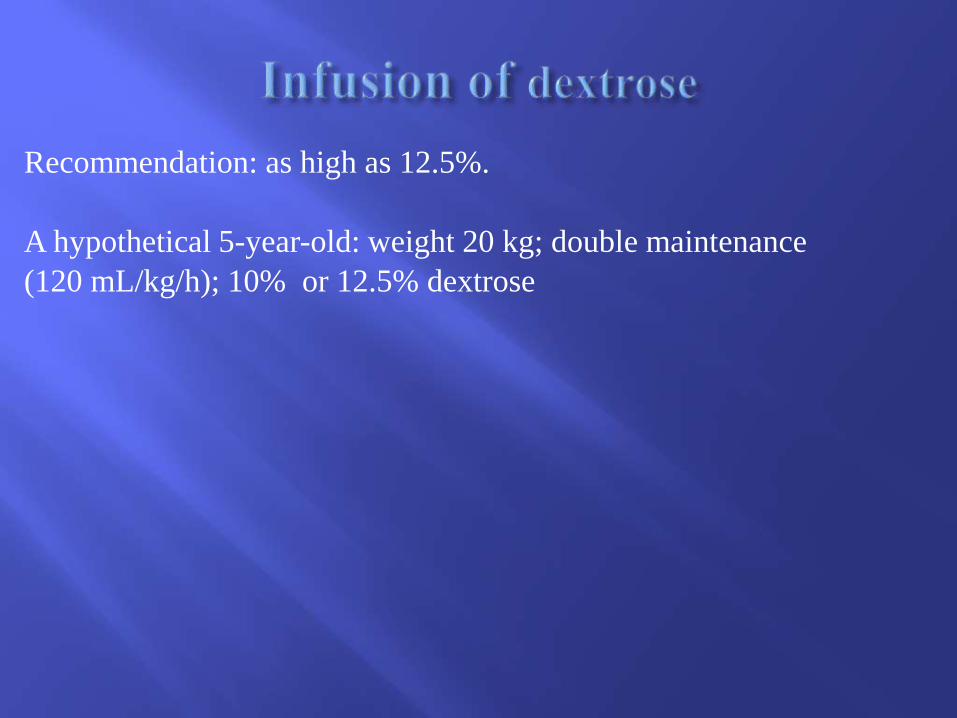
Recommendation: as high as 12.5%.
Recommendation: as high as 12.5%.
A hypothetical 5-year-old: weight 20 kg; double maintenance
(120 mL/kg/h); 10% or 12.5% dextrose
Recommendation: as high as 12.5%.
A hypothetical 5-year-old: weight 20 kg; double maintenance
(120 mL/kg/h); 10% or 12.5% dextrose
Sugar load with 12.5% projected over 24 h: 360 g (1440 kcal)
Sugar load with 10% projected over 24 h: 290 g (1160 kcal)
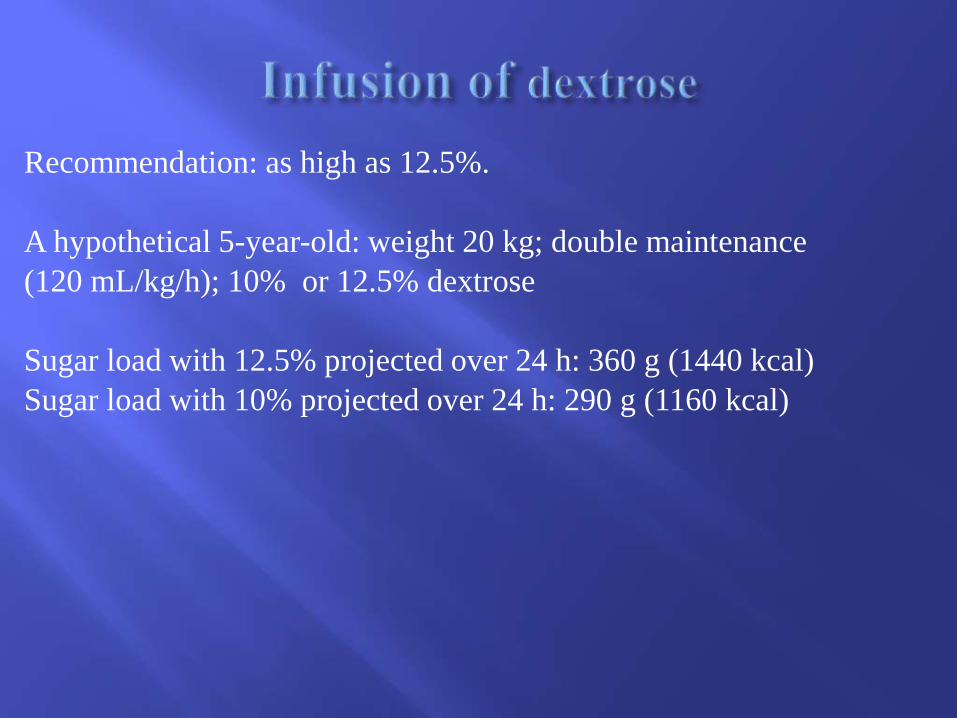
Recommendation: as high as 12.5%.
A hypothetical 5-year-old: weight 20 kg; double maintenance
(120 mL/kg/h); 10% or 12.5% dextrose
Sugar load with 12.5% projected over 24 h: 360 g (1440 kcal)
Sugar load with 10% projected over 24 h: 290 g (1160 kcal)
Energy requirement at the age of 5 is about 1600 kcal/24 h
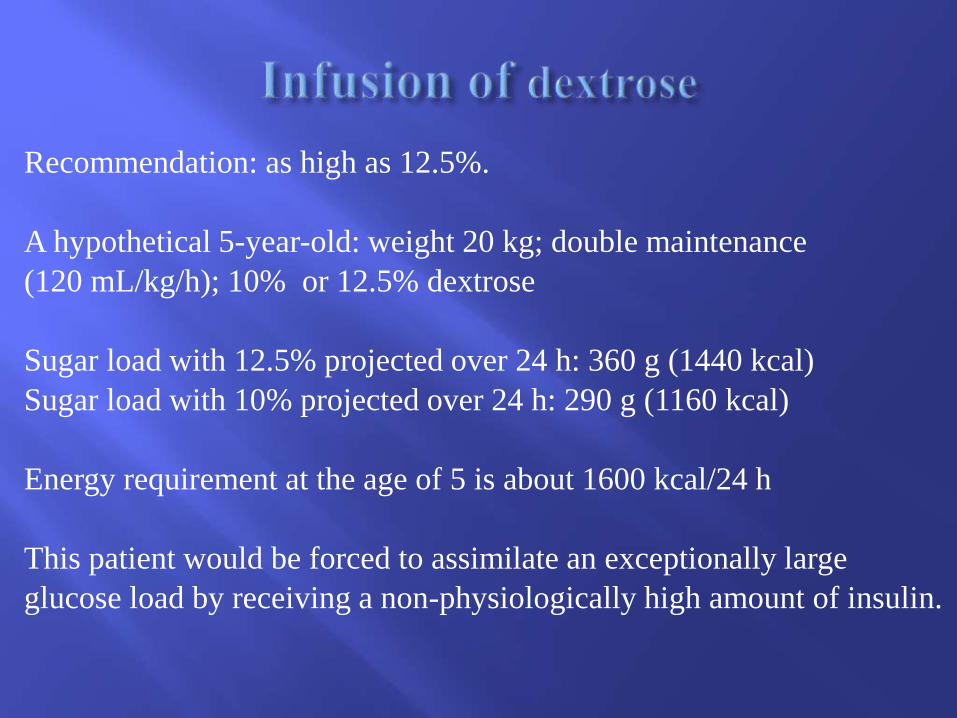
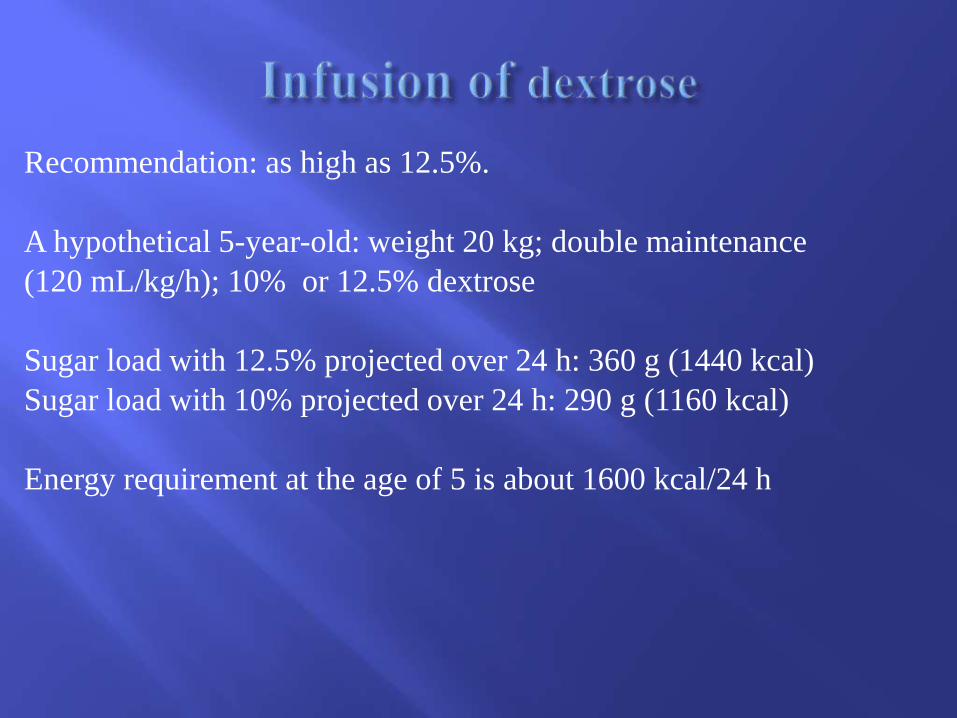
This patient would be forced to assimilate an exceptionally large
glucose load by receiving a non-physiologically high amount of insulin.
Edema is multifactorial

Edema is multifactorial
Mythology based therapy contribution to osmotic CE may
include:
Use of relatively hypotonic fluids
Edema is multifactorial
Mythology based therapy contribution to osmotic CE may
include:
Use of relatively hypotonic fluids
Use of excessive amount of fluids
Edema is multifactorial
Mythology based therapy contribution to osmotic CE may
include:
Use of relatively hypotonic fluids
Use of excessive amount of fluids
Use of excessive amount of insulin