Embed Size (px)
Citation preview

Does Public Transit Promote Physical Activity?
An Analysis of a 2015 Study
Shauna Ayres, Ashley Crawford, Camille McGirt, Sarah Shaughnessy and Anne Schmidt
Public Health Problem
A Push for Physical Activity
Adequate levels of physical activity (PA) can reduce the risk of obesity, diabetes, and heart disease
A Push for Public Transit
More efficient mode of transport
Reduces environmental pollution

Previous Research
Cross-sectional studies have shown an association between healthy PA levels
and use of public transit 1 2 but there are limitations
• Confounders: neighborhood context, ridership characteristics
Are people who use public transit already more active?
• Substitution effect
Does public transit generate new PA?
1. Brown, et al (2015) 2. Saelens, et al (2014)

New AssessmentPublic transit generates new physical activity: Evidence from
individual GPS and accelerometer data before and after light rail
construction in a neighborhood of Salt Lake City, Utah, USA.
Harvey J. Miller a,b,n, Calvin P. Tribby a,b, Barbara B. Brown c, Ken R. Smith c,d, Carol M.
Werner e, Jean Wolf f, Laura Wilson f, Marcelo G. Simas Oliveira f
Longitudinal study: n=536
Three forms of analysis:1. Within-person differences of PA before and after
construction of the light rail
2. Spatial clustering of PA around transit stops
3. Comparison of time spent on PA on days when
participants used LRT and days when they did not

Conceptual Model and Hypotheses
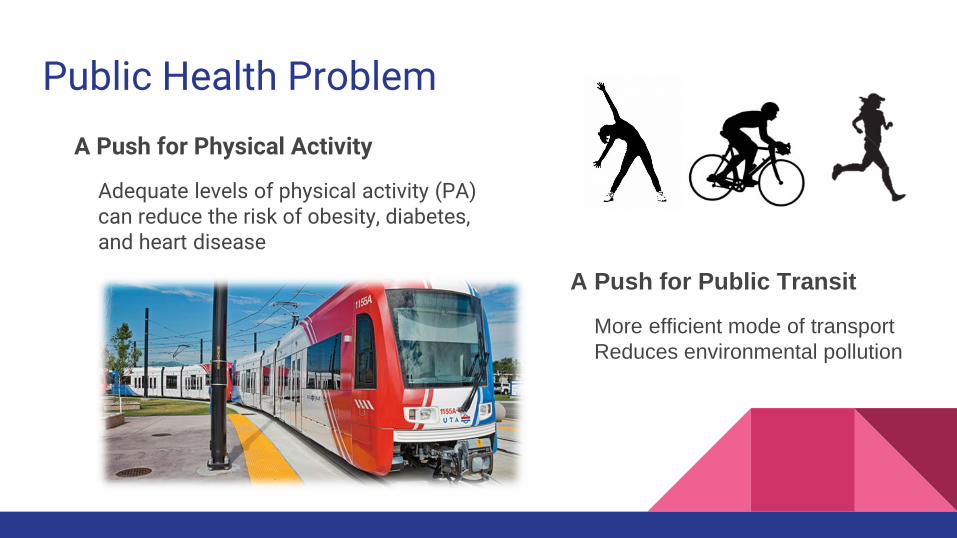
Sampling and Representativeness
TARGET POPULATION
Salt Lake City Residents
SAMPLING FRAME
Residents within 2km of LRT line
SAMPLE
536 residents
Coverage Error
Non-probability
sampling

Construct Validity of IV (manipulated)
Novelty Effects:
Riding the new LRT is initially appealing, but this appeal
fades over time.
Reactivity to the Experimental Situation:
Participants may be more active because they know the
researchers are studying PA

Construct Validity of DV
Face Validity:• GPS with accelerometers can measure movements• Can determine duration and intensity
Content Validity:• Doesn’t measure all types of PA• Doesn’t measure in all environments• May measure non-PA as PA• Missing Heart Rate data
Criterion-Related Validity:• Gold standard=
Doubly Labeled Water (DLW) device(Andre, 2007)

Study DesignPre-experimental:
one group pretest-posttest design
O1 X O2
Miller et al. claim that public transit generates new physical activity

Internal Validity
Findings:
• Association: the IV and DV both vary
• Temporality: the IV occurs before the DV
• Nonspuriousness: cannot be established
Analysis:
• Main threat: maturation
• Other threats:
history & testing
• Not threats: selection,
instrumentation,
regression to the mean,
& differential attrition

Statistical Conclusion Validity
Strengths• Reliable measures: accelerometer and GPS recorder (Jarret et al. 2015
and Aaland et al. 2015 & Noury-Dasvaux 2011 & Schipperijin 2014)
• Large sample size:n=536 (good statistical power)
• Paired t-test
Weakness• Attritionlost 403 participants

Generalizability
Who: demographics are not presented
Where: small-medium metropolitan areas
When: currently relevant
How:
IV- type of public transit
DV- type of physical activity

Improving the Study
Recruiting Method:
• “Door to door canvassing”- Too Arduous • Web/digital methods for recruitment
More accurate measures of PA:• Defined PA: Minimum duration of 5 min. with a minimum of 1000 accelerometer counts per minute
PA-Total=PA regardless of relationship with PA PA-Transit=PA within a trip that contains public transportation PA Other=PA that does not occur with a public transit segment
Longer assessment period:
• Possible Interrupted Time Series Design
O1 O2 X O3 O4

Overall Assessment
Study Strengths:• Inclusion of literature • Comparable results • Study participants wore
accelerometers AND GPS recorders• PA time relates to changes in transit
use • Policy implications • Reliables measures and large sample
size
Study Weaknesses:• Attrition n=939 to n=536• Non-probability sampling • Did not complete additional
assessments• Demographics • Possible coverage error• Information recording • Threats to internal & external
validity

USPSTF
II-3: Evidence from multiple time series with or without intervention
Quality
Fair