Embed Size (px)
Citation preview
Kellie Schoolar Reynolds, Pharm.D. Office of Clinical Pharmacology, Division 4
Clinical Pharmacology 2: Clinical Pharmacology
Considerations During Phase 2 and Phase 3 of Drug Development
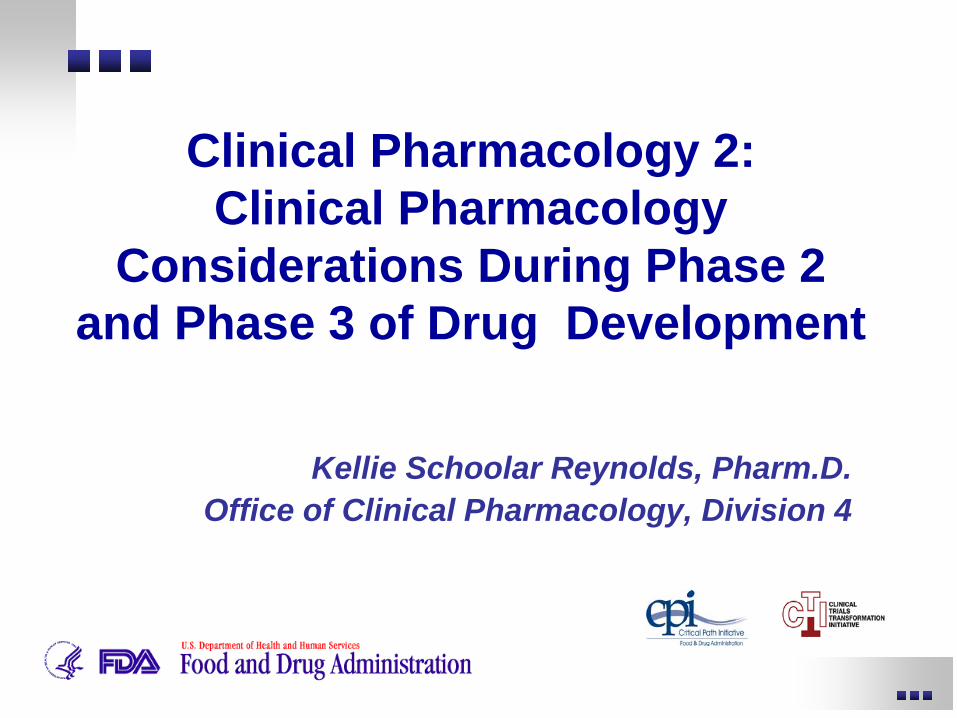
Objectives • Describe information needed to interpret
clinical significance of factors that alter drug exposure
• Discuss the need to evaluate specific populations
• Discuss Phase 2 and Phase 3 drug development decisions that are affected by drug interaction information
• Understand the impact of complete and incomplete clinical pharmacology programs on information available to health care providers
Outline
• The goals of a clinical pharmacology program throughout drug development
• The value of exposure-response information – specific situations when the information is
valuable • Barriers to informative exposure-response
evaluation • Case studies (drug interactions) • Conclusions- relevance and impact
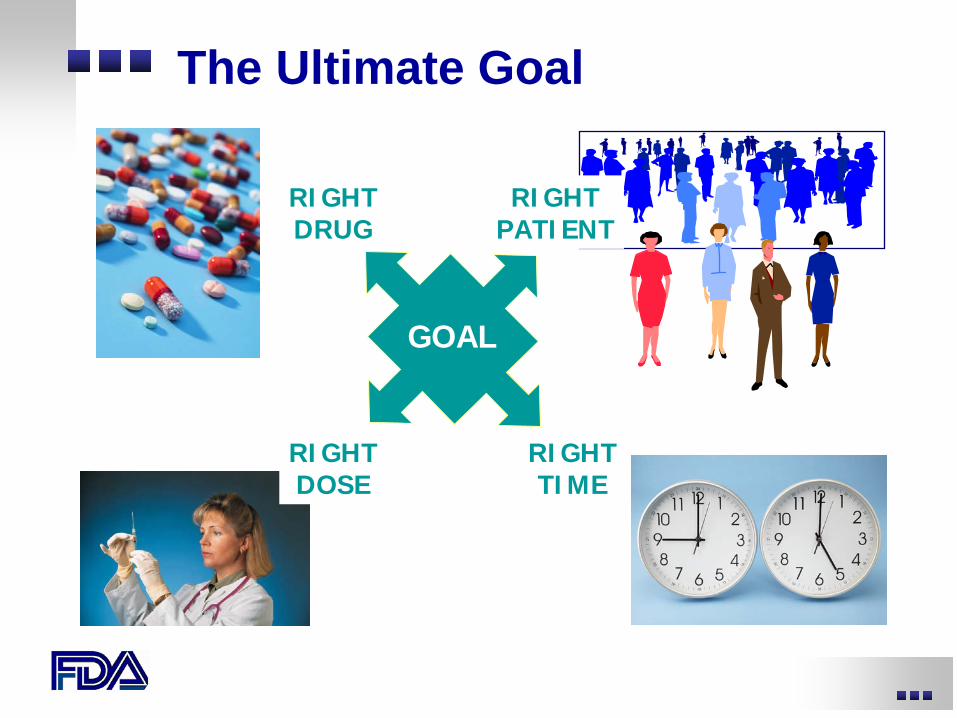
RIGHT DRUG
GOAL
RIGHT DOSE
RIGHT TIME
RIGHT PATIENT
The Ultimate Goal
Phases 2 & 3 of Drug Development Phase 2 studies
– provide preliminary data on the effectiveness of the drug
– allow selection of appropriate dose range for evaluation in Phase 3
Phase 3 studies
– provide pivotal information about effectiveness and safety
– allow evaluation of the overall benefit-risk relationship of the drug
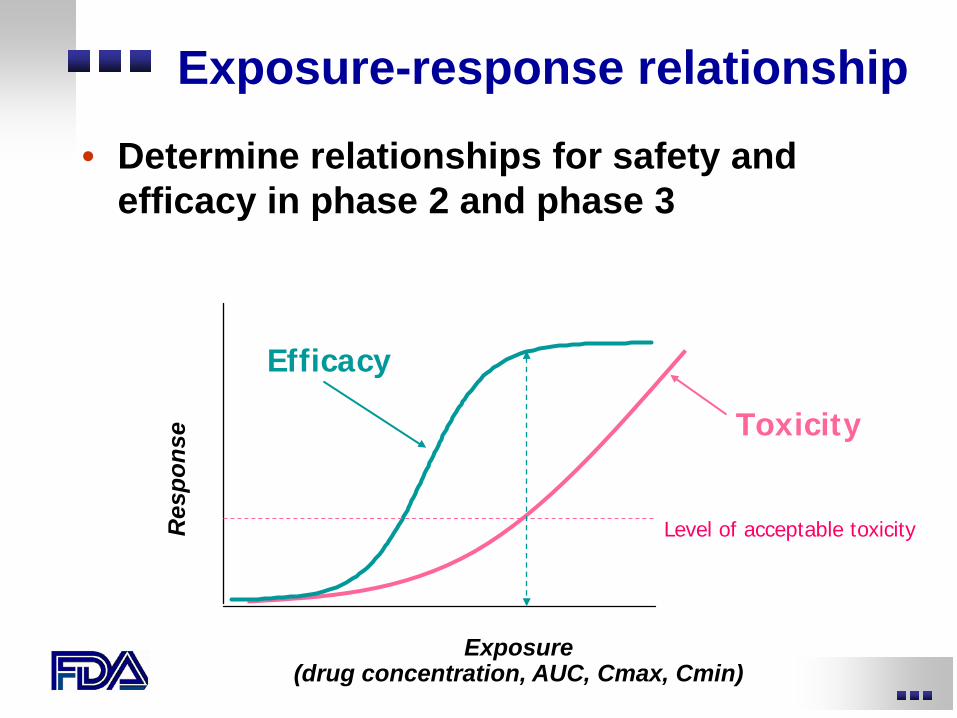
Exposure-response relationship
• Determine relationships for safety and efficacy in phase 2 and phase 3
Exposure (drug concentration, AUC, Cmax, Cmin)
Res
pons
e
Efficacy
Toxicity
Level of acceptable toxicity
The value of exposure-response
information
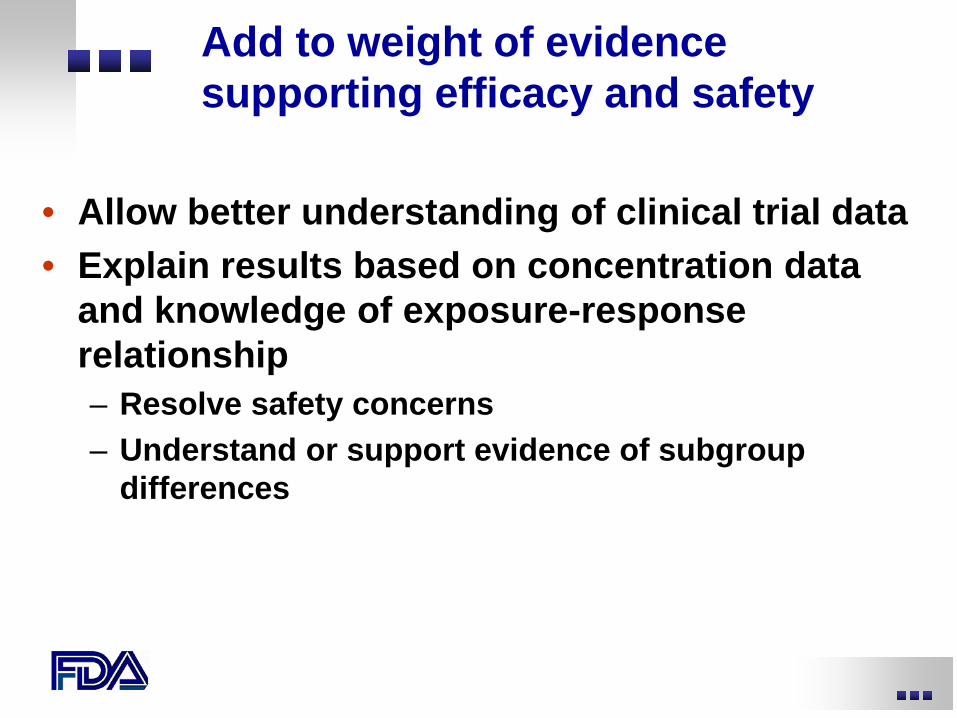
Add to weight of evidence supporting efficacy and safety
• Allow better understanding of clinical trial data • Explain results based on concentration data
and knowledge of exposure-response relationship – Resolve safety concerns – Understand or support evidence of subgroup
differences
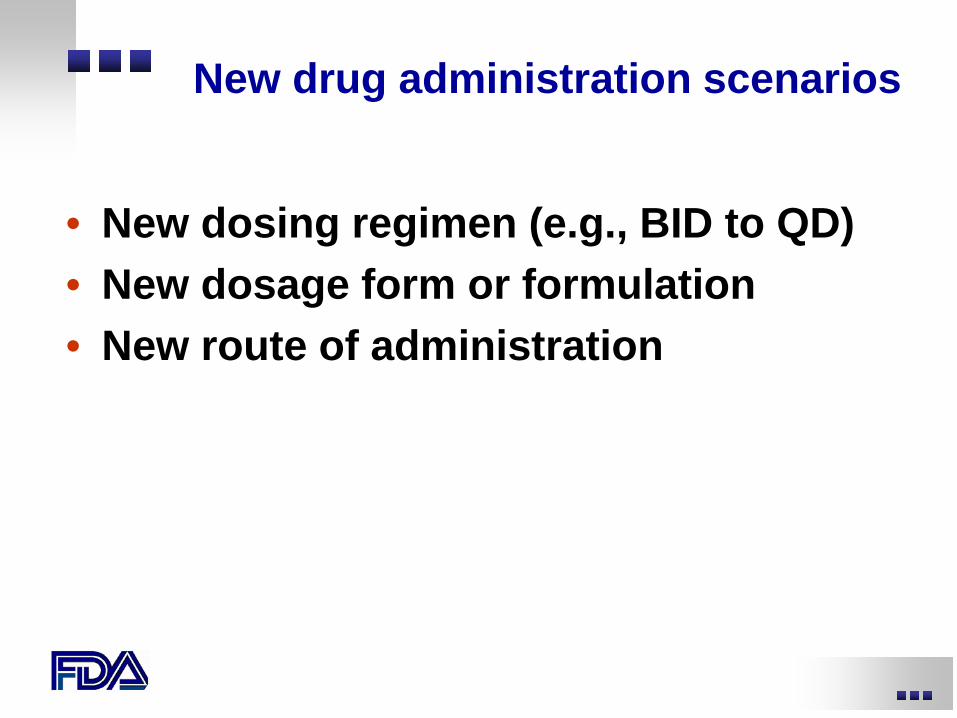
New drug administration scenarios
• New dosing regimen (e.g., BID to QD) • New dosage form or formulation • New route of administration
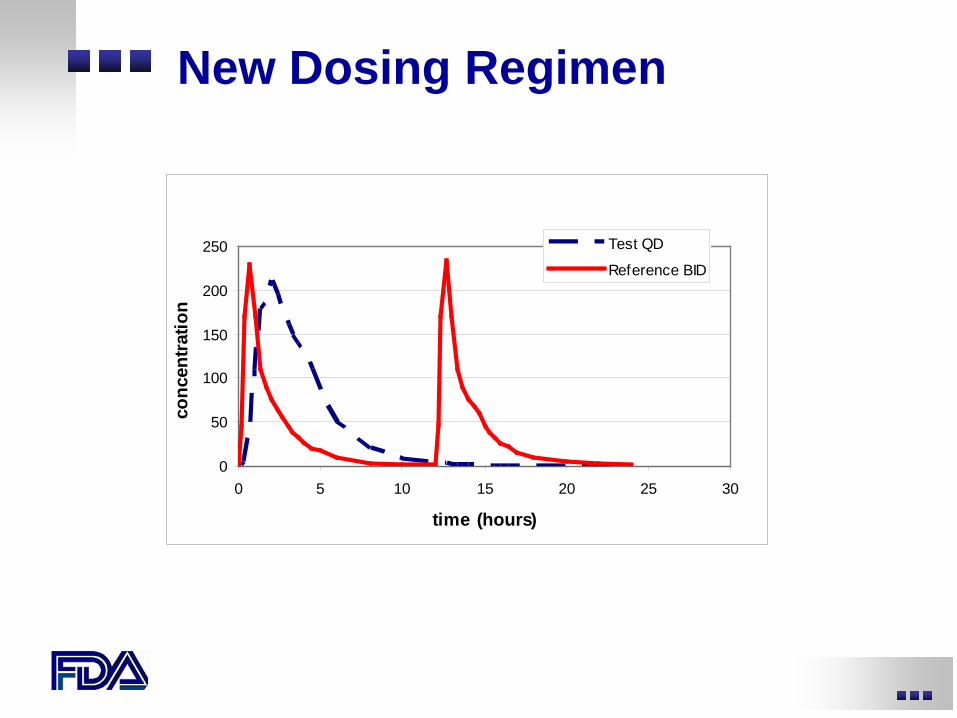
New Dosing Regimen
0
50
100
150
200
250
0 5 10 15 20 25 30
time (hours)
conc
entra
tion
Test QD
Reference BID
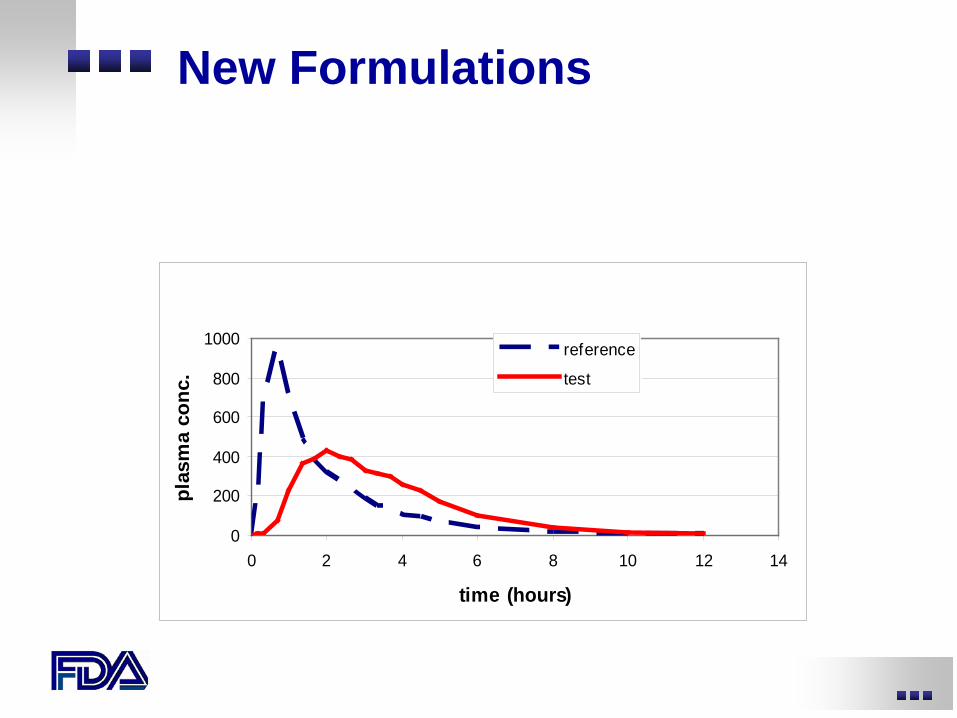
New Formulations
0
200
400
600
800
1000
0 2 4 6 8 10 12 14
time (hours)
plas
ma
conc
.
reference
test
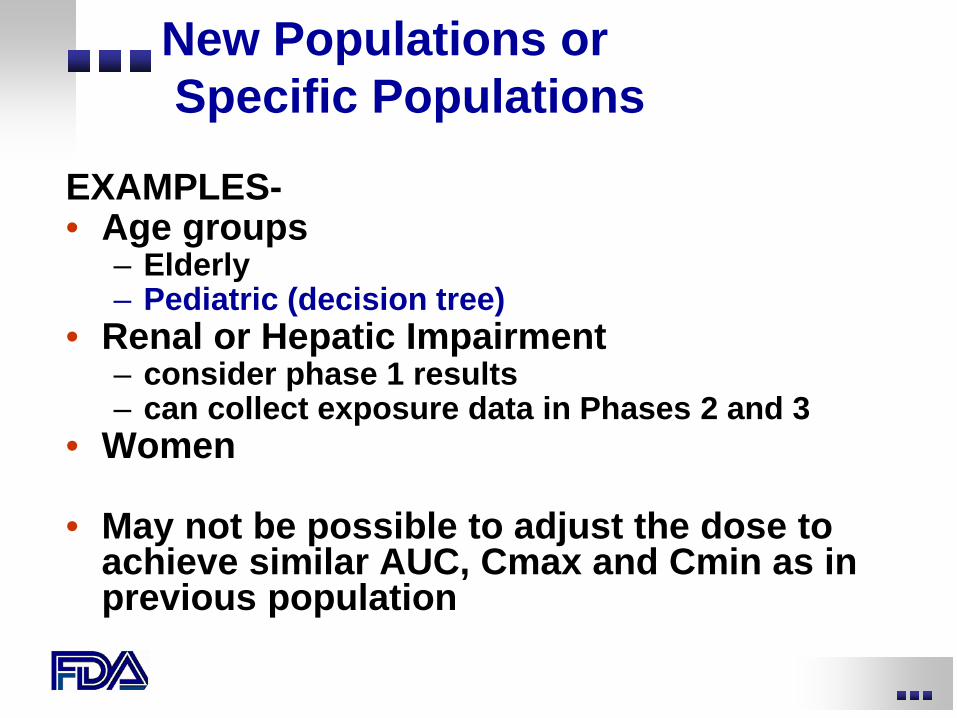
New Populations or Specific Populations
EXAMPLES- • Age groups
– Elderly – Pediatric (decision tree)
• Renal or Hepatic Impairment – consider phase 1 results – can collect exposure data in Phases 2 and 3
• Women
• May not be possible to adjust the dose to achieve similar AUC, Cmax and Cmin as in previous population
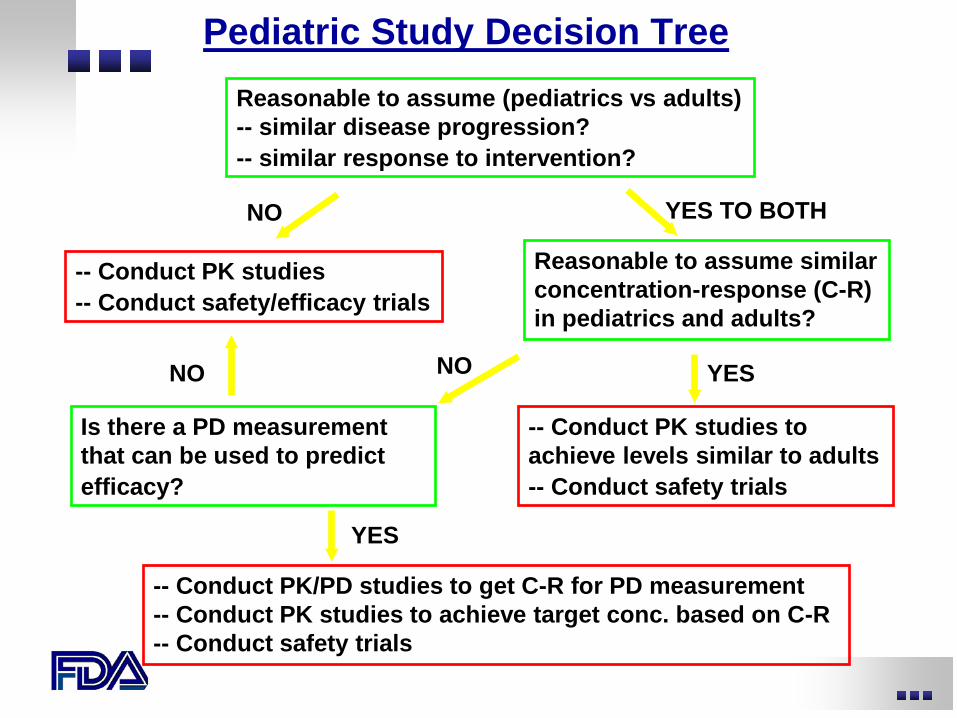
Reasonable to assume (pediatrics vs adults) -- similar disease progression? -- similar response to intervention?
Pediatric Study Decision Tree
NO
Is there a PD measurement that can be used to predict efficacy?
NO
-- Conduct PK studies -- Conduct safety/efficacy trials
NO
-- Conduct PK studies to achieve levels similar to adults -- Conduct safety trials
YES
Reasonable to assume similar concentration-response (C-R) in pediatrics and adults?
YES TO BOTH
-- Conduct PK/PD studies to get C-R for PD measurement -- Conduct PK studies to achieve target conc. based on C-R -- Conduct safety trials
YES
Bioequivalence (BE) Studies
• (Pivotal BE) Formulation change after phase 3 studies are complete
• Alter formulation of active control (blinding) • For valid phase 3 results
– need to determine whether the formulation change alters exposure
– if exposure changes, are the changes clinically relevant?
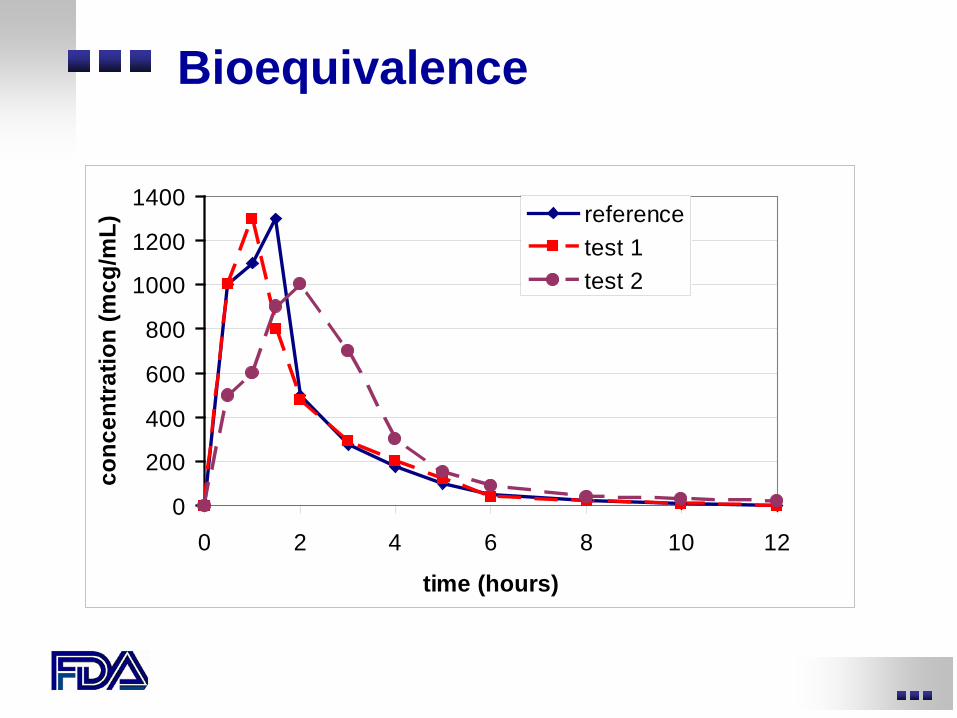
Bioequivalence
0
200
400
600
800
1000
1200
1400
0 2 4 6 8 10 12
time (hours)
conc
entr
atio
n (m
cg/m
L) referencetest 1test 2
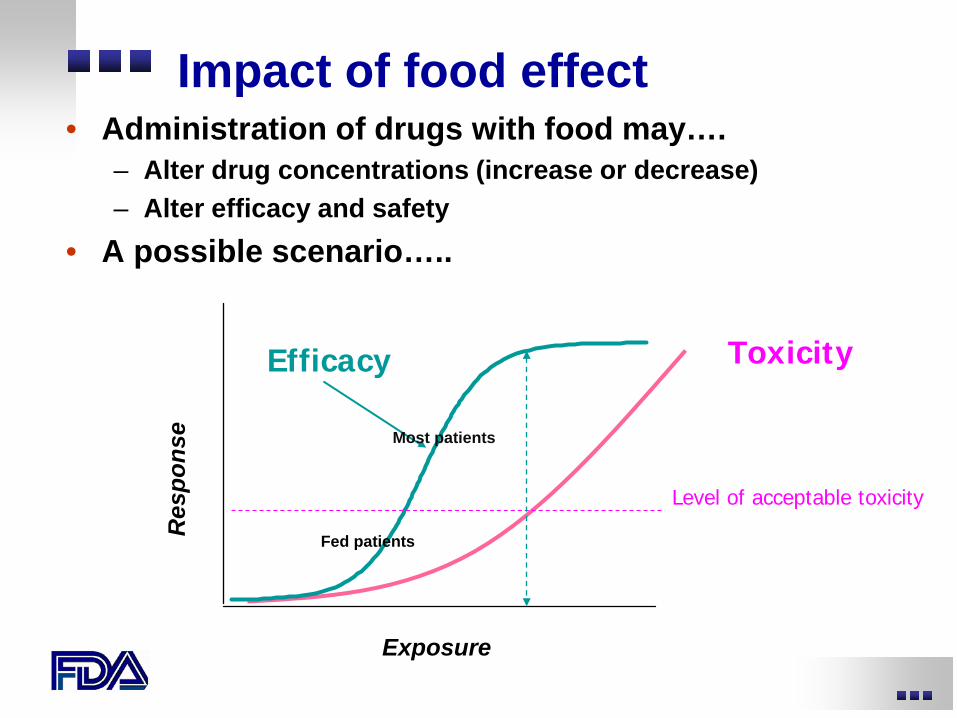
Impact of food effect • Administration of drugs with food may….
– Alter drug concentrations (increase or decrease) – Alter efficacy and safety
• A possible scenario…..
Exposure
Res
pons
e
Efficacy Toxicity
Level of acceptable toxicity
Most patients
Fed patients
Impact of food effect Possible sequence of events…
• First food effect study: no effect of food • Phase 2 studies allow administration
with or without food; evaluate a range of doses
• Formulation change prior to Phase 3 – New formulation is not bioequivalent to old
formulation, but it is possible to select a dose for Phase 3
• New formulation is administered without food restrictions in Phase 3
Impact of food effect Possible sequence of events…
• Food effect study conducted in parallel with Phase 3 trials – Food decreases AUC and Cmax by 30%
• The results of the Phase 3 study
(conducted with no food restrictions) are positive: the drug is safe and effective – Can we conclude that the food effect is not
clinically significant?
Impact of food effect Possible sequence of events…
• ….. Can we conclude that the food effect is
not clinically significant?
• To answer the question, consider- – How often was drug given with food/without food – Exposure-response relationship
Barriers to informative exposure-response evaluation
Barriers to informative exposure-response evaluation
• Exposure data are not collected in late phase 2 or phase 3
• Study design flaws • Study conduct flaws
Study Design Flaws
• Under-powered for study objectives • Doses
– too few – doses too close together
• Plasma samples – inappropriate timing – insufficient number – sample for only one drug in multidrug therapy
Flaws in Conduct of Study
• Poor record-keeping – dosing times – plasma sample times
• Analytical methods
– bioanalytical method for PK unacceptable
Two case studies
Case 1- Maraviroc
• HIV CCR5 inhibitor • Indication: treatment of HIV infection
in patients infected with CCR5-tropic HIV-1 virus
Maraviroc Phase 2b/3 Dose Selection
• Phase 2a conclusion (Viral dynamic modeling; exposure-response evaluation) – Evaluate maraviroc 300 mg qd and 300 mg bid
in Phase 2b/3 • Drug interaction data
– Maraviroc is a CYP3A substrate – Other drugs in antiretroviral regimen may
increase or decrease maraviroc concentrations
– Maraviroc does not affect concentrations of other drugs
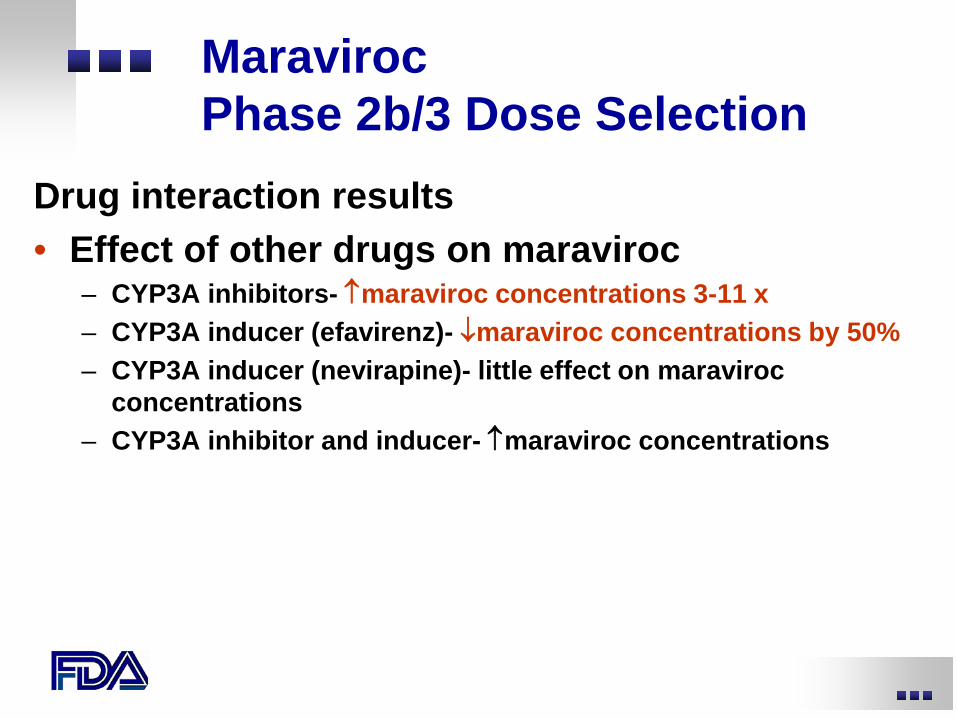
Maraviroc Phase 2b/3 Dose Selection
Drug interaction results • Effect of other drugs on maraviroc
– CYP3A inhibitors- ↑maraviroc concentrations 3-11 x – CYP3A inducer (efavirenz)- ↓maraviroc concentrations by 50% – CYP3A inducer (nevirapine)- little effect on maraviroc
concentrations – CYP3A inhibitor and inducer- ↑maraviroc concentrations
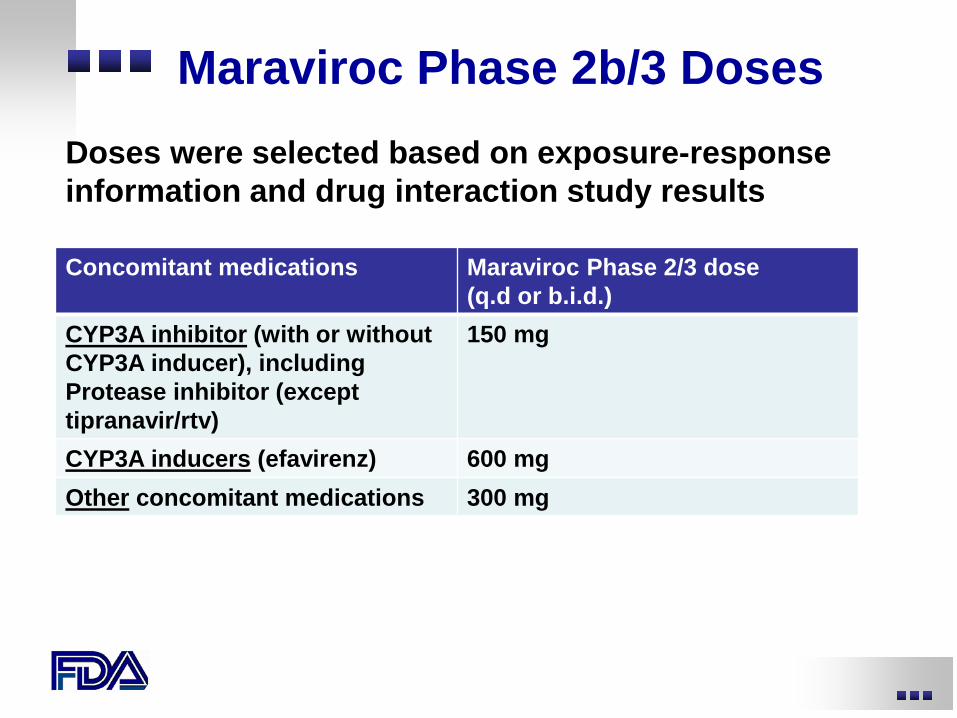
Maraviroc Phase 2b/3 Doses
Concomitant medications Maraviroc Phase 2/3 dose (q.d or b.i.d.)
CYP3A inhibitor (with or without CYP3A inducer), including Protease inhibitor (except tipranavir/rtv)
150 mg
CYP3A inducers (efavirenz) 600 mg Other concomitant medications 300 mg
Doses were selected based on exposure-response information and drug interaction study results
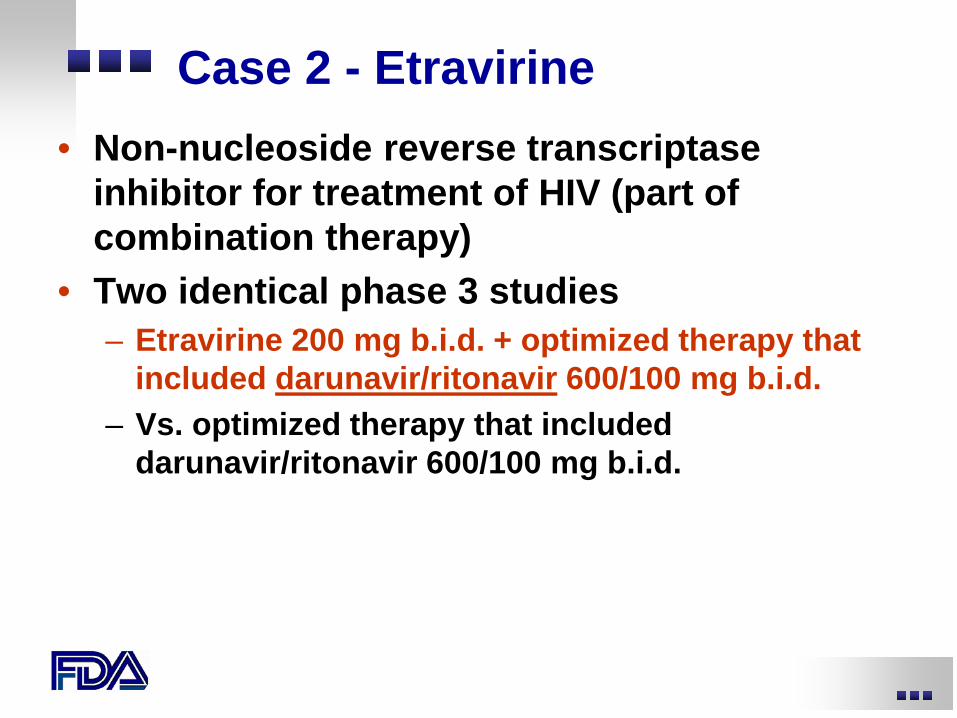
Case 2 - Etravirine • Non-nucleoside reverse transcriptase
inhibitor for treatment of HIV (part of combination therapy)
• Two identical phase 3 studies – Etravirine 200 mg b.i.d. + optimized therapy that
included darunavir/ritonavir 600/100 mg b.i.d. – Vs. optimized therapy that included
darunavir/ritonavir 600/100 mg b.i.d.
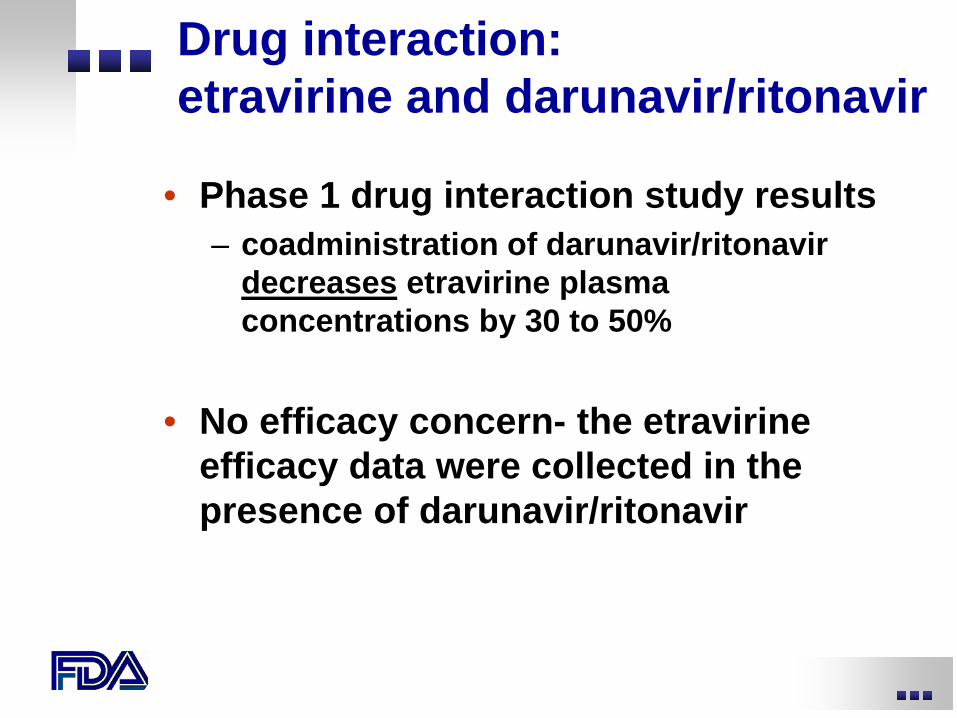
Drug interaction: etravirine and darunavir/ritonavir
• Phase 1 drug interaction study results – coadministration of darunavir/ritonavir
decreases etravirine plasma concentrations by 30 to 50%
• No efficacy concern- the etravirine efficacy data were collected in the presence of darunavir/ritonavir
Potential safety concern
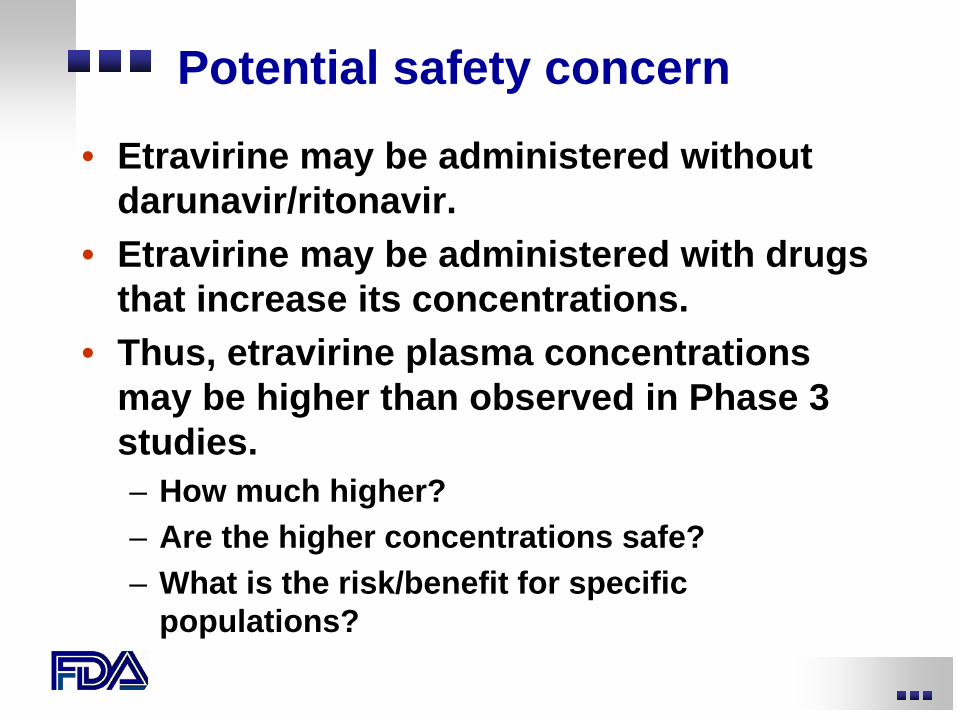
• Etravirine may be administered without darunavir/ritonavir.
• Etravirine may be administered with drugs that increase its concentrations.
• Thus, etravirine plasma concentrations may be higher than observed in Phase 3 studies. – How much higher? – Are the higher concentrations safe? – What is the risk/benefit for specific
populations?
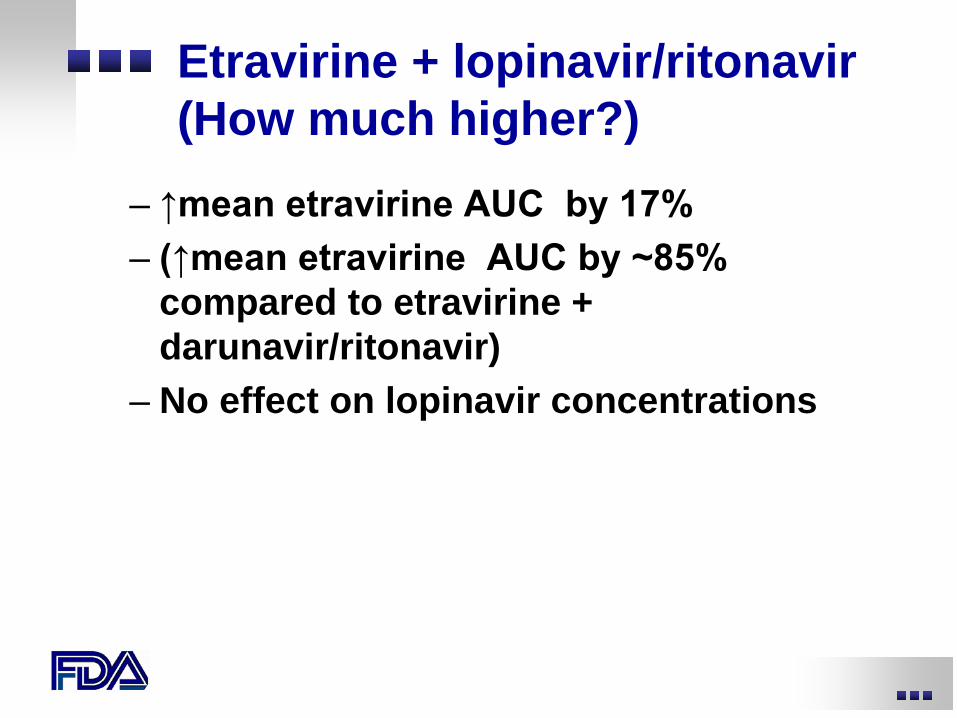
Etravirine + lopinavir/ritonavir (How much higher?) – ↑mean etravirine AUC by 17%
– (↑mean etravirine AUC by ~85% compared to etravirine + darunavir/ritonavir)
– No effect on lopinavir concentrations
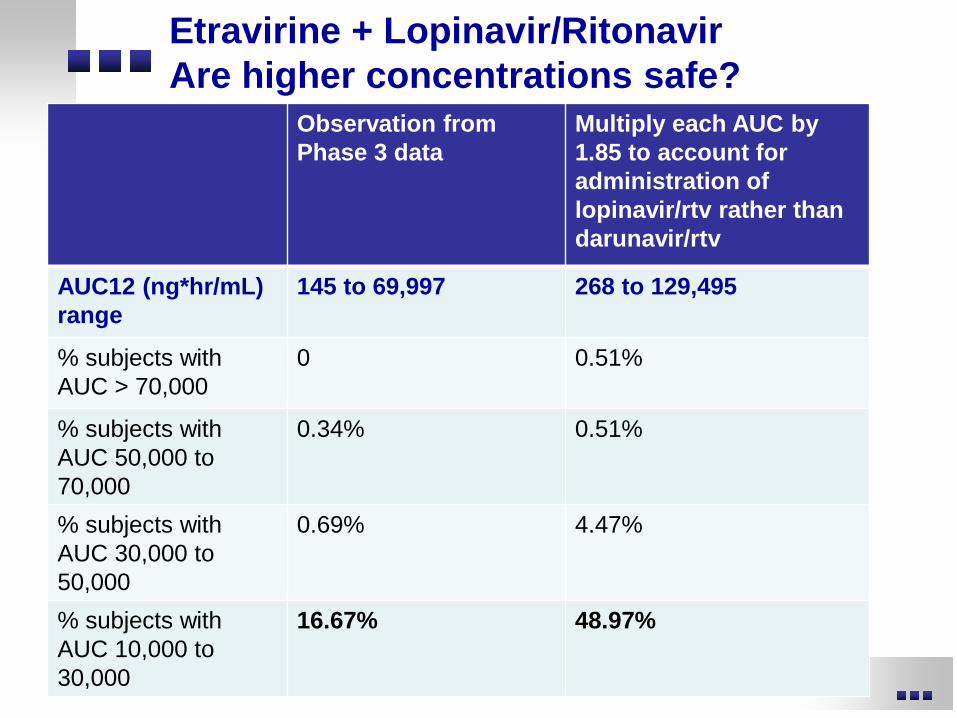
Etravirine + Lopinavir/Ritonavir Are higher concentrations safe?
Observation from Phase 3 data
Multiply each AUC by 1.85 to account for administration of lopinavir/rtv rather than darunavir/rtv
AUC12 (ng*hr/mL) range
145 to 69,997 268 to 129,495
% subjects with AUC > 70,000
0 0.51%
% subjects with AUC 50,000 to 70,000
0.34% 0.51%
% subjects with AUC 30,000 to 50,000
0.69% 4.47%
% subjects with AUC 10,000 to 30,000
16.67% 48.97%
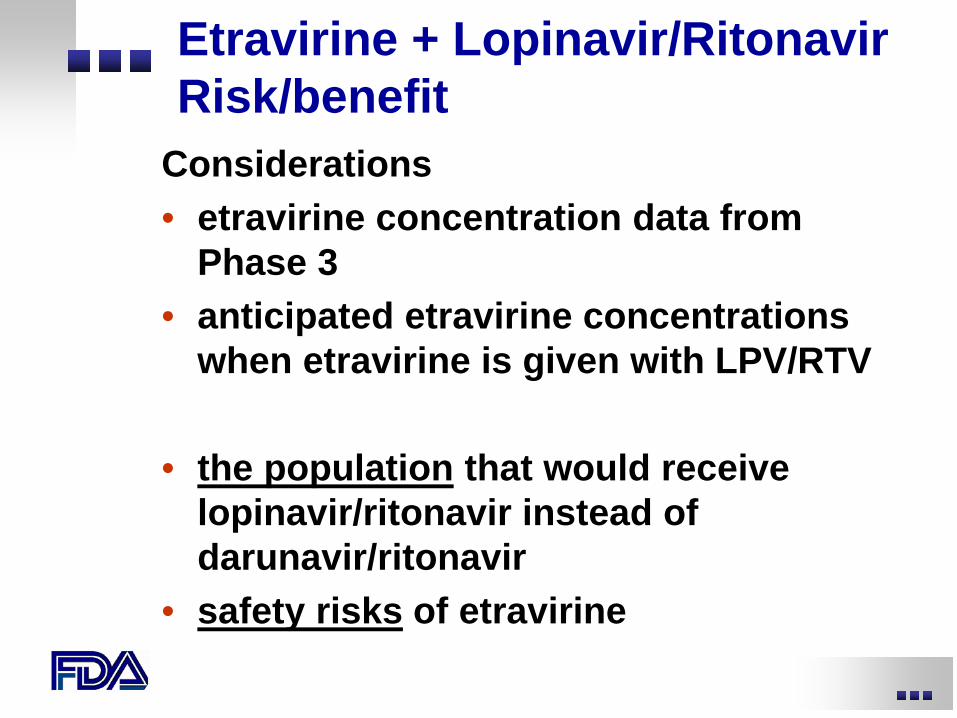
Etravirine + Lopinavir/Ritonavir Risk/benefit
Considerations • etravirine concentration data from
Phase 3 • anticipated etravirine concentrations
when etravirine is given with LPV/RTV
• the population that would receive lopinavir/ritonavir instead of darunavir/ritonavir
• safety risks of etravirine
Conclusions: Relevance and impact
If a tree falls in the forest and no one hears it, does it make a sound?
If an exposure-response relationship exists for a drug, but drug concentrations are not determined during phase 2 or phase 3, can we optimize therapy for all patient populations?
Answer: NO!!
Other versions of the answer: • You don’t know what you don’t know • Ignorance is not bliss
Conclusions (relevance and impact)
• Without exposure-response information – Dose selection may not be optimal – We cannot interpret significance of exposure
changes
• Result: Lack of dosing instructions for certain groups – They are deprived of therapy – Or, they risk suboptimal safety and efficacy


![Investigator Responsibilities – Regulation and Clinical TrialsNov 13, 2019 · General Clinical Investigator Responsibilities [21 CFR 312.60] Ensuring that an investigation is conducted](https://img.pdfslide.net/doc/110x75/6025abcc7e98c341a66c39a2/investigator-responsibilities-a-regulation-and-clinical-trials-nov-13-2019-.jpg)