Embed Size (px)
DESCRIPTION
My slides are from 11 to 21 at this meeting. The URL with meeting details is http://www.hhs.gov/ash/initiatives/hai/Events/hai_data_summit_presentations.html
Citation preview

2012 HAI Data Summit
HHS HAI Reporting Systems
Second Plenary Co-Chairs: David R. Hunt, MD, FACS Hui-Hsing Wong, MD, JD 9:00 AM – 10:15 AM

2012 HAI Data Summit
Key Questions Addressed
3. With HHS analyzing and reporting HAI data acquired through a variety of programs and systems, each with its own methodology, and because these differences sometimes produce estimates of HAI scope, magnitude, or trends that are incongruent, what are the priorities of stakeholder groups as policies for HAI data reporting are being addressed?
4. What policies and standards are needed to facilitate consistent public reporting of the Centers for Disease Control and Prevention (CDC) National Healthcare Safety Network (NHSN) data at the state and federal levels and how should those policies be identified or developed or maintained?

2012 HAI Data Summit Overview of Key HHS Data Sources: IMPAQ/RAND Evaluation Results
Daniel Weinberg, Ph.D. IMPAQ International Katherine Kahn, M.D. RAND Corporation
For the IMPAQ/RAND Action Plan Evaluation Team

2012 HAI Data Summit
Background • Work undertaken as part of the evaluation of
the HHS Action Plan to Prevent HAIs • Two tasks related to HAI data:
– Inventory of HHS data systems that can be used to track HAIs
– Presentation in a Baseline Assessment Report of HAI rates derived from HHS data systems
• Focus on the 6 HAIs named in the Action Plan

2012 HAI Data Summit
Relationship of Data Tasks to Action Plan
• Overlaps with Action Plan’s surveillance activities • Same HAIs • Some of the same data sources • Baseline information and tracking of progress
• Complements Action Plan’s surveillance activities • Additional data sources and metrics • Additional time periods • National, regional, and state levels • Juxtaposition of multiple data sources in a single
compendium

2012 HAI Data Summit
Inventory of HHS Data Systems
• Identified the various HHS data systems available for HAI surveillance
• Characterized the data systems along several dimensions
• Analyzed the strengths and weaknesses of the data sources
• Researched and proposed HAI surveillance specifications for administrative data
• Recommended data for inclusion in the Baseline Assessment Report

2012 HAI Data Summit
Data Systems Included in the Inventory and Data Report
Data System (HAIs) Data Characteristics
NHSN (CAUTI, VAP, CLABSI, SSI. Not CDI or MRSA)
Most clinically valid federal data source. Number of hospitals involved: 211 (2006), 621 (2006-07), 1545 (2006-08), 1749 (2009), 2473 (2010), >4000 (at present).
EIP/ABCs (MRSA) Hospitals and reference laboratories collect MRSA data in 9 surveillance areas (mostly metropolitan), capturing all positive MRSA cultures from within the surveillance areas. Data are publicly available for 2005 through 2009.
MPSMS (CAUTI, VAP, CDI, MRSA, CLABSI)
Rates based on the experiences of a representative sample of Medicare FFS (excluding Medicare Advantage) population (until 2009) or all payers’ discharges of four types (beginning 2009). The quality of the data depends on the accuracy with which patient information is documented.
Hospital Compare (SCIP)
Publicly available database providing hospital-level information populated from the Hospital Inpatient Quality Reporting Program (formerly RHQDAPU). Data availability depends on SCIP measures (1 & 3: 2005-09; 2: 2006-09; 4 & 6: 2008-09).
Medicare FFS claims (all 6 HAIs)
Relies on Medicare FFS claims (excludes Medicare Advantage). Differences in how hospital staff assign diagnosis and procedure codes may result in inconsistent HAI reporting. Prior to FY2008, did not include info. on POA. Lack of clinical detail is a drawback.
HCUP (all 6 HAIs) All payer. Relies on patient discharge data. Differences in how hospital staff assign diagnosis and procedure codes may result in inconsistent HAI reporting. Prior to FY2008, did not include info. on POA. Lack of clinical detail is a drawback.

2012 HAI Data Summit
Important Policy Changes & Events
211621
1545
1749
2473a
4000b
2006 2007 2008 2009 2010 2011
Hospitals Reporting via NHSN
10/07: POA indicator introduced
10/08: HAC non-payment policy effective
2008: No MPSMS data collected
2009: MPSMS sample expands from Medicare population to all payers and is restricted to HF, AMI, PNEU & SCIP procedures
6/09: AP released
3/08: GAO report released
a Number of hospitals reporting denominator data for DA module (2010 data summary report)
b Approximate number of hospitals participating in IQR program.
2012 HAI Data Summit
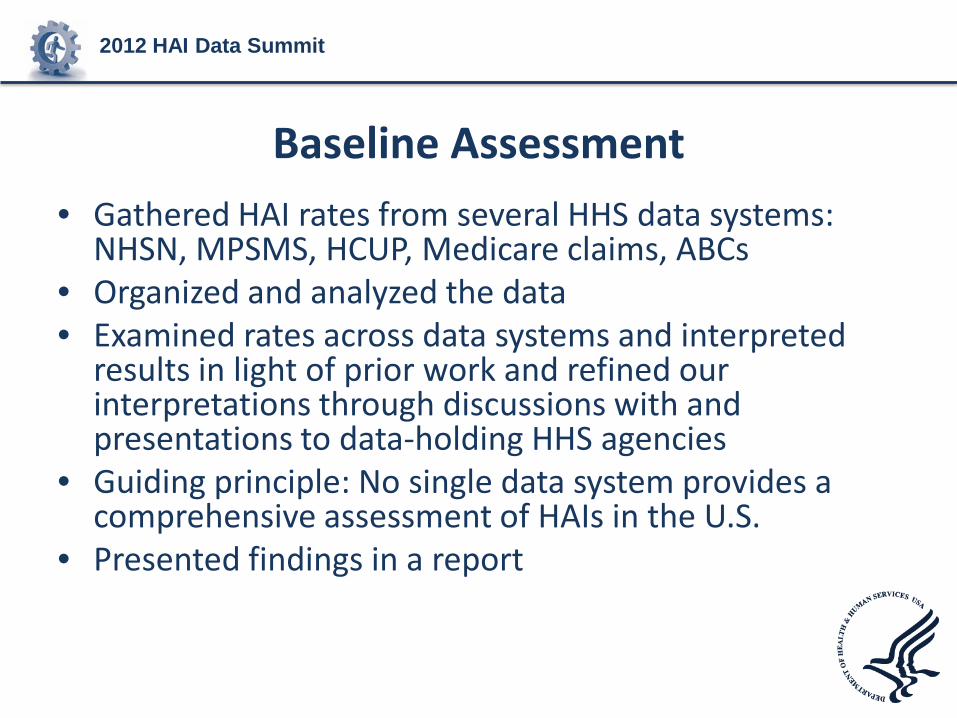
Baseline Assessment • Gathered HAI rates from several HHS data systems:
NHSN, MPSMS, HCUP, Medicare claims, ABCs • Organized and analyzed the data • Examined rates across data systems and interpreted
results in light of prior work and refined our interpretations through discussions with and presentations to data-holding HHS agencies
• Guiding principle: No single data system provides a comprehensive assessment of HAIs in the U.S.
• Presented findings in a report

2012 HAI Data Summit
Summary Information for CAUTI and CLABSI
CAUTI CLABSI

2012 HAI Data SummitPfP HAC HAI Measurement Strategy
Noel Eldridge, MS Center for Quality Improvement and Patient Safety Agency for Healthcare Research and Quality

2012 HAI Data Summit
Partnership for Patients • Nationwide campaign in US to reduce harm to
patients over three years: 2011-2013 – Launched April 2011 -- 2010 is “baseline” year
• Goals are to reduce: – Preventable hospital-acquired conditions by 40%
• 44% established as overall preventable fraction of HACs – Hospital readmissions by 20%
• 2010 baselines measured by Program – 145 measured HACs per 1000 discharges (4.75M total) – 14.4% (30-day) readmissions

2012 HAI Data Summit
Two Key Elements of PFP Measurement Strategy
• National measurement strategy – Establish baselines and assess yearly progress using
existing systems from AHRQ/CMS, CDC, and AHRQ – Employ sampling and extrapolation
• >90% of measured HACs from Medicare Patient Safety Monitoring System (MPSMS - chart review method with 21 defined adverse events) that uses IQR charts (800 hospitals)
• Local measurement strategy – Rely on CMS-funded Hospital Engagement Networks
(HENs) to select their own systems for quality improvement programs
– Assess individual HEN performance – No new Federal data submission mandates
2012 HAI Data Summit
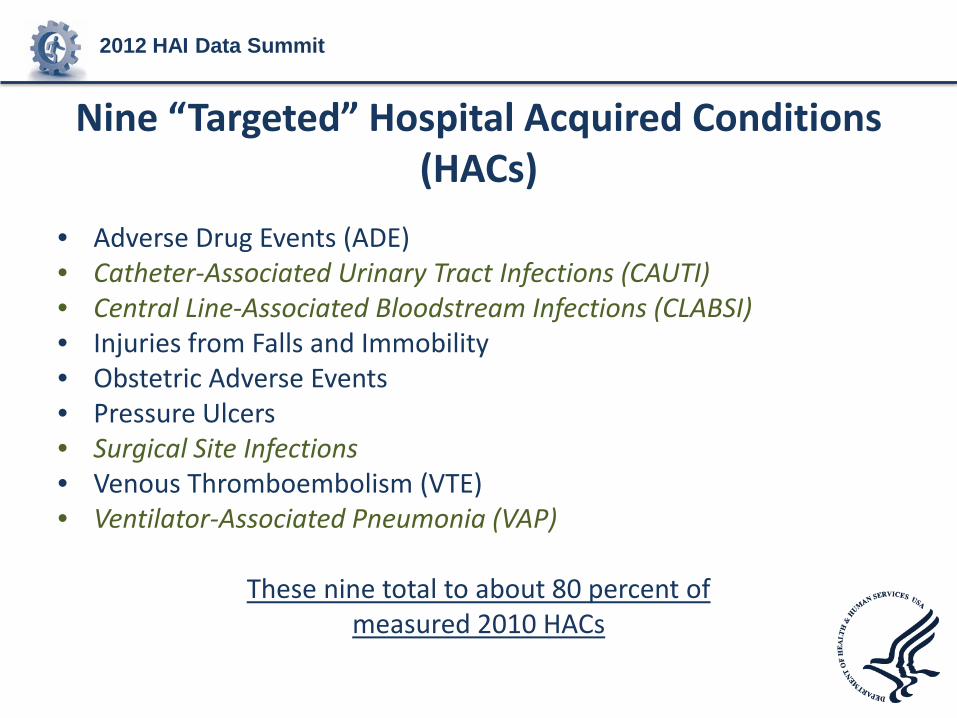
Nine “Targeted” Hospital Acquired Conditions (HACs)
• Adverse Drug Events (ADE) • Catheter-Associated Urinary Tract Infections (CAUTI) • Central Line-Associated Bloodstream Infections (CLABSI) • Injuries from Falls and Immobility • Obstetric Adverse Events • Pressure Ulcers • Surgical Site Infections • Venous Thromboembolism (VTE) • Ventilator-Associated Pneumonia (VAP)
These nine total to about 80 percent of measured 2010 HACs

2012 HAI Data Summit
HAC Baseline and Goal (per 1,000 Admissions)
PFP Hospital-Acquired Condition Measured HACs per
1,000 Admissions Adverse Drug Events 49 Pressure Ulcers 40 Catheter-Associated Urinary Tract Infections 12 Falls 8 Surgical Site Infections 3 Obstetric Adverse Events 3 Ventilator-Associated Pneumonia 1.2 Central Line-Associated Bloodstream Infections 0.5 Venous Thromboembolism 0.5 All Other HACs 27 Total 145

2012 HAI Data Summit
PFP-Measured HACs Pie Chart (2010)
34.2%
27.8%
8.4%
5.5%
2.0%
1.7% 0.8%
0.4%
0.3%
18.8%
Percent of Total Measured HACs – PFP 2010 Baseline (4.745M)
Adverse Drug Events (57% Hypoglycemic Events & 42% Anticoagulant Drug Events)
Pressure Ulcers
Catheter-Associated Urinary Tract Infections
Falls
Surgical Site Infections
Obstetric Adverse Events
Ventilator-Associated Pneumonia
Central Line-Associated Bloodstream Infections
Venous Thromboembolism
All Other HACs -- based on 14 other specific measures (from C diff Infection to Contrast Nephropathy)

2012 HAI Data Summit
Four “Targeted” HAI HACs Total 11.6 percent of Measured HACs
34.2%
27.8%
8.4%
5.5% 2.0%
1.7%
0.8%
0.4% 0.3%
18.8%
Percent of Total Measured HACs – PFP 2010 Baseline (4.745M)
Adverse Drug Events (57% Hypoglycemic Events & 42% Anticoagulant Drug Events)
Pressure Ulcers
Catheter-Associated Urinary Tract Infections
Falls
Surgical Site Infections
Obstetric Adverse Events
Ventilator-Associated Pneumonia
Central Line-Associated Bloodstream Infections
Venous Thromboembolism
All Other HACs -- based on 14 other specific measures (from C diff Infection to Contrast Nephropathy)

2012 HAI Data Summit
Four HAIs Measured Among “All-Other” HACs
34.2%
27.8%
8.4%
5.5% 2.0%
1.7%
0.8%
0.4%
0.3%
18.8%
Percent of Total Measured HACs - PFP 2010 Baseline
•These four HAIs (MRSA, VRE, C diff, and Post-op Pneumonia) are 4.5% of the measured HACs.
•The four targeted HAIs (11.6%) combined with these four HAIs total to 16.1% of measured HACs.
•About one-half of the measured HAIs are CAUTIs.

2012 HAI Data Summit
Eight HAIs Included in PFP Measures
Sterile sites only ****
PFP HAI Pre-launch Estimate
2010 Measured Baseline
2013 Goal (-17.6%*)
Comment on Measure
CLABSI 40,000 18,000 14,800 1.1% of pts w/new CL(s)**
CAUTI 530,000 400,000 330,000 Physician diagnosed & Rx
SSI (NHSN***) 110,000 96,000 79,100 SCIP (12) + 5 operations
VAP 40,000 38,000 31,300 Physician diagnosed & Rx
C. difficile NA 87,000 71,700 Positive assay >2 days
Post-op Pneumonia NA 97,000 79,900 Physician diagnosed & Rx
MRSA NA 15,000 12,400 Sterile sites only****
VRE NA 13,000 10,700
* At launch, goals varied from minus 7% (SSI) to minus 25% (CLABSI) ** Percent from raw data from 4-condition MPSMS sample *** Special CDC NHSN-based calculation for PFP use **** Including all apparently new cases identified would increase total 4 to 8-fold
2012 HAI Data Summit
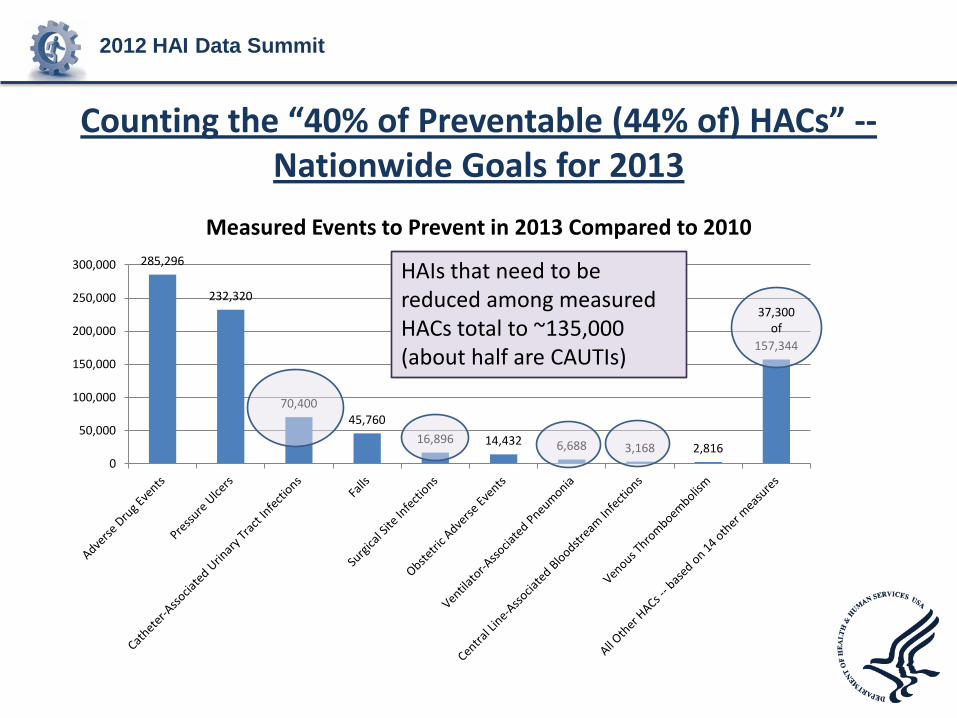
Counting the “40% of Preventable (44% of) HACs” -- Nationwide Goals for 2013
285,296
232,320
70,400 45,760
16,896 14,432 6,688 3,168 2,816
157,344
0
50,000
100,000
150,000
200,000
250,000
300,000
Measured Events to Prevent in 2013 Compared to 2010
37,300 of
HAIs that need to be reduced among measured HACs total to ~135,000 (about half are CAUTIs)

2012 HAI Data Summit
Take-Home Points • Partnership for Patients Program has “targeted” 4
HAIs among 9 HACs for focused work to reduce their occurrences
• PFP is measuring 8 HAIs in the national measurement (4 targeted HAIs and 4 others) – in 2010 HAIs are about one-sixth of total measured HACs – overall goal is to get from 145 to 119 measured HACs per
1,000 admissions – 2010 to 2013 • PFP HENs and affiliated hospitals are measuring
HACs (including HAIs) their own ways
(Time for discussions in acute-care breakout session this afternoon) Or email: [email protected], phone: 301-427-1156

2012 HAI Data Summit Provider Perspective: Resource requirements for surveillance HAIs and other patient safety metrics
Russell N. Olmsted, MPH, CIC Director, Infection Prev. & Control Services Saint Joseph Mercy Health System, Ann Arbor, MI

2012 HAI Data Summit2003 2010
2011
Power of the Consumer: Growth in State‐based Legislation on HAI
Reporting Mandates Reporting of CLABSI in ICUs, 2011; Colon surg + Abd. Hyst, & CAUTIs 2012

2012 HAI Data Summit
On the Horizon: Inpatient Quality Reporting
HAI Event Facility Type Reporting Start Date
MRSA Bacteremia Lab ID* Acute Care Hospitals – facility wide January 2013
C. difficile LabID Event Acute Care Hospitals – facility wide January 2013
HCW Influenza Vaccination (aggregate data will be allowed;
updates to NHSN HCP module underway )
Acute Care Hospitals January – March 2013
* Lab ID = reports positive cultures detected > day 3 of hospitalization
CMS 2012 IPPS final rule released; August 18 2011 Federal Register 76 (no. 160)

2012 HAI Data Summit HHS HAI Prevention Progress Dashboard TOPIC METRIC & TARGET Progress Report
Central line-assoc. bloodstream infection (CLABSI)
CLABSI Std Infection Ratio (SIR); 50% drop
18% drop in 2009 32% drop in 2010!
CLABSI Insert. Bundle Proportion of insertions using bundle; 100% adherence
Sample of Hospitals = 92% - on target, 2009
C. difficile Infection (CDI) Rate/1000 discharges; 30% reduction
8.9 in 2009; 9.4 in 2010 – not likely to meet target
Catheter-assoc. UTI (CAUTI) CAUTI rate ; 25% reduction Estimate in ’08 = 5% reduction 3-10 % reduction, 2010
MRSA Rate invasive MRSA/100k pop.; 50% reduction
22.72 in 2009 = 13.4% drop compared to ’07-’08 18% reduction, HA-MRSA, 2010
SSI SIR; 25% reduction 5% reduction SSIs, 2009 8% reduction, 2010
SSI Proportion SCIP measures; 95% adherence
> 92% in 2009 – on target

2012 HAI Data Summit
At-A-Glance: Patient Safety Care Improvement Projects; SJMH, 2012
Society of Thoracic Surgeons database
MI Surg. Quality Collaborative Tumor Registry
National CV Registry: endarteryectomy Peripheral Vascular Initiative BCBSM Vascular Interventions Consortium
BCBSM Cardiology Interventions Pneumonia Collaborative Series Initiative
Leapfrog
Implantable defibrillator Registry SCCM Project Impact MHA Hosp Engagement Network [HEN]
MHA Keystone Surgery Vermont Oxford Network: neonates ACS Care Registry MHA Keystone ICU: CLABSI, VAP* MI Care Improvement Registry Mi Dept of Comm Health SHARP Proj. MHA HAI: CAUTI, Hand Hygiene Payer-Specific Patient Registry Trinity Health Patient Care
Improvement Projects MI Breast Oncology Initiative CDC NHSN: SSI, CLABSI, VAP,
CAUTI, MRSA, C. difficile infection Core Measures: incl. SCIP,
Trauma Foundation Registry Patient Satisfaction: HCAHPS Jt. Commission Disease-Specific cert. ACS NSQIP NDNQI Culture of Safety Training & Surveys Medication Safety: pain mgmt, anti-coag., reconciliation, glycemic control, sedation safety
Others: patient falls & pressure ulcers,use of VTE prophylaxis
Readmissions and transitions of care: between units and physician handoffs
Are we at a Tipping Point in PI Collaboratives R/T Capacity?
* Collaboratives or benchmarking projects that include HAI data

2012 HAI Data Summit
Traditional Automated
Meaningful Use: The Promise of Functional Electronic Medical Records
Atreja A, et al. AJIC 2008

2012 HAI Data Summit
Health Informatics Systems @ SJMH, Ann Arbor
• 537-bed community teaching hospital; member of Trinity Health (one of the largest Catholic health systems in the U.S.)
• Electronic medical record {Cerner} – Powerchart (main EMR platform) – FirstNet (emergency department) – Inet/Iview (pulls in data from devices such as vent.,monitors) – PharmNet (medications); PathNet (LIS) – RadNet (Imaging – incl. archive/retrieval system) – SurgiNet (surgery services) – Supply chain (Lawson) – Scheduling System

2012 HAI Data Summit
Examples of Provider Support
Tools in EMR Systems

The Resource Intensity of HAI Surveillance
• IPs surveyed from 222/224 acute care hospitals, NY
• Scope of responsibility for “average IP” 1.0 FTE:
– 151 pt. Beds – 1.3 ICUs – 21 LTCF beds – 0.6 Dialysis ctrs – 0.5 ASC – 4.8 Amb. Care – 1.3 PCP offices
infrastructure
capacity responsibilities In balance?
Stricof RL, et al. AJIC 2008
2012 HAI Data Summit
HAI Data: The Infection Preventionist’s Lament!
The Good News: Everybody wants HAI data
The Bad News: Everybody wants HAI data

2012 HAI Data Summit
Gap Analysis: Current Capacity of EMR vs Ideal
• Weak Signal:Noise ratio – Lots of unfulfilled potential to tap EMR for HAI surveillance – Need studies on algorithmic detection of HAIs – Low proportion of enterprise-wide EHR currently in place
• Critical need: engage EMR vendors - infrastructure to facilitate HAI surveillance, e.g. device denominators, mapping surgical procedures to ICD codes, enterprise-wide data warehouse – Opportunities with meaningful use initiative?
• Advanced analytical tools, e.g. data mining, are helpful but are they cost effective?
• The Holy Grail: real time clinical decision support (CDS) – Antimicrobial stewardship – More precise application of HAI prev. strategies at adm. – Immunization against vaccine prev. diseases

2012 HAI Data Summit State Perspective of Different HAI Reporting Systems
Stephen M. Ostroff, MD Director, Bureau of Epidemiology PA Department of Health

2012 HAI Data Summit
“Confidence is a very fragile thing.”
Joe Montana

2012 HAI Data Summit
Why do we measure HAIs?
• Public Health – measure progress or lack thereof – target resources to maximize prevention
opportunities
• Public – to make informed healthcare decisions
2012 HAI Data Summit
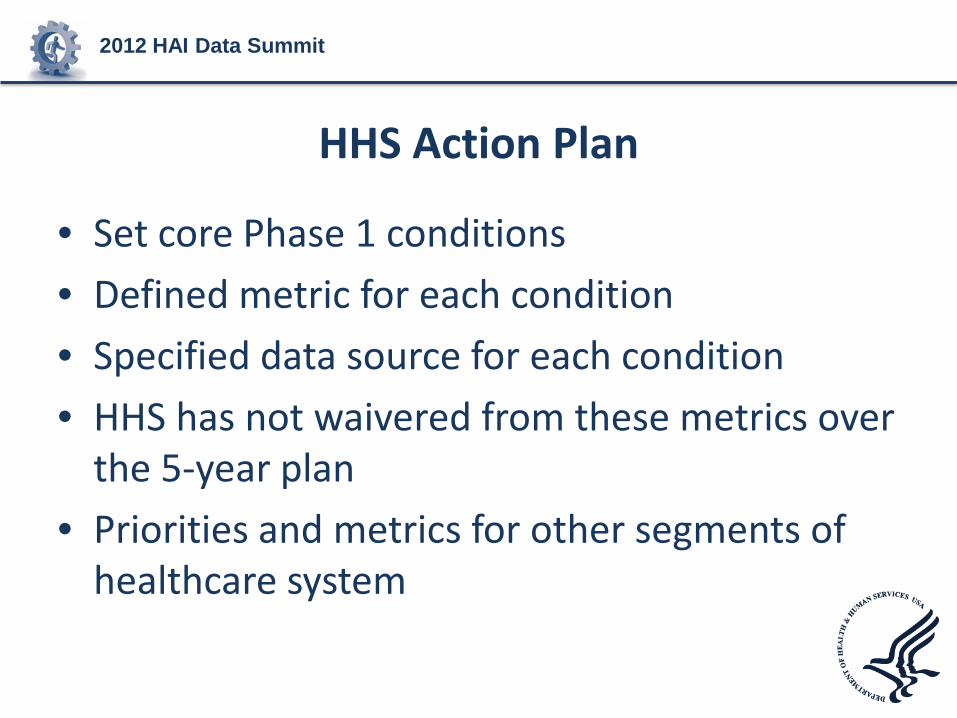
HHS Action Plan
• Set core Phase 1 conditions • Defined metric for each condition • Specified data source for each condition • HHS has not waivered from these metrics over
the 5-year plan • Priorities and metrics for other segments of
healthcare system

2012 HAI Data Summit
Concerns
• Attempts to produce & present measures using alternative data sources – CLABSIs through HCUP data – CDI through NHSN
• National measures vs. state measures vs. facility-specific measures
• Data reliability for measuring trends

2012 HAI Data Summit
Concerns
• National measures vs. state measures vs. facility-specific measures – State-specific CLABSI/CAUTI/SSI through
NHSN – State-specific CDI through HCUP – Hospital Compare data by CMS
2012 HAI Data Summit
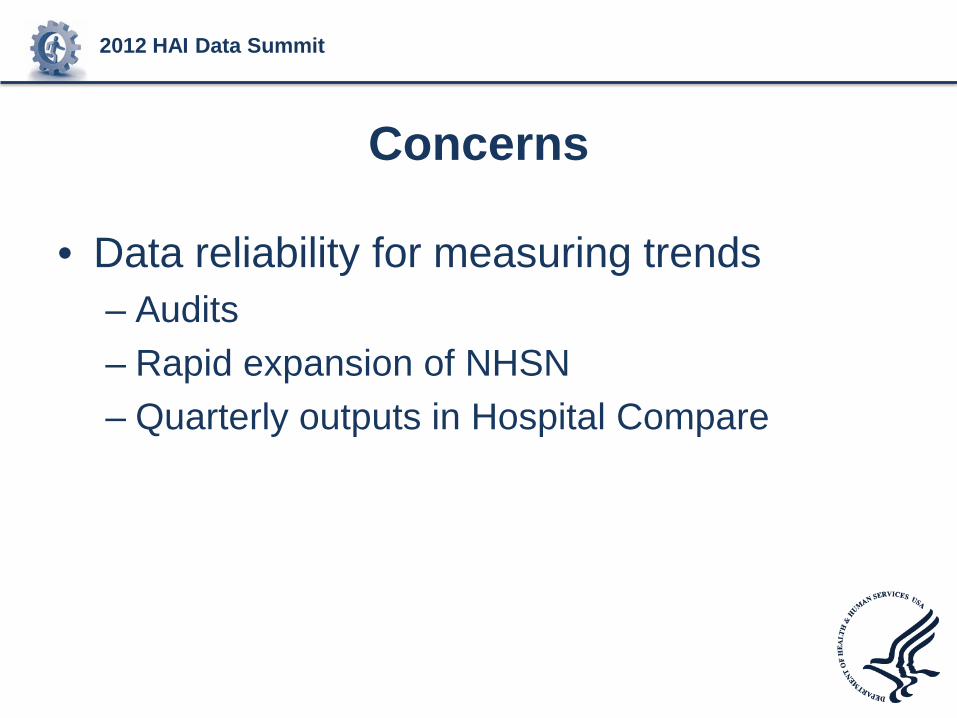
Concerns
• Data reliability for measuring trends – Audits – Rapid expansion of NHSN – Quarterly outputs in Hospital Compare

2012 HAI Data Summit
Concerns
• Incompatibility of measures between federal and state systems

2012 HAI Data Summit
Example
• Hospital Compare – CLABSI in ICUs – Standardized Infection Ratios
• Compared to 2006-2008 baseline – Quarterly data (Jan-Mar 2011)
• NY State Department of Health – Reports rates/1000 central line days – Each ICU individually – Annual data (2010)

2012 HAI Data Summit
Result
Facility Hospital Compare
NYSDOH ICU A
NYSDOH ICU B
Hospital A Better (SIR 0.62) No different No different
Hospital B Better (SIR 0.72) No different No different
Hospital C Worse (SIR 2.22) Worse Better

2012 HAI Data Summit
Example • Virginia
– CLABSI adult ICUs – Reported quarterly (Jan-Mar 2011) – Rates (per 1000 CLD) Facility Hospital
Compare Virginia
Hospital A Better Worse
Hospital B Worse Worse
Hospital C No infections No infections

2012 HAI Data Summit
Example • Pennsylvania
– Housewide – Standardized Infection Ratio – Annual (2010)
Facility Hospital Compare
Interpretation PA 2010 Report
Interpretation
Hospital A 0.59 Better 0.2 Better
Hospital B 0.27 Better 1.7 Worse
Hospital C 0.74 Better 1.4 No different
2012 HAI Data Summit
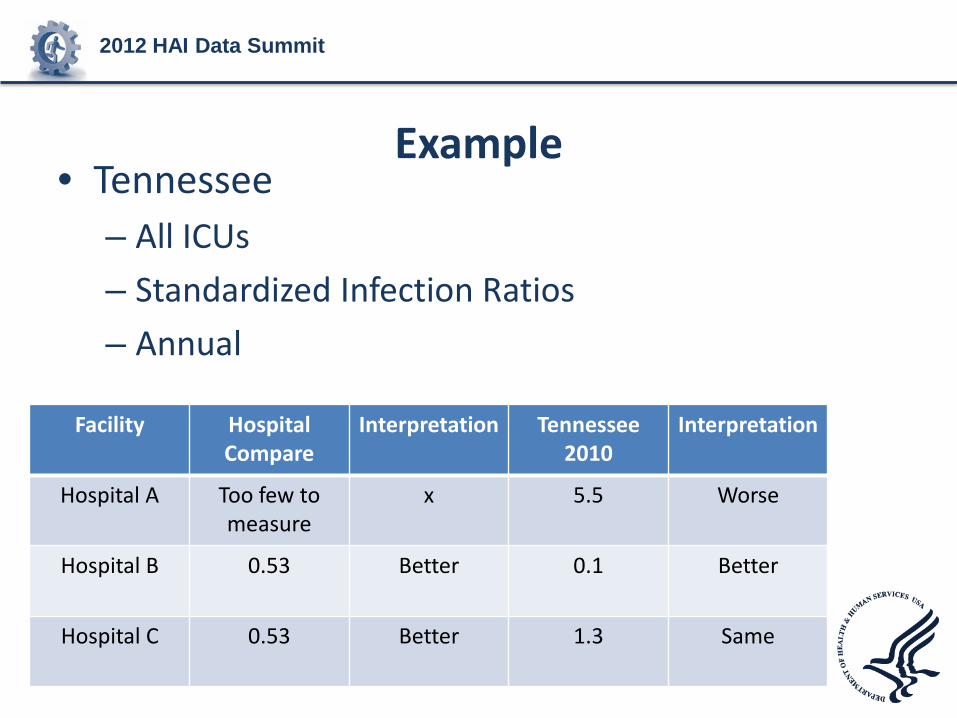
Example • Tennessee
– All ICUs – Standardized Infection Ratios – Annual
Facility Hospital Compare
Interpretation Tennessee 2010
Interpretation
Hospital A Too few to measure
x 5.5 Worse
Hospital B 0.53 Better 0.1 Better
Hospital C 0.53 Better 1.3 Same

2012 HAI Data Summit
Hospital Compare
• Likely same experience will occur with – CAUTI – SSIs
• State-specific data – State reports of CDI
• States using completely different methods than AHRQ for measure

2012 HAI Data Summit
CDC State Specific reports • Measures of state performance using SIR • CLABSI, CAUTI, SSIs • Compared to 2006-2008 baseline • High variability due to
– Mandates vs non-mandates – Variable hospital participation by state
• This problem should improve with higher participation due to CMS IPPS
• Variable approaches to validation will continue to produce limitations

2012 HAI Data Summit
Conclusions • Early in evolution of HAI monitoring and
reporting, variable approaches not so bad • Limits ability to meaningfully monitor trends
by public health, use data by consumers • Important need to define outputs at each
level of system (national, state, local) • Need to standardize inputs and outputs to
make maximal use of information

2012 HAI Data Summit
Dawn M. Sievert, PhD, MS Epidemiologist Lead, NHSN Protocol and Public Reporting Team Surveillance Branch Division of Healthcare Quality Promotion, NCEZID, CDC
CDC National Healthcare Safety Network

2012 HAI Data Summit
CDC National Healthcare Safety Network
• Open to all types of US healthcare facilities
• Allows for timely data collection and sharing
• Maintains security, integrity, and confidentiality
• Uses specifically defined criteria and definitions
• Establishes guidance to eliminate subjectivity
• Implements internal business rules and edit checks to maintain accuracy of data

2012 HAI Data Summit
Extent of Current NHSN Use

2012 HAI Data Summit
Variation in NHSN Reporting
• CMS and State requirements differ by:
– Facility type
– HAI type
– Location type

2012 HAI Data Summit
Standardized Infection Ratio (SIR)
• Summary measure used to track HAIs at a national, state, or local level over time
• Adjusts for several risk factors within a facility found to be significantly associated with differences in infection incidence

2012 HAI Data Summit
Data File Exports from NHSN to CMS • Files to CMS
– Data aggregated by participating facility for reporting quarter
– Currently sending CLABSI, CAUTI, SSI (COLO and HYST)

2012 HAI Data Summit NHSN Published SIR Reports

2012 HAI Data Summit State Published Rate Reports
http://www.hcawv.org/Infect/HAIReport.pdf
West Virginia—State CLABSI Aggregate Rates by ICU Type

2012 HAI Data Summit State Published SIR Reports
http://www.portal.state.pa.us/portal/server.pt/document/1204838/2010haireleasedreport_(2)_pdf
Pennsylvania—CLABSI Adjusted SIRs

2012 HAI Data Summit Consumers Union Report

2012 HAI Data Summit CMS Hospital Compare Report

2012 HAI Data Summit
Work in Progress
• Need governance processes in collaboration with:
– CMS
– CSTE - HAI Standards Committee
– Consumers Union
• Goal is to achieve standardized reporting and harmonized presentation of data for public display
• Moving closer to a consistent message but still work ahead and challenges to overcome

2012 HAI Data Summit
Thank you!

2012 HAI Data Summit
Questions & Answers