Embed Size (px)
Citation preview

KATHLEEN A . BRADY, MDMEDICAL DIRECTOR/MEDICAL EPIDEMIOLOGIST
PHILADELPHIA DEPARTMENT OF PUBLIC HEALTHAIDS ACTIVITIES COORDINATING OFFICE
FEBRUARY 9 , 2015
WHOWHATWHENWHEREWHYHOW spells Epidemiology!
The HIV Care Continuum
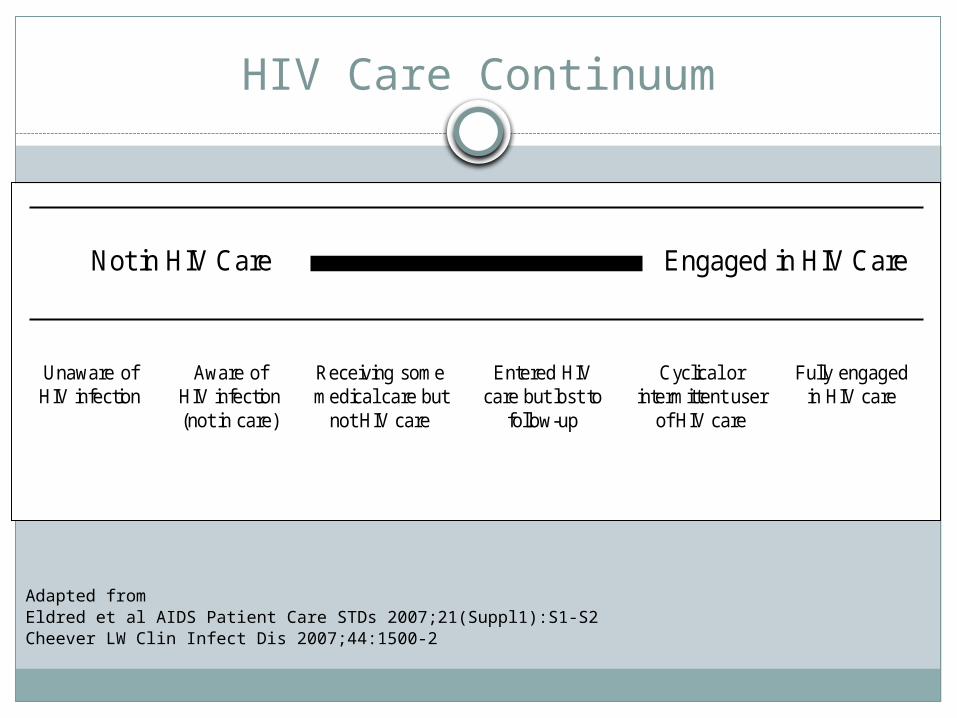
HIV Care Continuum
Adapted from Eldred et al AIDS Patient Care STDs 2007;21(Suppl1):S1-S2Cheever LW Clin Infect Dis 2007;44:1500-2
Not in HIV Care Engaged in HIV Care
Unaware of HIV infection
Aware of HIV infection (not in care)
Receiving some medical care but
not HIV care
Entered HIV care but lost to
follow-up
Cyclical or intermittent user
of HIV care
Fully engaged in HIV care
Who is Aware?
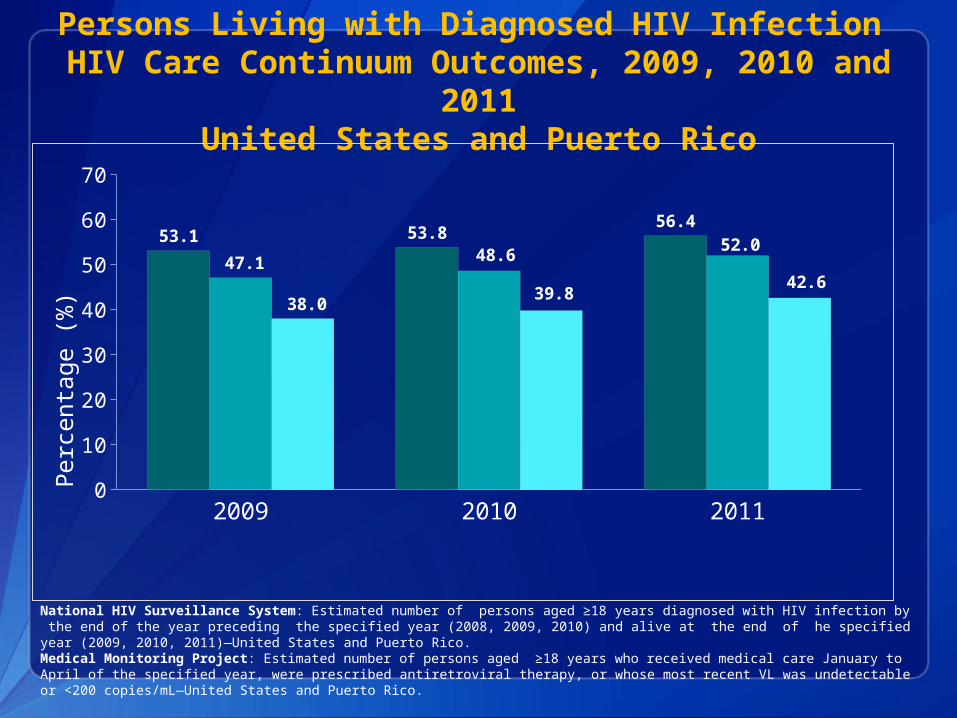
Persons Living with Diagnosed HIV Infection HIV Care Continuum Outcomes, 2009, 2010 and
2011United States and Puerto Rico
2009 2010 20110
10
20
30
40
50
60
70
53.1 53.8 56.4
47.1 48.6 52.0
38.0 39.8 42.6
Received HIV medical care* Prescribed ART Viral Suppression
Perc
enta
ge (%
)
National HIV Surveillance System: Estimated number of persons aged ≥18 years diagnosed with HIV infection by the end of the year preceding the specified year (2008, 2009, 2010) and alive at the end of he specified year (2009, 2010, 2011)—United States and Puerto Rico.Medical Monitoring Project: Estimated number of persons aged ≥18 years who received medical care January to April of the specified year, were prescribed antiretroviral therapy, or whose most recent VL was undetectable or <200 copies/mL—United States and Puerto Rico.
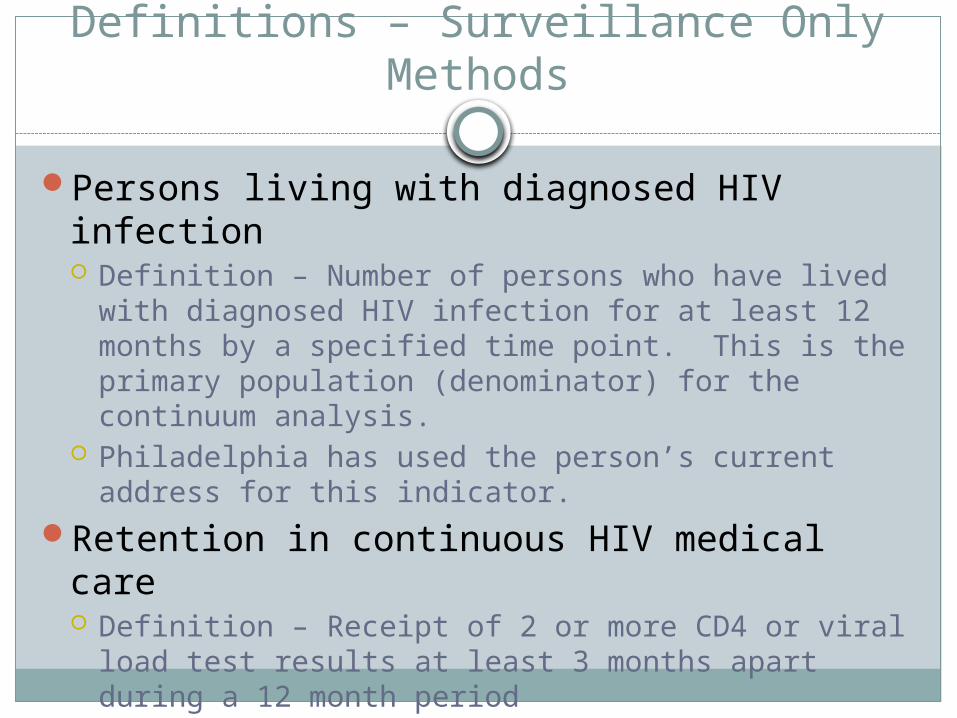
Definitions – Surveillance Only Methods
Persons living with diagnosed HIV infection Definition – Number of persons who have lived with
diagnosed HIV infection for at least 12 months by a specified time point. This is the primary population (denominator) for the continuum analysis.
Philadelphia has used the person’s current address for this indicator.
Retention in continuous HIV medical care Definition – Receipt of 2 or more CD4 or viral load test
results at least 3 months apart during a 12 month period
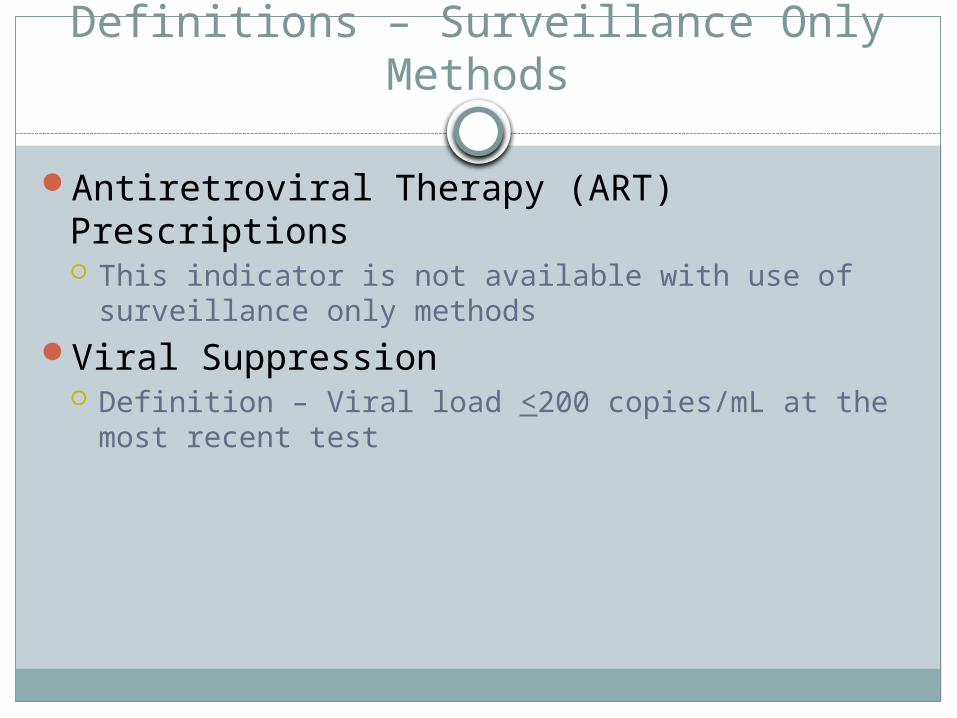
Definitions – Surveillance Only Methods
Antiretroviral Therapy (ART) Prescriptions This indicator is not available with use of surveillance
only methodsViral Suppression
Definition – Viral load <200 copies/mL at the most recent test
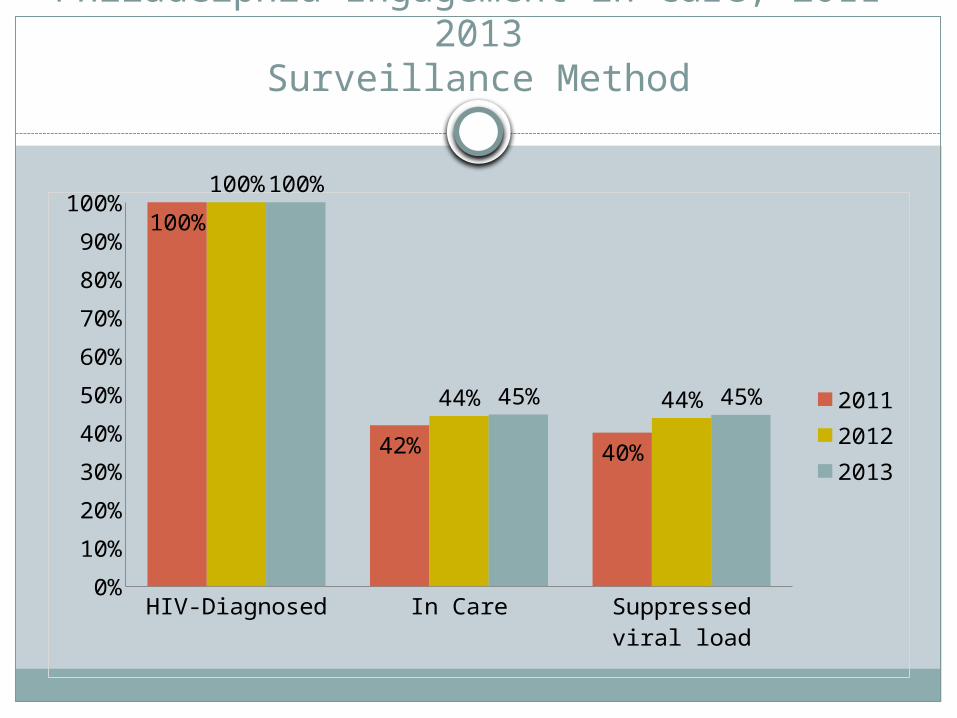
Philadelphia Engagement in Care, 2011-2013Surveillance Method
HIV-Diagnosed In Care Suppressed viral load
0%10%20%30%40%50%60%70%80%90%
100%100%
42% 40%
100%
44% 44%
100%
45% 45% 201120122013
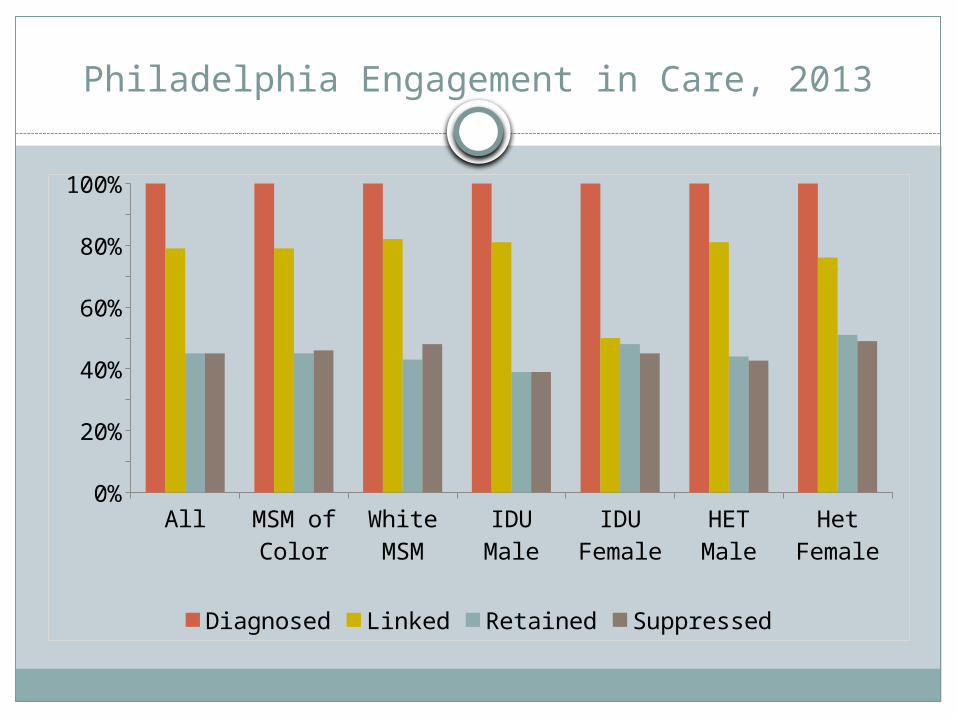
Philadelphia Engagement in Care, 2013
All MSM of Color
White MSM
IDU Male
IDU Female
HET Male
Het Female
0%10%20%30%40%50%60%70%80%90%
100%
Diagnosed Linked Retained Suppressed
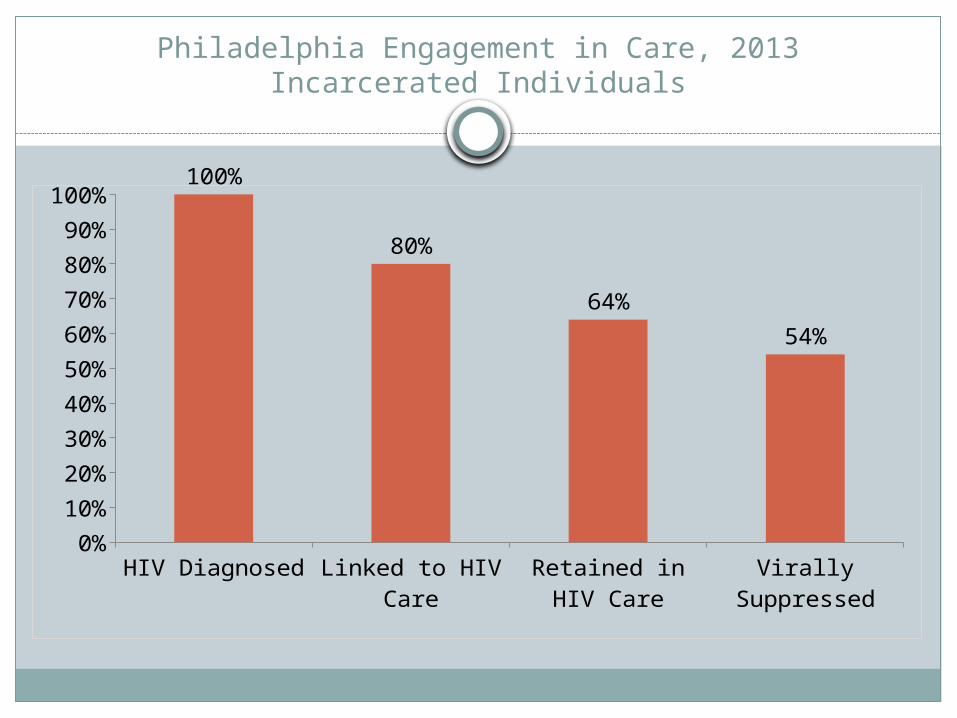
Philadelphia Engagement in Care, 2013Incarcerated Individuals
HIV Diagnosed Linked to HIV Care
Retained in HIV Care
Virally Suppressed
0%10%20%30%40%50%60%70%80%90%
100%100%
80%
64%54%
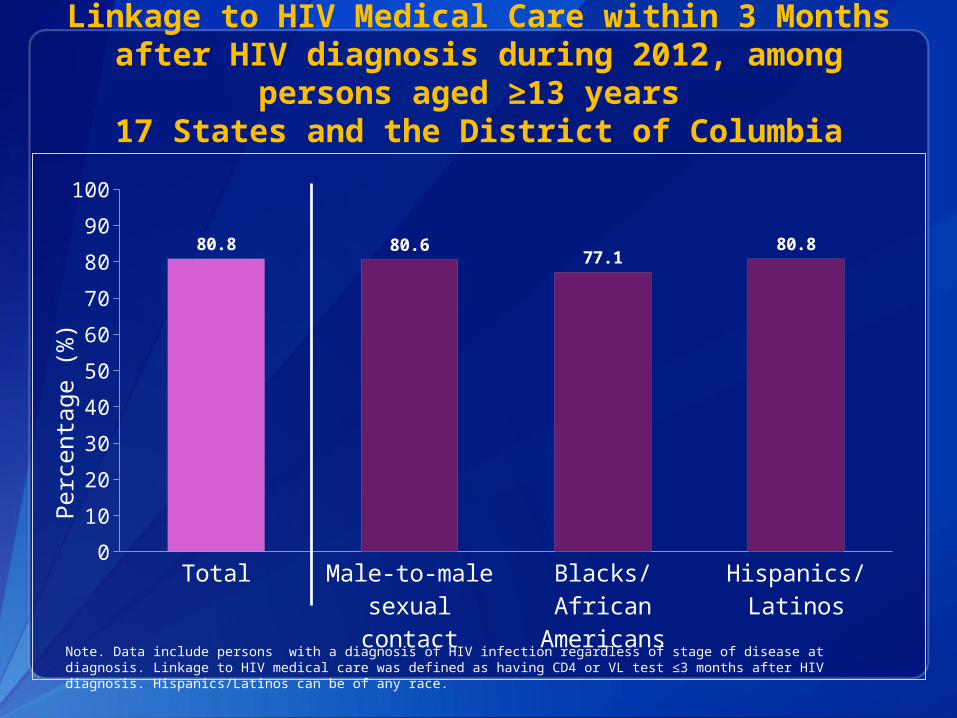
Linkage to HIV Medical Care within 3 Months after HIV diagnosis during 2012, among persons
aged ≥13 years 17 States and the District of Columbia
Total Male-to-male sexual contact
Blacks/African Americans
Hispanics/Latinos
0102030405060708090
100
80.8 80.6 77.1 80.8
Perc
enta
ge (%
)
Note. Data include persons with a diagnosis of HIV infection regardless of stage of disease at diagnosis. Linkage to HIV medical care was defined as having CD4 or VL test ≤3 months after HIV diagnosis. Hispanics/Latinos can be of any race.
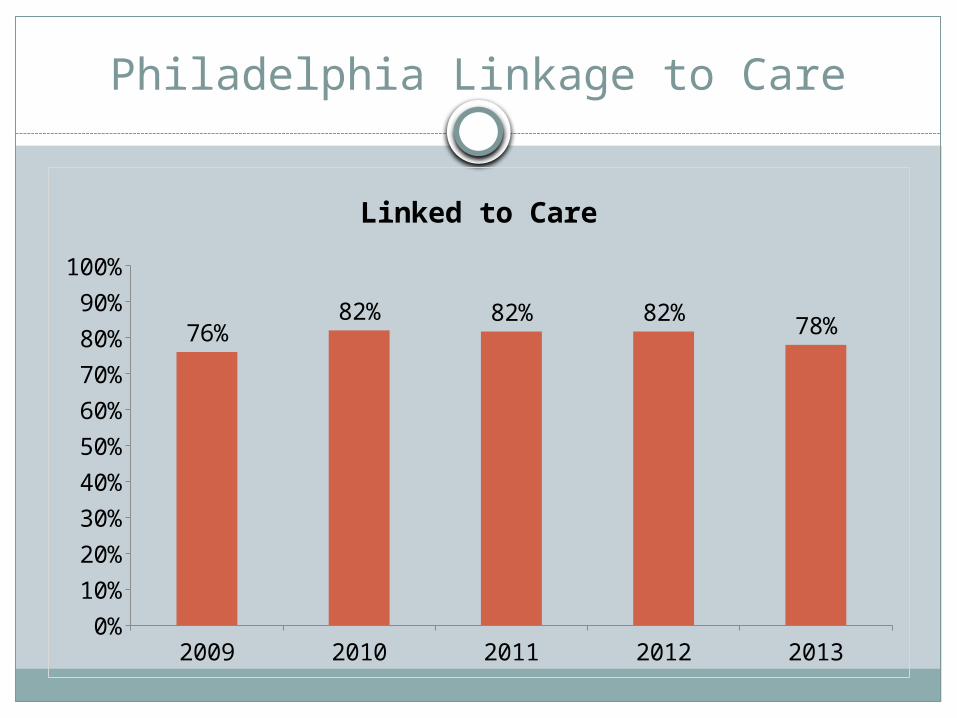
Philadelphia Linkage to Care
2009 2010 2011 2012 20130%
10%20%30%40%50%60%70%80%90%
100%
76%82% 82% 82% 78%
Linked to Care
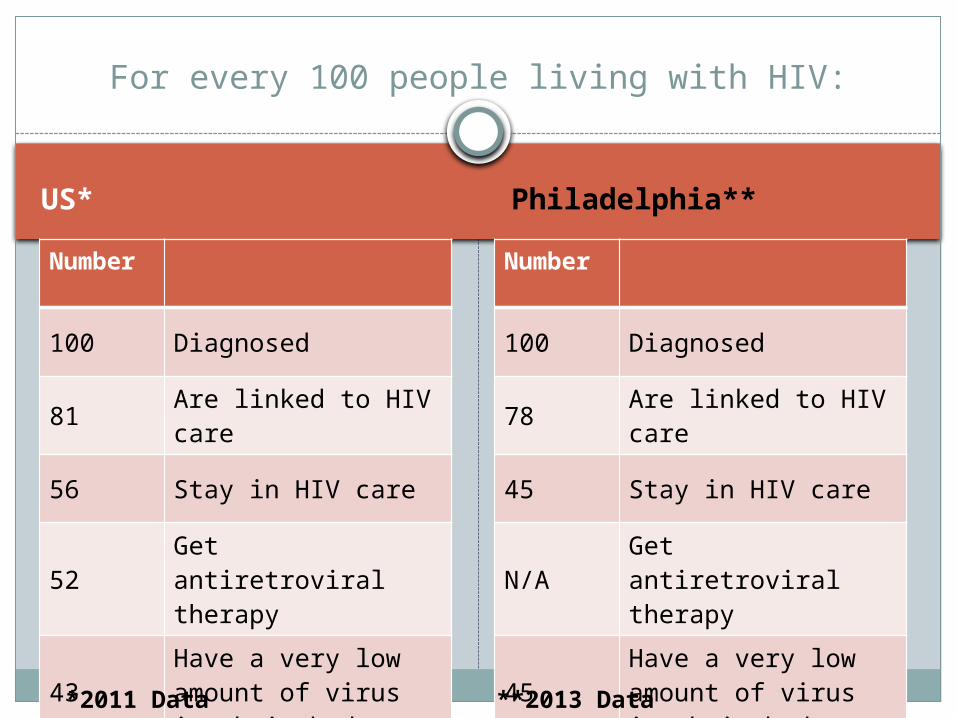
US* Philadelphia**
Number
100 Diagnosed
81 Are linked to HIV care
56 Stay in HIV care
52 Get antiretroviral therapy
43Have a very low amount of virus in their body
Number
100 Diagnosed
78 Are linked to HIV care
45 Stay in HIV care
N/A Get antiretroviral therapy
45Have a very low amount of virus in their body
For every 100 people living with HIV:
*2011 Data **2013 Data
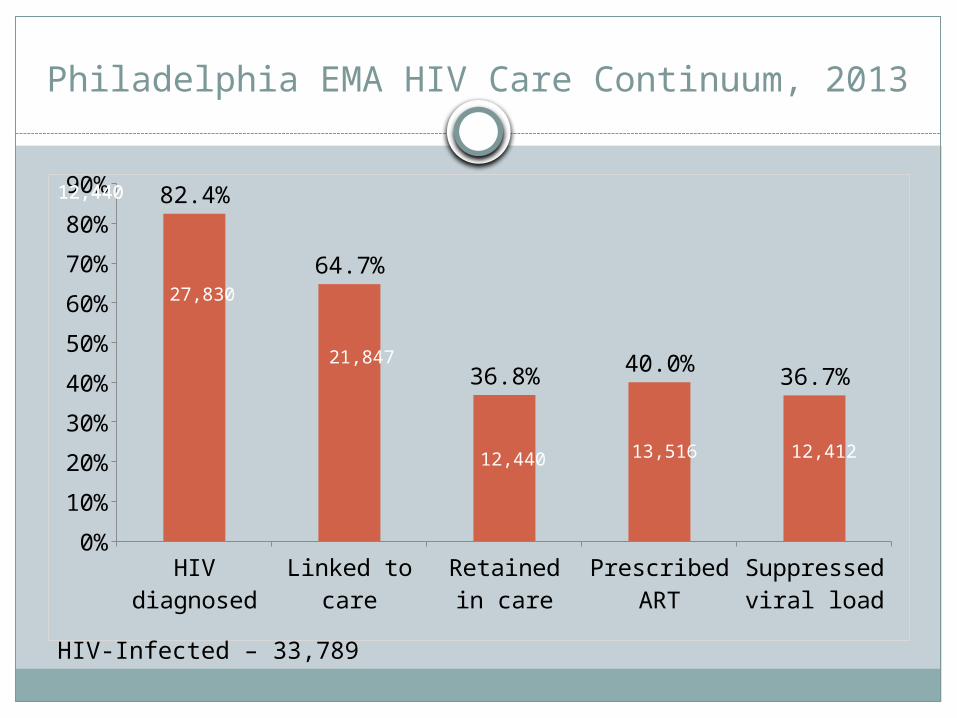
Philadelphia EMA HIV Care Continuum, 2013
HIV di-agnosed
Linked to care
Retained in care
Prescribed ART
Suppressed viral load
0%10%20%30%40%50%60%70%80%90% 82.4%
64.7%
36.8% 40.0% 36.7%
27,830
21,847
13,516 12,412
12,44012,440
12,440
HIV-Infected – 33,789
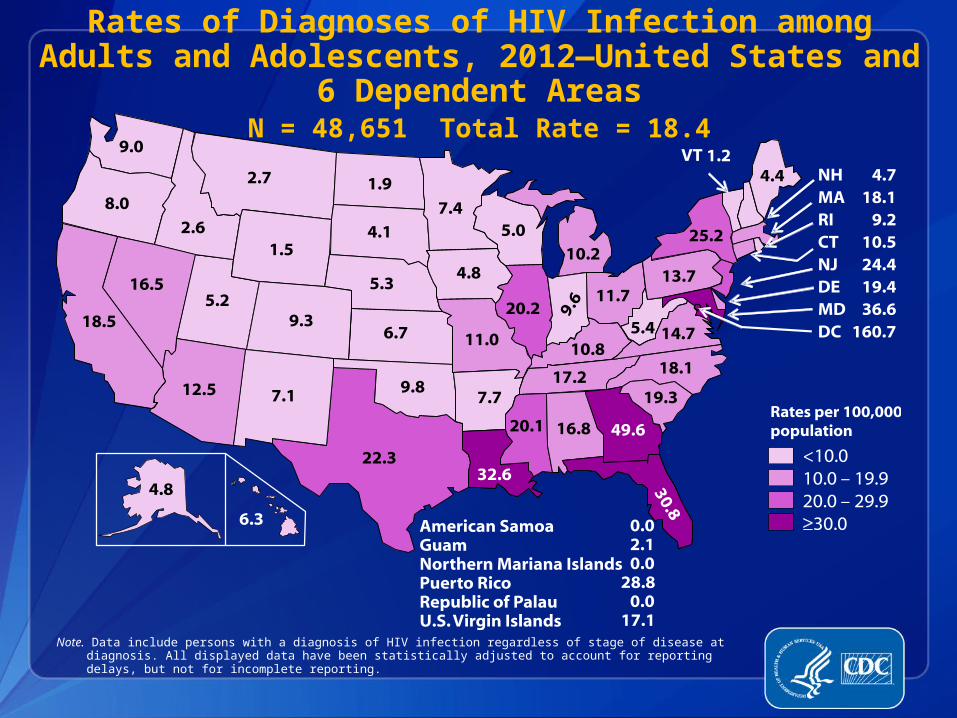
Rates of Diagnoses of HIV Infection among Adults and Adolescents, 2012—United States and
6 Dependent AreasN = 48,651 Total Rate = 18.4
Note. Data include persons with a diagnosis of HIV infection regardless of stage of disease at diagnosis. All displayed data have been statistically adjusted to account for reporting delays, but not for incomplete reporting.
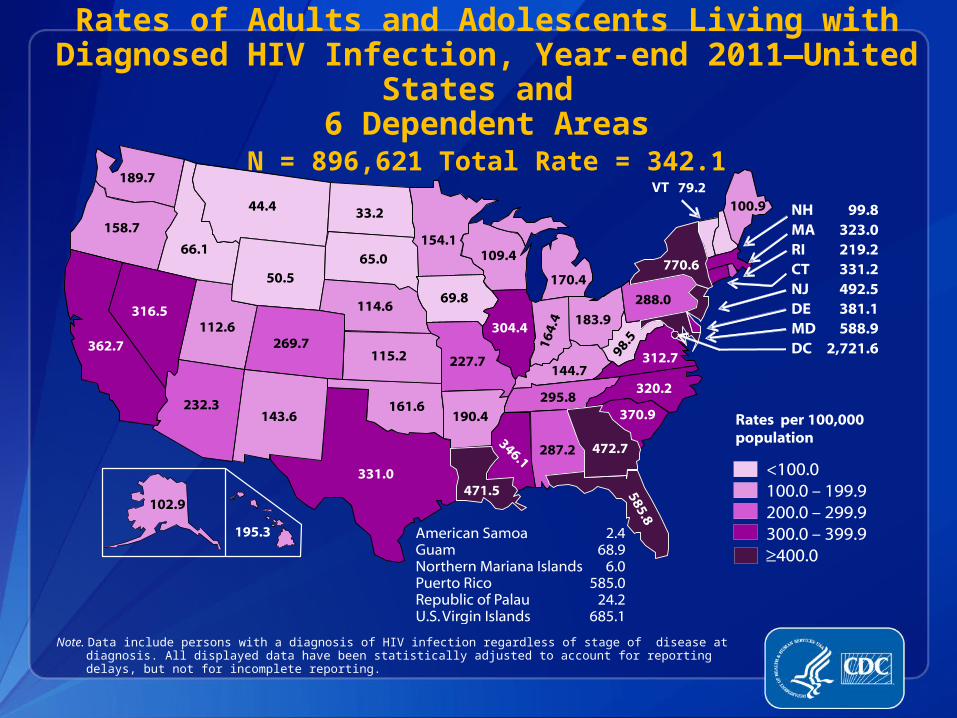
Rates of Adults and Adolescents Living with Diagnosed HIV Infection, Year-end 2011—United
States and 6 Dependent Areas
N = 896,621 Total Rate = 342.1
Note. Data include persons with a diagnosis of HIV infection regardless of stage of disease at diagnosis. All displayed data have been statistically adjusted to account for reporting delays, but not for incomplete reporting.
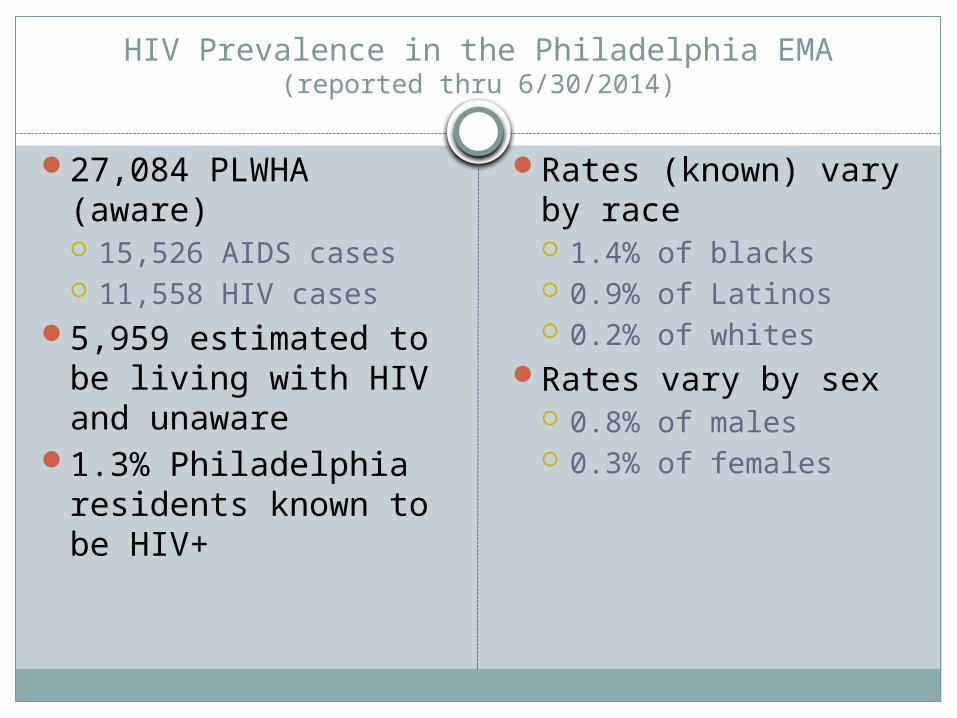
HIV Prevalence in the Philadelphia EMA(reported thru 6/30/2014)
27,084 PLWHA (aware) 15,526 AIDS cases 11,558 HIV cases
5,959 estimated to be living with HIV and unaware
1.3% Philadelphia residents known to be HIV+
Rates (known) vary by race 1.4% of blacks 0.9% of Latinos 0.2% of whites
Rates vary by sex 0.8% of males 0.3% of females
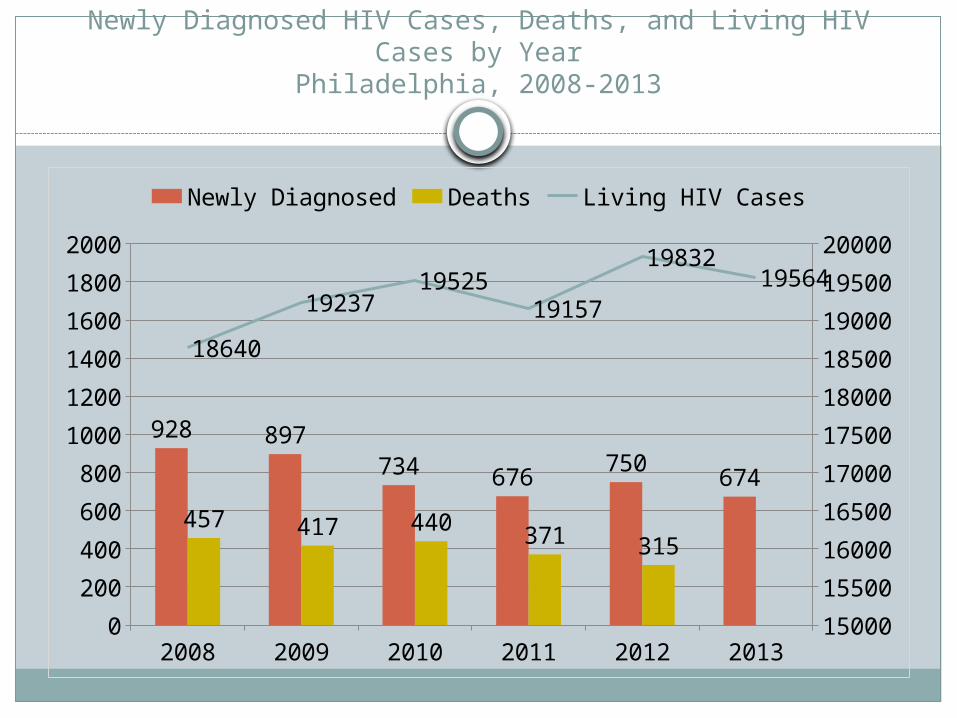
Newly Diagnosed HIV Cases, Deaths, and Living HIV Cases by Year
Philadelphia, 2008-2013
2008 2009 2010 2011 2012 20130
200400600800
100012001400160018002000
1500015500160001650017000175001800018500190001950020000
928 897734 676 750 674
457 417 440 371 315
18640
1923719525
19157
1983219564
Newly Diagnosed Deaths Living HIV Cases
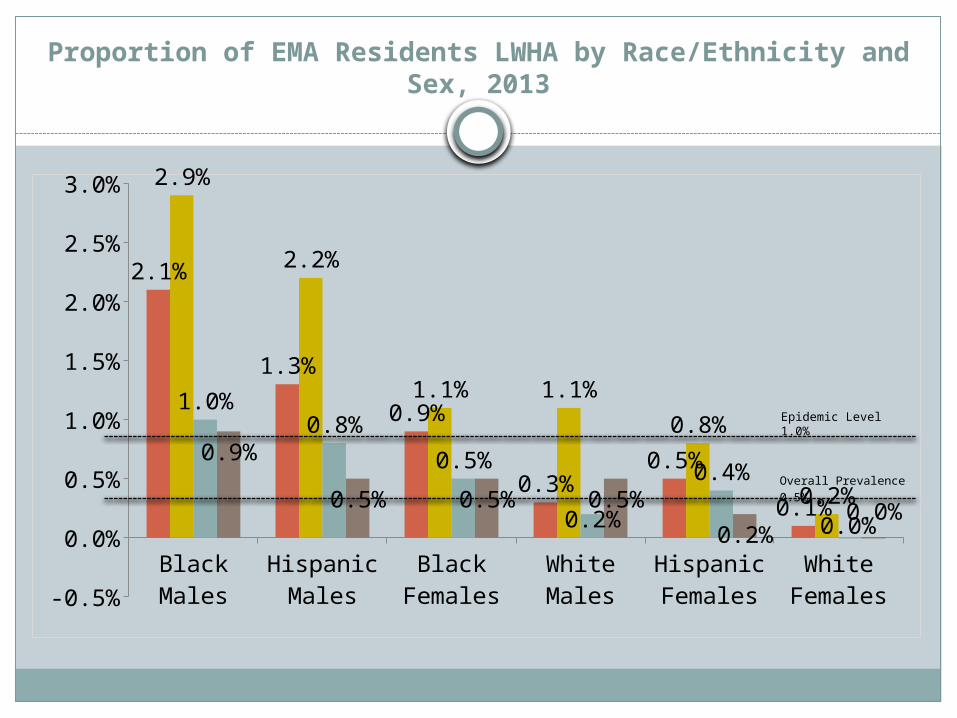
Proportion of EMA Residents LWHA by Race/Ethnicity and Sex, 2013
Black Males
Hispanic Males
Black Females
White Males
Hispanic Females
White Females-0.5%
0.0%
0.5%
1.0%
1.5%
2.0%
2.5%
3.0%
2.1%
1.3%
0.9%
0.3%0.5%
0.1%
2.9%
2.2%
1.1% 1.1%0.8%
0.2%
1.0%0.8%
0.5%
0.2%
0.4%
0.0%
0.9%
0.5% 0.5% 0.5%0.2%
0.0%
Overall Prevalence 0.5%
Epidemic Level 1.0%
20
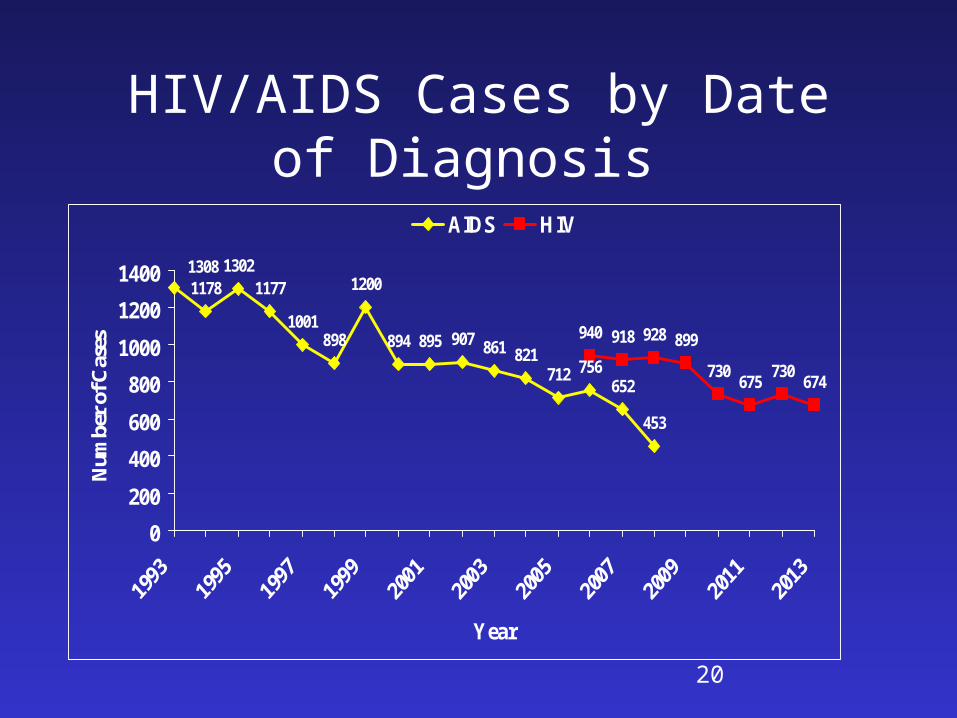
HIV/AIDS Cases by Date of Diagnosis
11781302
1177
1001898
1200
894 895 907 861 821712 756
652
453
940 918 928 899
730 675 730 674
1308
0200
400600
8001000
12001400
Year
Num
ber
of C
ases
AIDS HIV
21
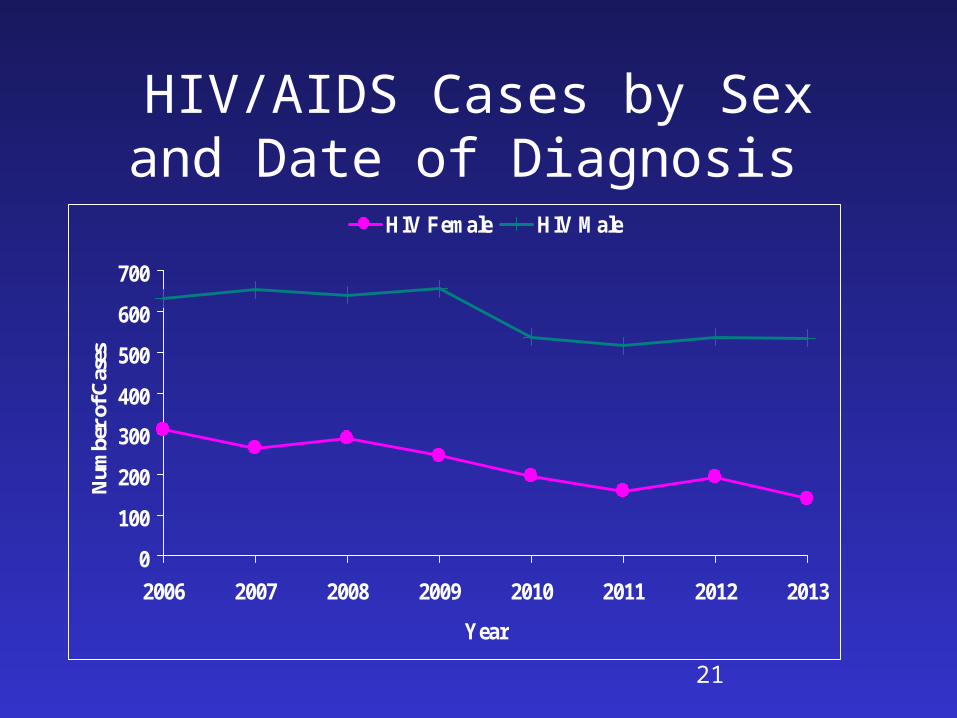
HIV/AIDS Cases by Sex and Date of Diagnosis
0
100
200
300
400
500
600
700
2006 2007 2008 2009 2010 2011 2012 2013
Year
Num
ber
of C
ases
HIV Female HIV Male
22
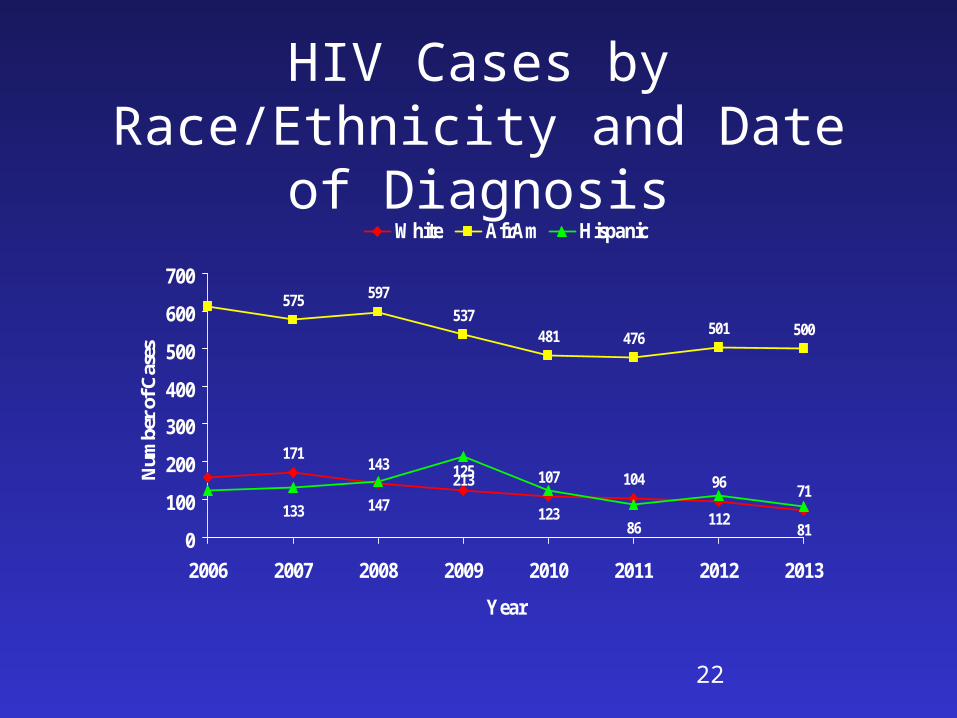
HIV Cases by Race/Ethnicity and Date of Diagnosis
171143 125 107 104 96 71
575 597537
481 476 501 500
133 147213
12386 112
810
100
200
300
400
500
600
700
2006 2007 2008 2009 2010 2011 2012 2013
Year
Num
ber
of C
ases
White AfrAm Hispanic
23
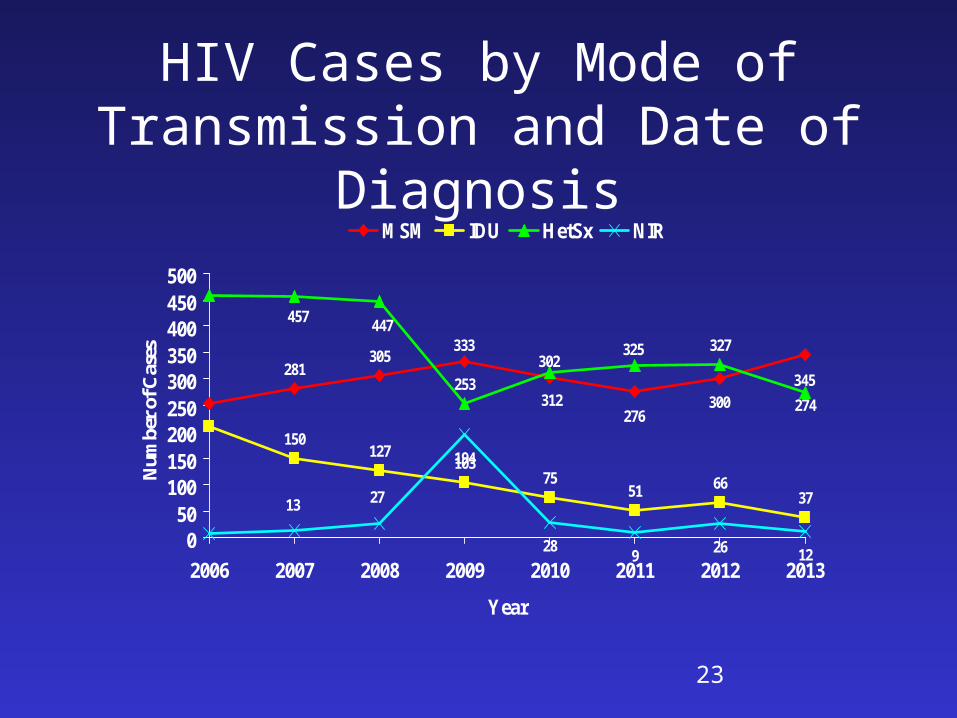
HIV Cases by Mode of Transmission and Date of Diagnosis
281305
150127
10375
51 6637
253
327
194
28 9 26 12
345300
276
302333
274
325
312
447457
2713
050
100150200250300350400450500
2006 2007 2008 2009 2010 2011 2012 2013
Year
Num
ber
of C
ases
MSM IDU HetSx NIR
24
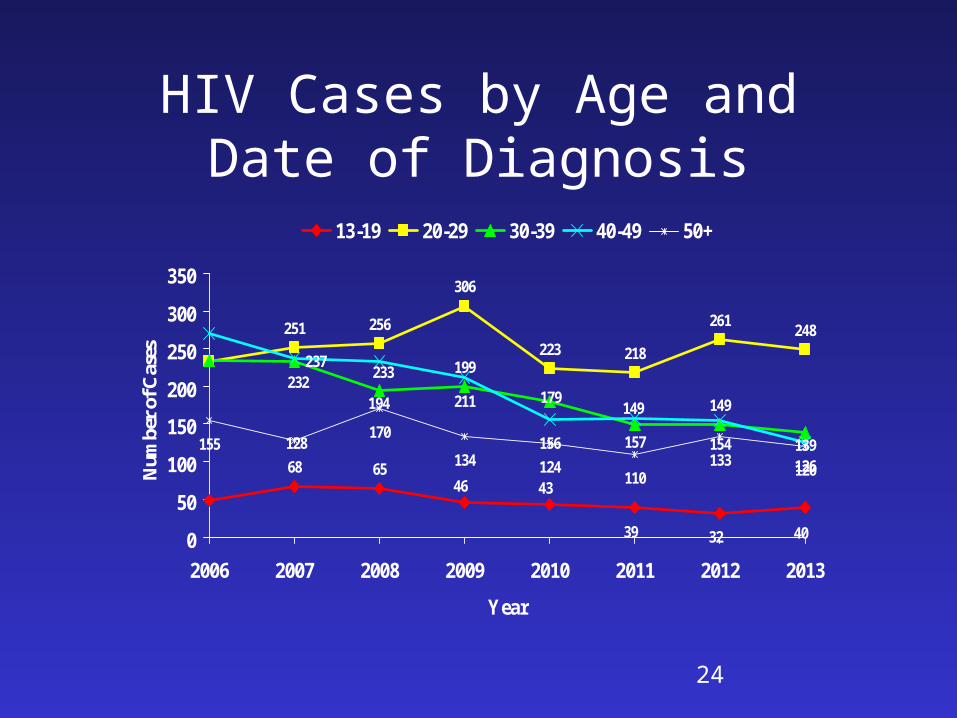
HIV Cases by Age and Date of Diagnosis
68 65
251 256
306
223 218
261 248
199
149211
156 157 154126
155170
134 124110
133 120
403239
4346
139
149179194
232 233237
128
0
50
100
150
200
250
300
350
2006 2007 2008 2009 2010 2011 2012 2013
Year
Num
ber
of C
ases
13-19 20-29 30-39 40-49 50+
27
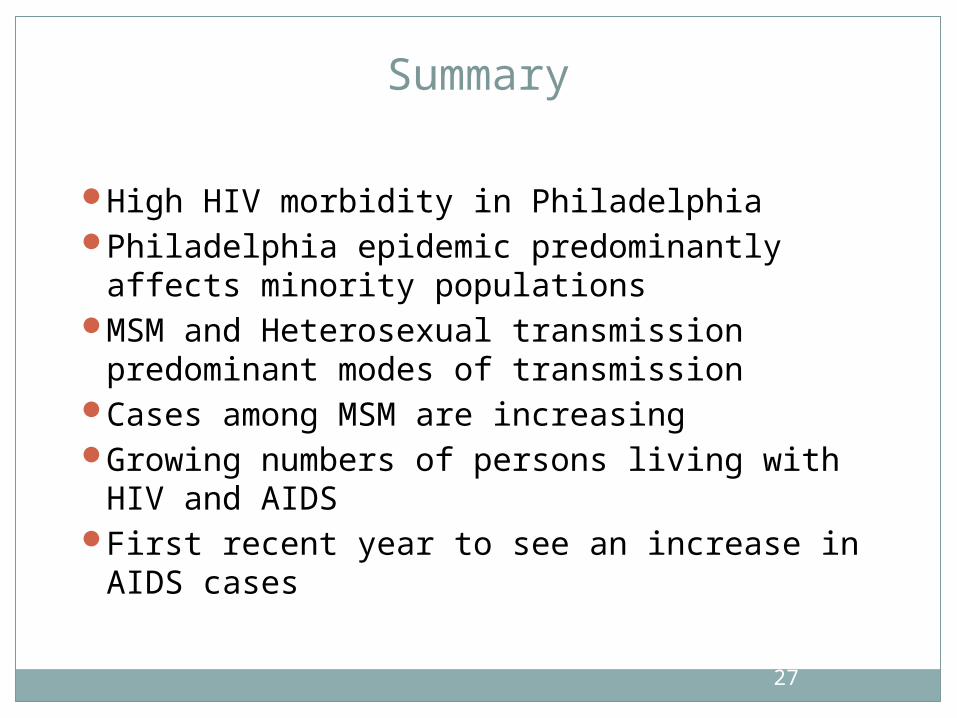
Summary
High HIV morbidity in PhiladelphiaPhiladelphia epidemic predominantly affects
minority populationsMSM and Heterosexual transmission
predominant modes of transmissionCases among MSM are increasingGrowing numbers of persons living with HIV
and AIDSFirst recent year to see an increase in AIDS
cases
Who is getting infected?
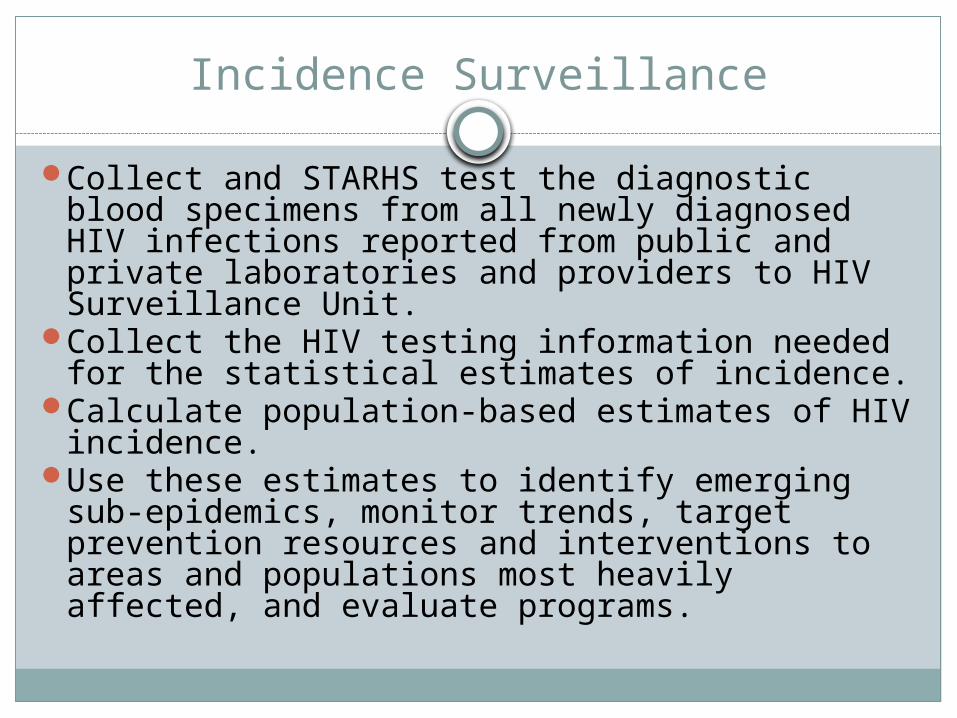
Incidence Surveillance
Collect and STARHS test the diagnostic blood specimens from all newly diagnosed HIV infections reported from public and private laboratories and providers to HIV Surveillance Unit.
Collect the HIV testing information needed for the statistical estimates of incidence.
Calculate population-based estimates of HIV incidence.
Use these estimates to identify emerging sub-epidemics, monitor trends, target prevention resources and interventions to areas and populations most heavily affected, and evaluate programs.
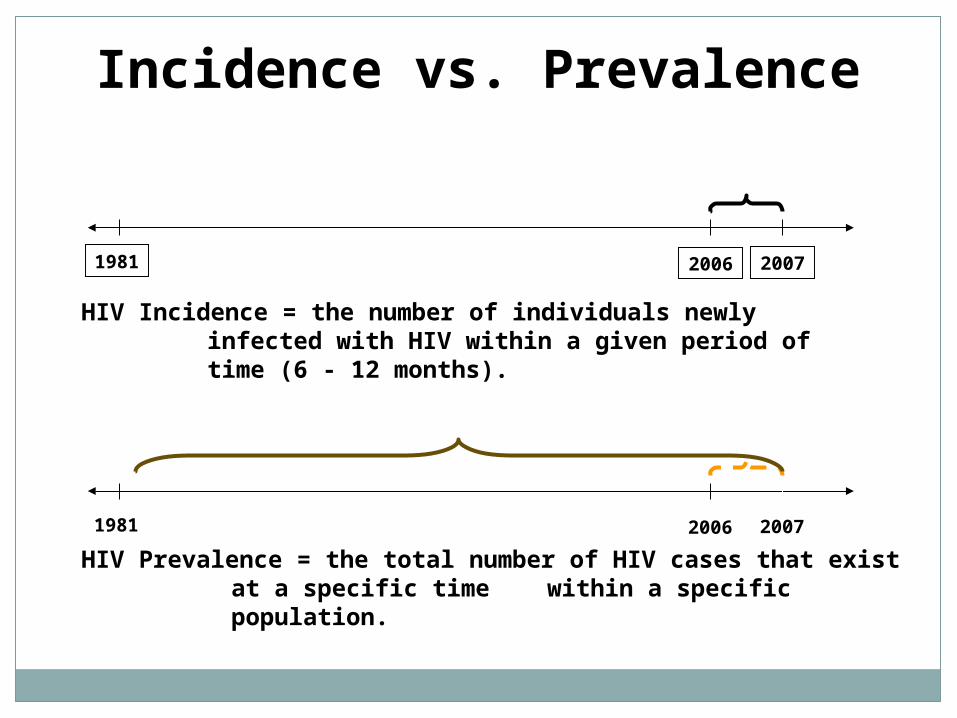
Incidence vs. Prevalence
HIV Prevalence = the total number of HIV cases that exist at a specific time within a specific population.
HIV Incidence = the number of individuals newly infected with HIV within a given period of time (6 - 12 months).
20061981 2007
20061981 2007
Serologic
Testing
Algorithm for
Recent
HIV
Seroconversion
What is STARHS?
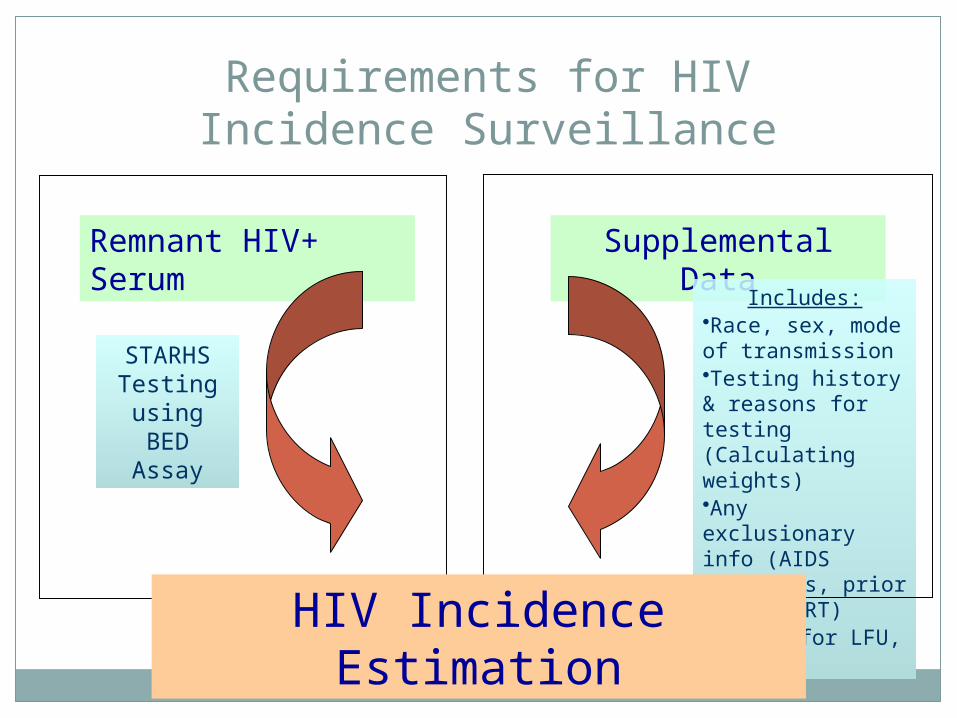
Remnant HIV+ Serum
Supplemental Data
STARHS Testing using BED
Assay
Includes:•Race, sex, mode of transmission•Testing history & reasons for testing (Calculating weights)•Any exclusionary info (AIDS diagnosis, prior recent ART)•Adjust for LFU, QNSHIV Incidence Estimation
Requirements for HIV Incidence Surveillance
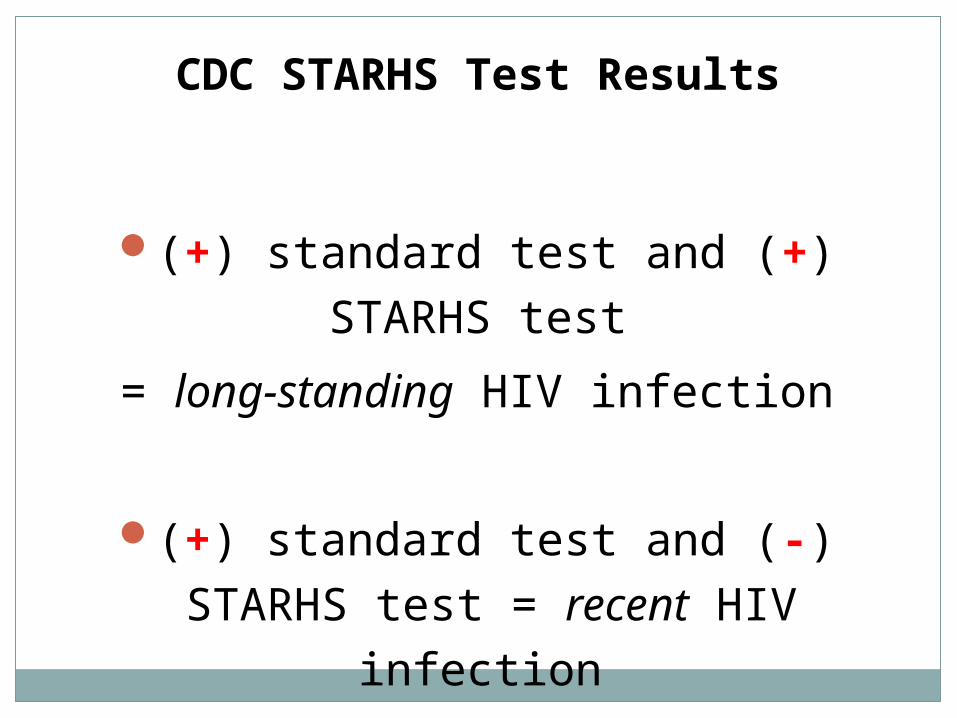
CDC STARHS Test Results
(+) standard test and (+) STARHS test
= long-standing HIV infection
(+) standard test and (-) STARHS test = recent HIV infection
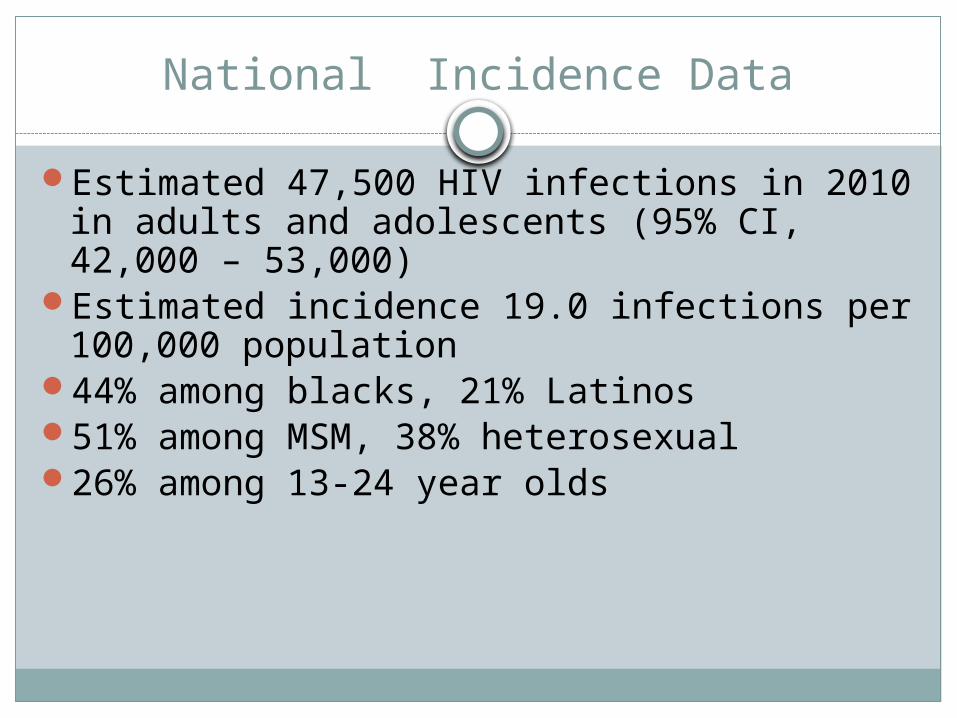
National Incidence Data
Estimated 47,500 HIV infections in 2010 in adults and adolescents (95% CI, 42,000 – 53,000)
Estimated incidence 19.0 infections per 100,000 population
44% among blacks, 21% Latinos51% among MSM, 38% heterosexual26% among 13-24 year olds
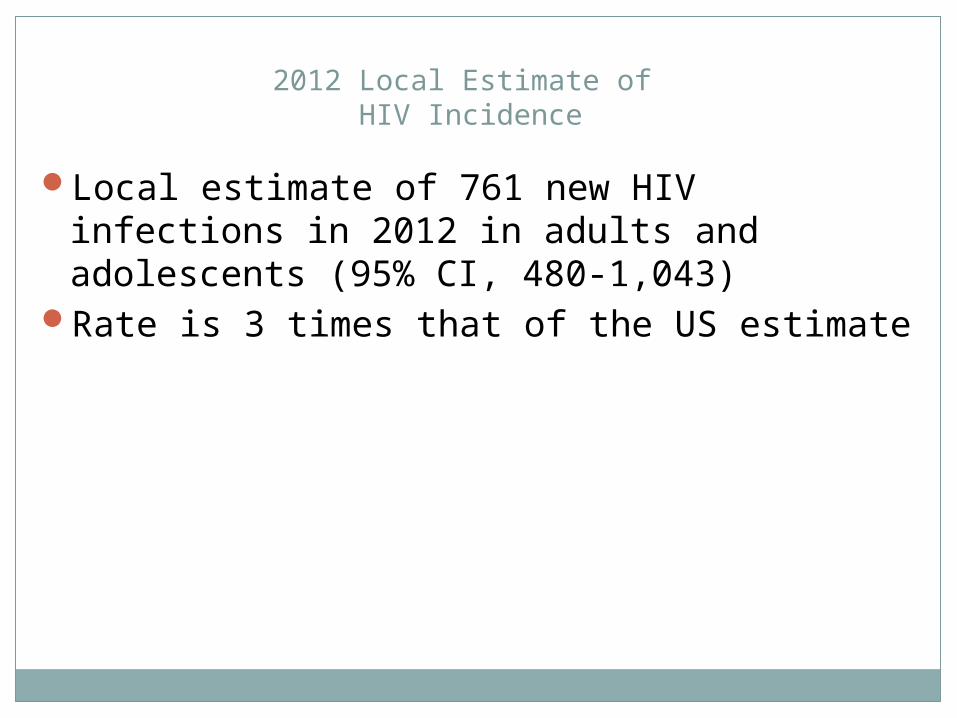
2012 Local Estimate of HIV Incidence
Local estimate of 761 new HIV infections in 2012 in adults and adolescents (95% CI, 480-1,043)
Rate is 3 times that of the US estimate
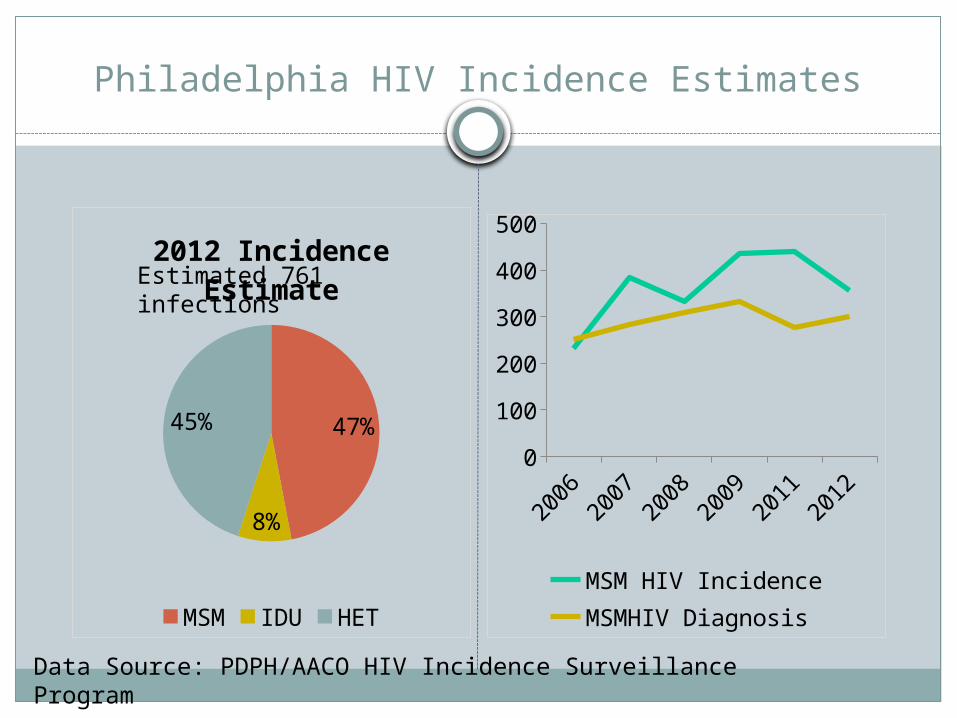
Philadelphia HIV Incidence Estimates
47%
8%
45%
2012 Incidence Estimate
MSM IDU HET
2006
2007
2008
2009
2011
2012
0
100
200
300
400
500
MSM HIV IncidenceMSMHIV Diagnosis
Estimated 761 infections
Data Source: PDPH/AACO HIV Incidence Surveillance Program
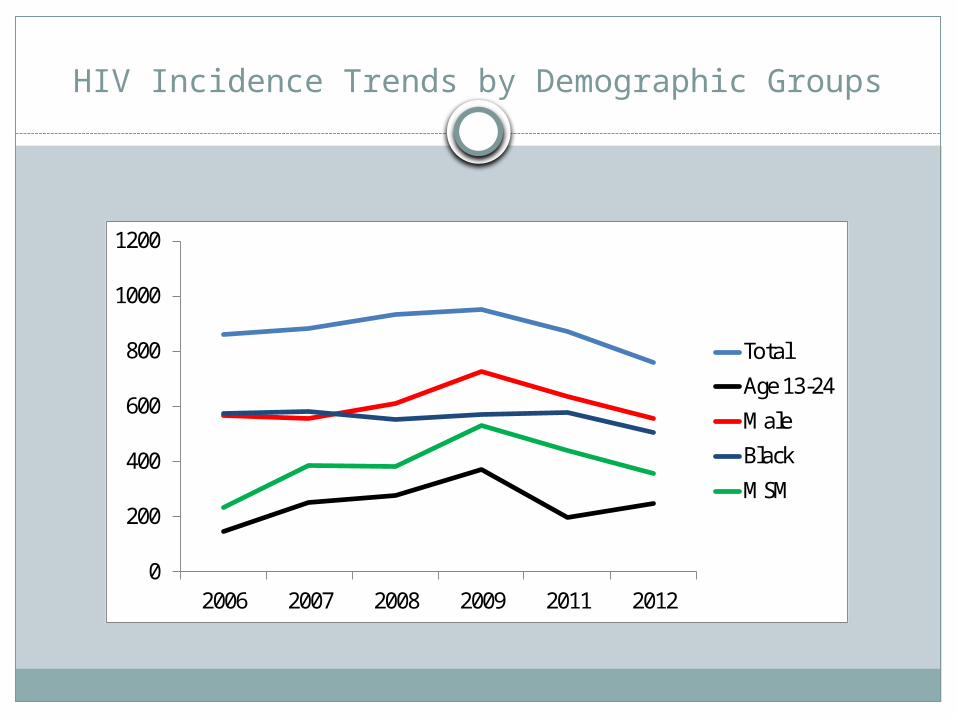
HIV Incidence Trends by Demographic Groups
0
200
400
600
800
1000
1200
2006 2007 2008 2009 2011 2012
TotalAge 13-24MaleBlackMSM
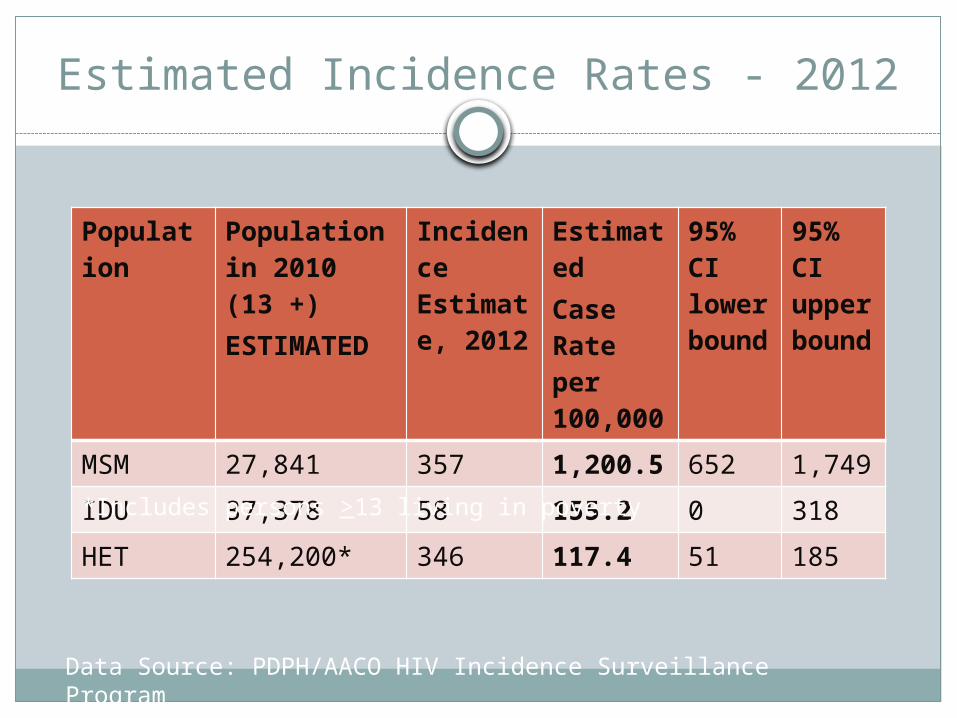
Estimated Incidence Rates - 2012
Population Population in 2010 (13 +)ESTIMATED
Incidence Estimate, 2012
EstimatedCase Rate per 100,000
95% CI lower bound
95% CI upper bound
MSM 27,841 357 1,200.5 652 1,749IDU 37,378 58 155.2 0 318HET 254,200* 346 117.4 51 185
*Includes persons >13 living in poverty
Data Source: PDPH/AACO HIV Incidence Surveillance Program
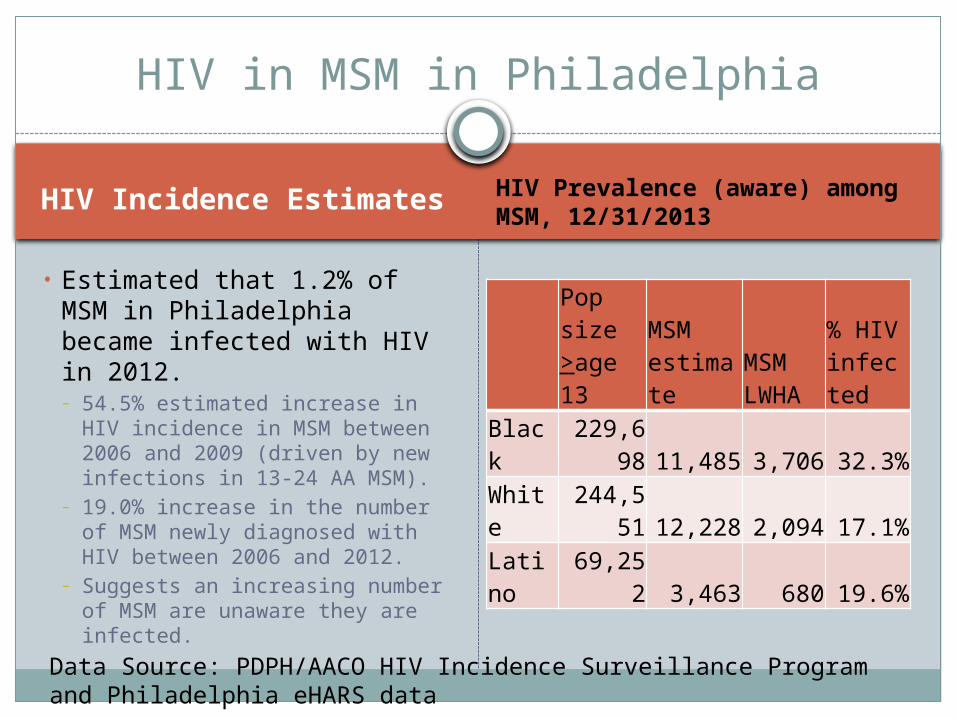
HIV in MSM in Philadelphia
HIV Incidence Estimates
• Estimated that 1.2% of MSM in Philadelphia became infected with HIV in 2012.– 54.5% estimated increase in HIV
incidence in MSM between 2006 and 2009 (driven by new infections in 13-24 AA MSM).
– 19.0% increase in the number of MSM newly diagnosed with HIV between 2006 and 2012.
– Suggests an increasing number of MSM are unaware they are infected.
HIV Prevalence (aware) among MSM, 12/31/2013
Pop size >age 13
MSM estimate
MSM LWHA
% HIV infected
Black 229,698 11,485 3,706 32.3%
White 244,551 12,228 2,094 17.1%
Latino 69,252 3,463 680 19.6%
Data Source: PDPH/AACO HIV Incidence Surveillance Program and Philadelphia eHARS data
Incidence Summary
Includes people unaware of their status. Overall, HIV incidence in Philadelphia is stable
Trends - ???
Who is unaware?
Concurrent HIV/AIDS
Definition – An AIDS diagnosis within 90 days of an HIV diagnosis
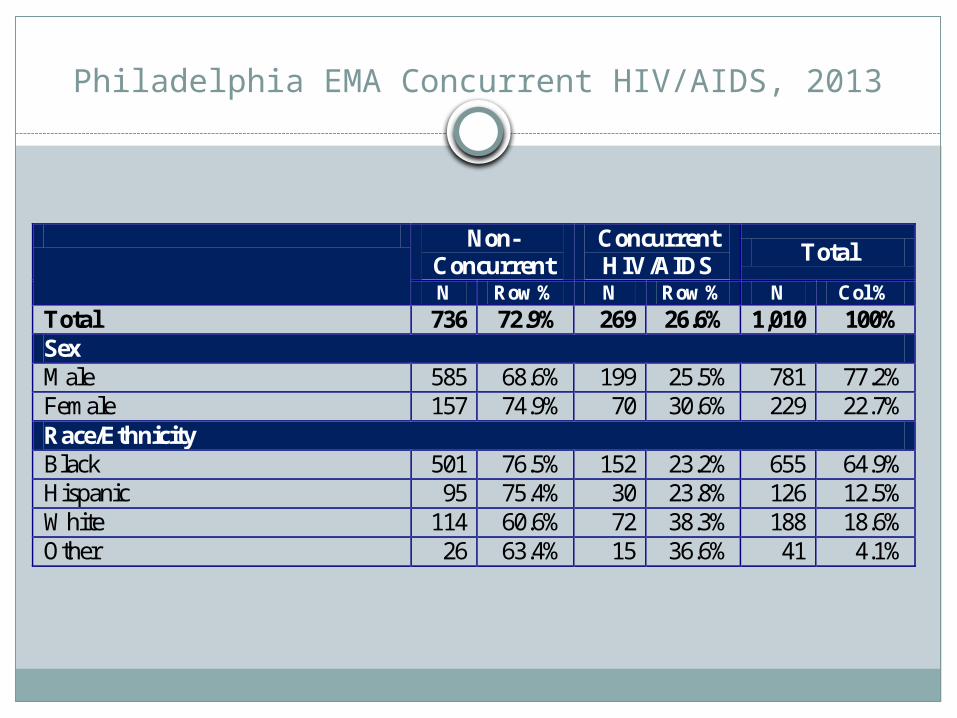
Philadelphia EMA Concurrent HIV/AIDS, 2013
Non-Concurrent
Concurrent HIV/AIDS Total
N Row % N Row % N Col % Total 736 72.9% 269 26.6% 1,010 100% Sex Male 585 68.6% 199 25.5% 781 77.2% Female 157 74.9% 70 30.6% 229 22.7% Race/Ethnicity Black 501 76.5% 152 23.2% 655 64.9% Hispanic 95 75.4% 30 23.8% 126 12.5% White 114 60.6% 72 38.3% 188 18.6% Other 26 63.4% 15 36.6% 41 4.1%
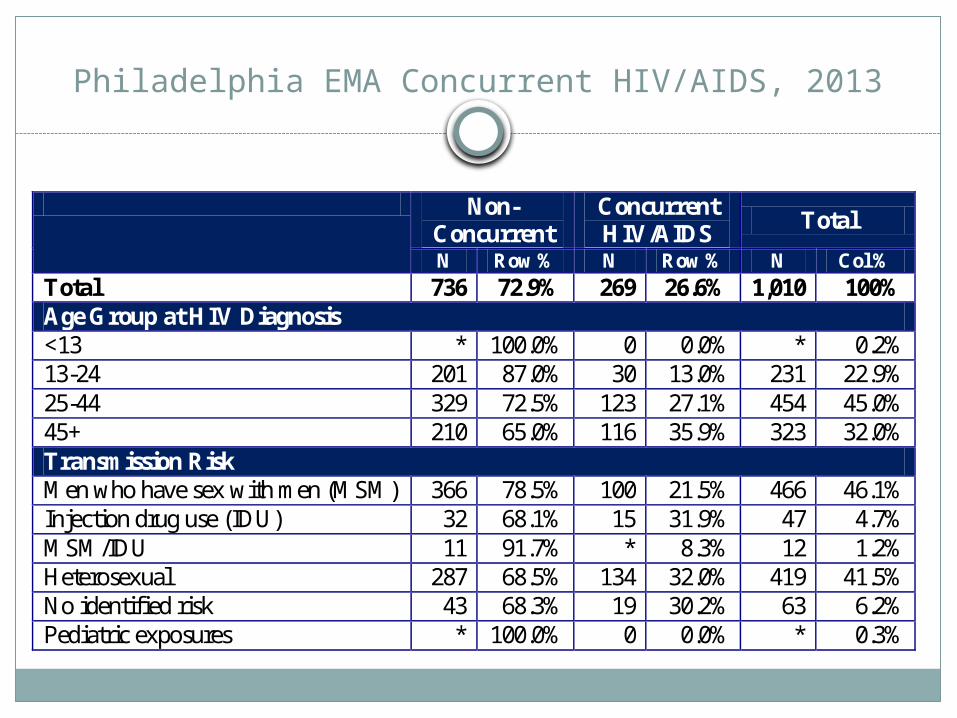
Philadelphia EMA Concurrent HIV/AIDS, 2013
Non-Concurrent
Concurrent HIV/AIDS Total
N Row % N Row % N Col % Total 736 72.9% 269 26.6% 1,010 100% Age Group at HIV Diagnosis <13 * 100.0% 0 0.0% * 0.2% 13-24 201 87.0% 30 13.0% 231 22.9% 25-44 329 72.5% 123 27.1% 454 45.0% 45+ 210 65.0% 116 35.9% 323 32.0% Transmission Risk Men who have sex with men (MSM) 366 78.5% 100 21.5% 466 46.1% Injection drug use (IDU) 32 68.1% 15 31.9% 47 4.7% MSM/IDU 11 91.7% * 8.3% 12 1.2% Heterosexual 287 68.5% 134 32.0% 419 41.5% No identified risk 43 68.3% 19 30.2% 63 6.2% Pediatric exposures * 100.0% 0 0.0% * 0.3%
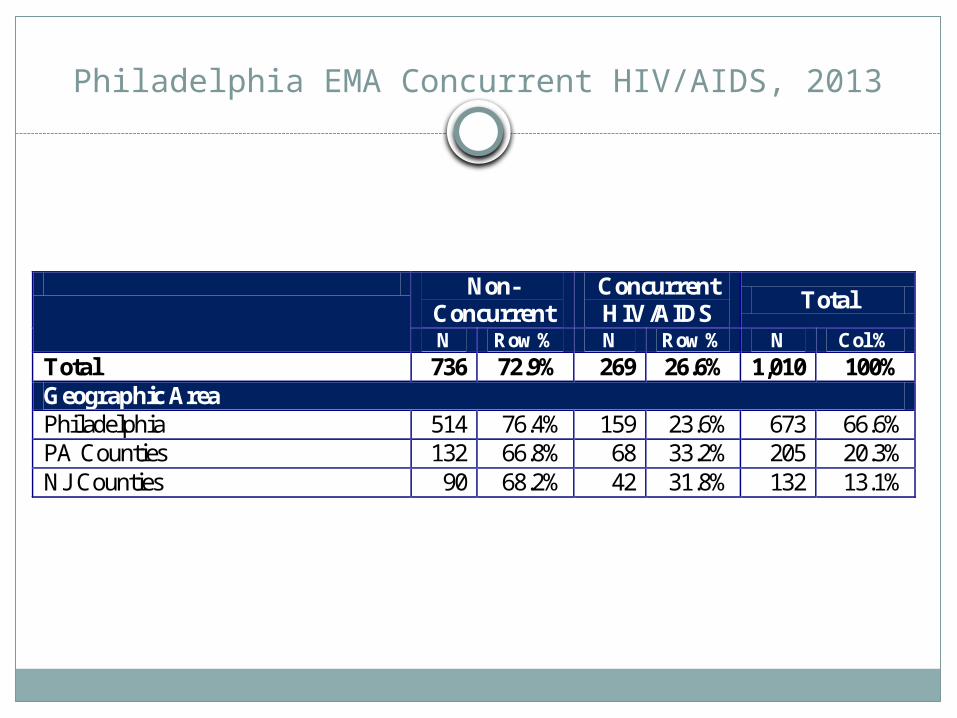
Philadelphia EMA Concurrent HIV/AIDS, 2013
Non-Concurrent
Concurrent HIV/AIDS Total
N Row % N Row % N Col % Total 736 72.9% 269 26.6% 1,010 100% Geographic Area Philadelphia 514 76.4% 159 23.6% 673 66.6% PA Counties 132 66.8% 68 33.2% 205 20.3% NJ Counties 90 68.2% 42 31.8% 132 13.1%
Concurrent HIV/AIDS Summary
26.6% of EMA residents diagnosed with HIV in 2013 had an AIDS diagnosis within 3 months
Females, whites, persons >25 years of age (but much higher among those 45+), IDU, heterosexuals, and persons living in the suburban counties are more likely to be diagnosed with concurrent HIV/AIDS
Significant decline in concurrent HIV/AIDS in 2013 in Philadelphia compared to 2012
Retention in care
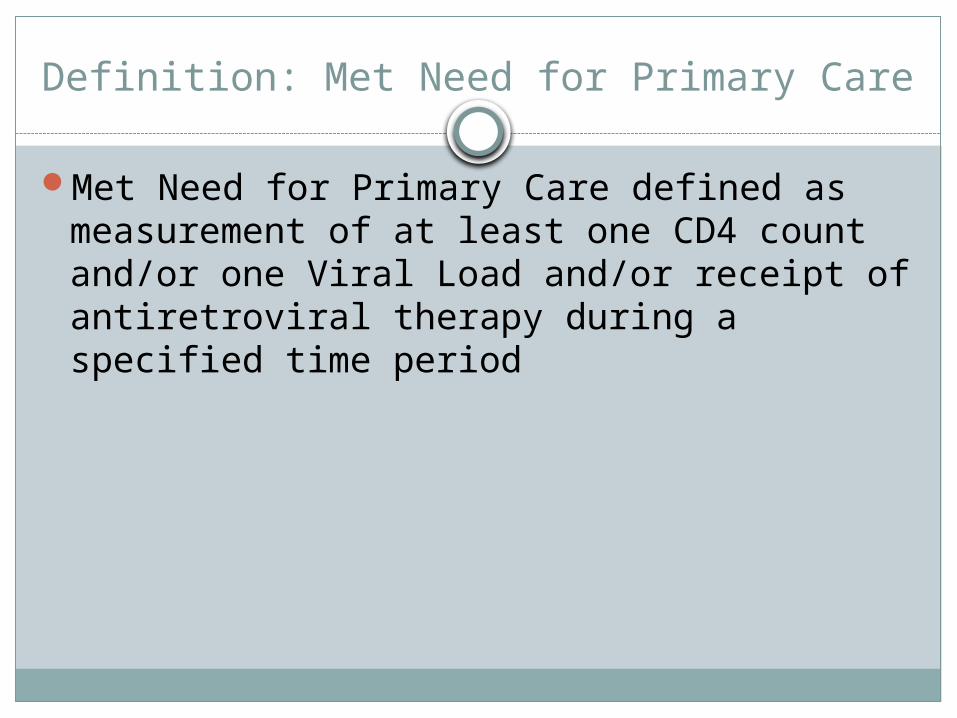
Definition: Met Need for Primary Care
Met Need for Primary Care defined as measurement of at least one CD4 count and/or one Viral Load and/or receipt of antiretroviral therapy during a specified time period
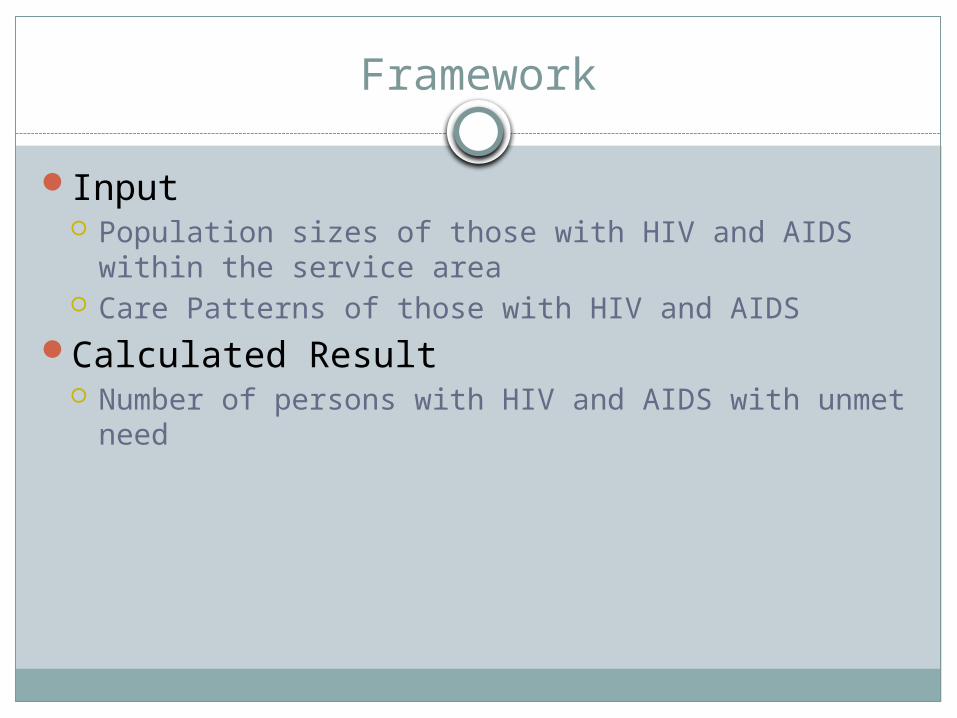
Framework
Input Population sizes of those with HIV and AIDS within
the service area Care Patterns of those with HIV and AIDS
Calculated Result Number of persons with HIV and AIDS with unmet
need
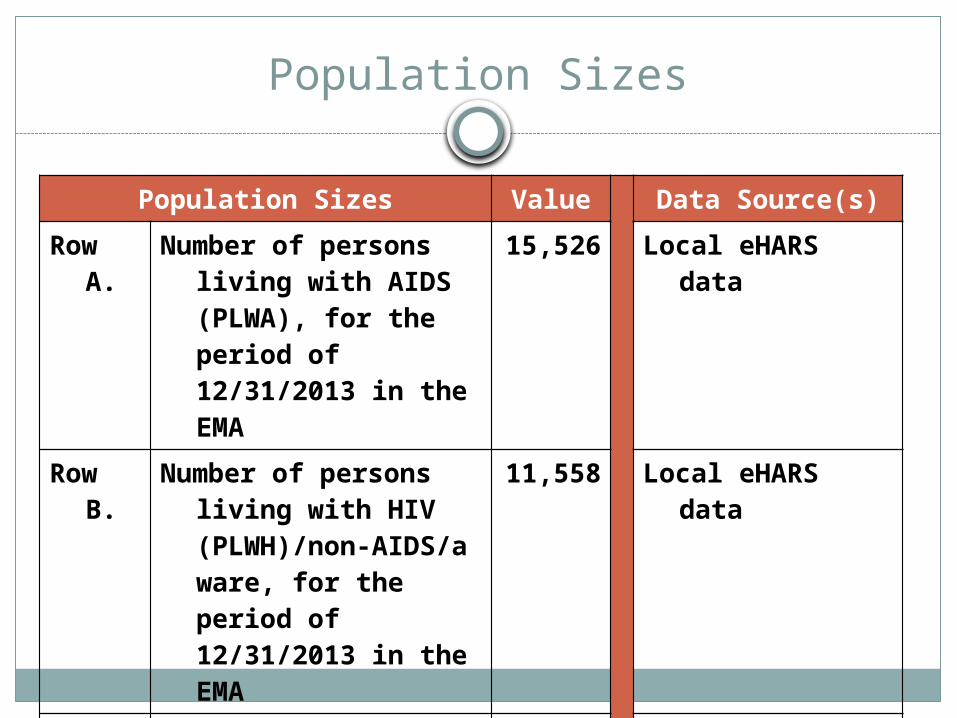
Population Sizes Value
Data Source(s)Row A. Number of persons living
with AIDS (PLWA), for the period of 12/31/2013 in the EMA
15,526 Local eHARS data
Row B. Number of persons living with HIV (PLWH)/non-AIDS/aware, for the period of 12/31/2013 in the EMA
11,558 Local eHARS data
Row C. Total number of HIV+/aware for the period of 12/31/2013 in the EMA
27,084 Local eHARS data
Population Sizes
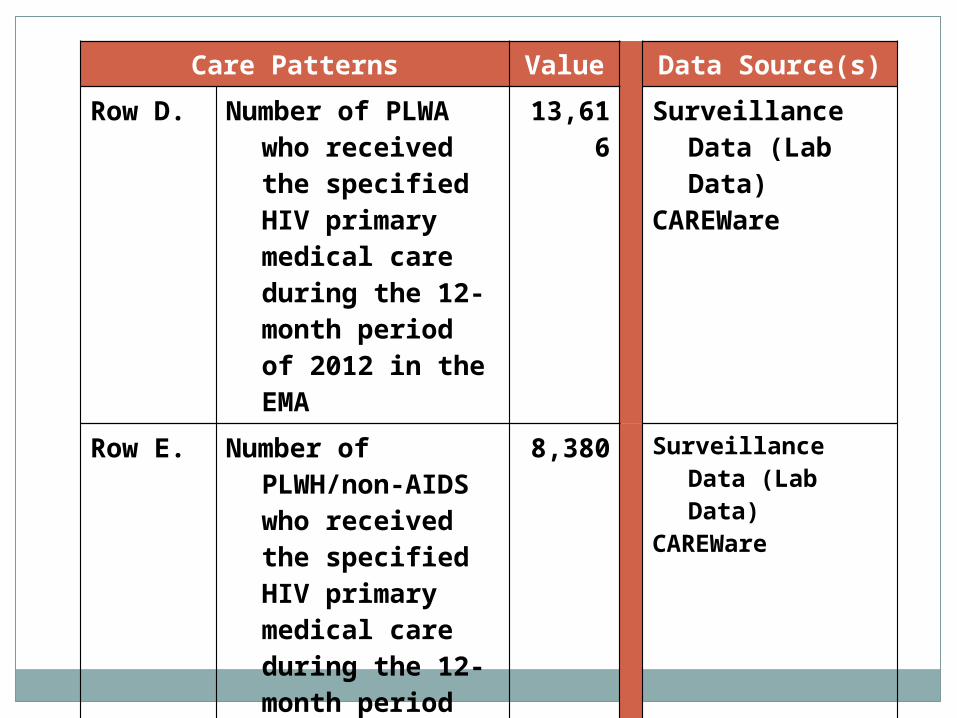
Care Patterns Value Data Source(s)Row D. Number of PLWA
who received the specified HIV primary medical care during the 12-month period of 2012 in the EMA
13,616 Surveillance Data (Lab Data)
CAREWare
Row E. Number of PLWH/non-AIDS who received the specified HIV primary medical care during the 12-month period of 2012 in the EMA
8,380 Surveillance Data (Lab Data)
CAREWare
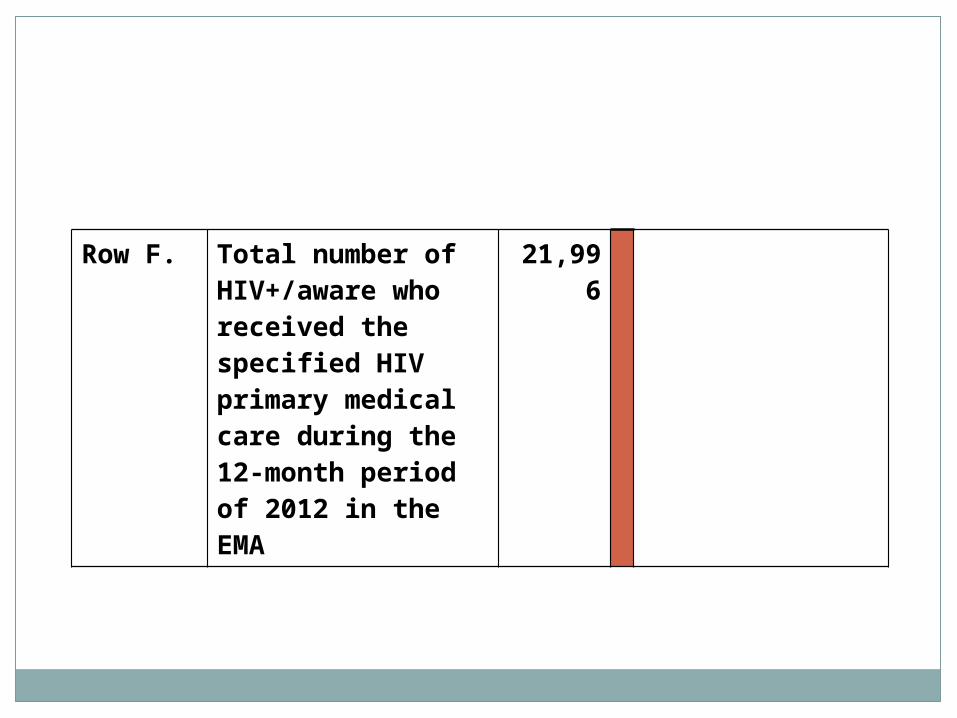
Row F. Total number of HIV+/aware who received the specified HIV primary medical care during the 12-month period of 2012 in the EMA
21,996
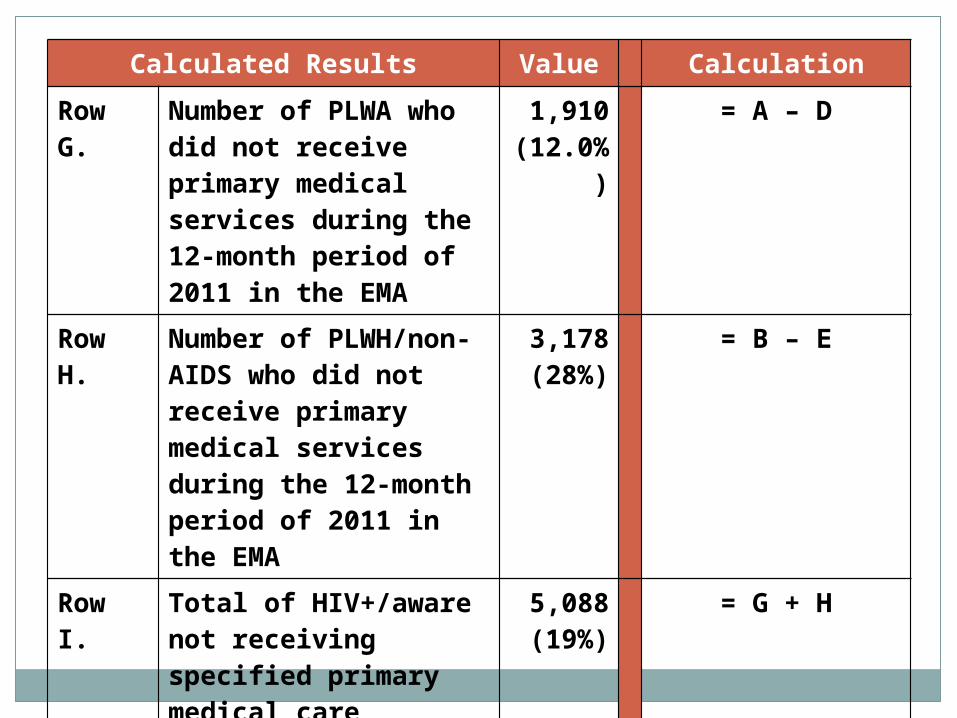
Calculated Results Value CalculationRow G. Number of PLWA who
did not receive primary medical services during the 12-month period of 2011 in the EMA
1,910(12.0%)
= A – D
Row H. Number of PLWH/non-AIDS who did not receive primary medical services during the 12-month period of 2011 in the EMA
3,178(28%)
= B – E
Row I. Total of HIV+/aware not receiving specified primary medical care services (quantified estimate of unmet need in the EMA
5,088(19%)
= G + H
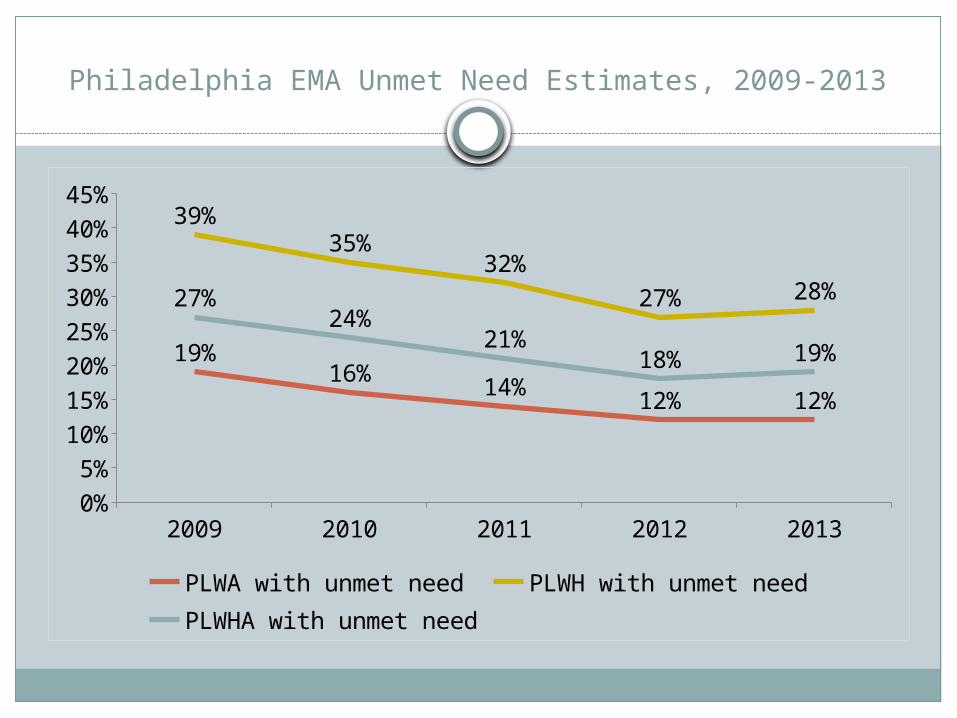
Philadelphia EMA Unmet Need Estimates, 2009-2013
2009 2010 2011 2012 20130%5%
10%15%20%25%30%35%40%45%
19%16% 14% 12% 12%
39%35%
32%27% 28%27%
24%21%
18% 19%
PLWA with unmet need PLWH with unmet needPLWHA with unmet need
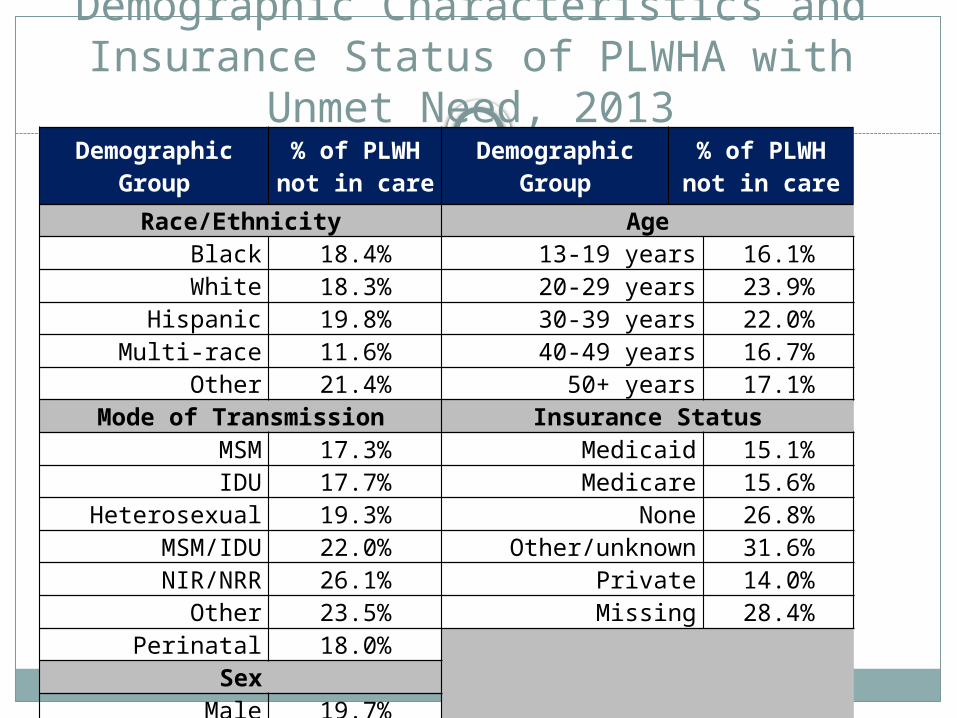
Demographic Characteristics and Insurance Status of PLWHA with
Unmet Need, 2013Demographic Group % of PLWH
not in care Demographic Group % of PLWHnot in care
Race/Ethnicity AgeBlack 18.4% 13-19 years 16.1%White 18.3% 20-29 years 23.9%
Hispanic 19.8% 30-39 years 22.0%Multi-race 11.6% 40-49 years 16.7%
Other 21.4% 50+ years 17.1%Mode of Transmission Insurance Status
MSM 17.3% Medicaid 15.1%IDU 17.7% Medicare 15.6%
Heterosexual 19.3% None 26.8%MSM/IDU 22.0% Other/unknown 31.6%NIR/NRR 26.1% Private 14.0%
Other 23.5% Missing 28.4%Perinatal 18.0%
SexMale 19.7%
Female 17.0%
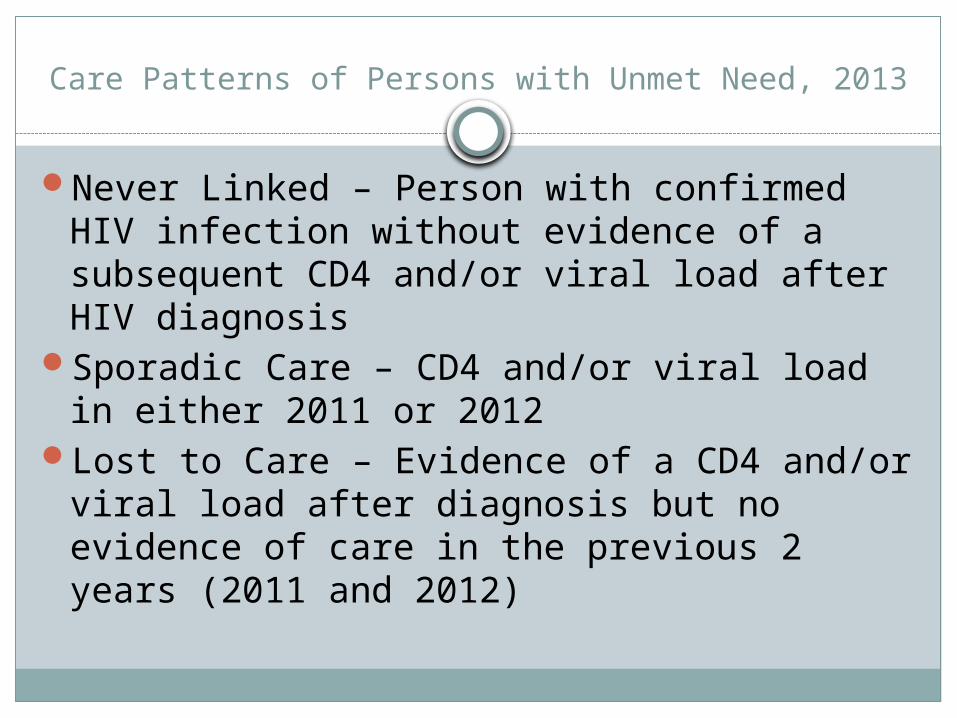
Care Patterns of Persons with Unmet Need, 2013
Never Linked – Person with confirmed HIV infection without evidence of a subsequent CD4 and/or viral load after HIV diagnosis
Sporadic Care – CD4 and/or viral load in either 2011 or 2012
Lost to Care – Evidence of a CD4 and/or viral load after diagnosis but no evidence of care in the previous 2 years (2011 and 2012)
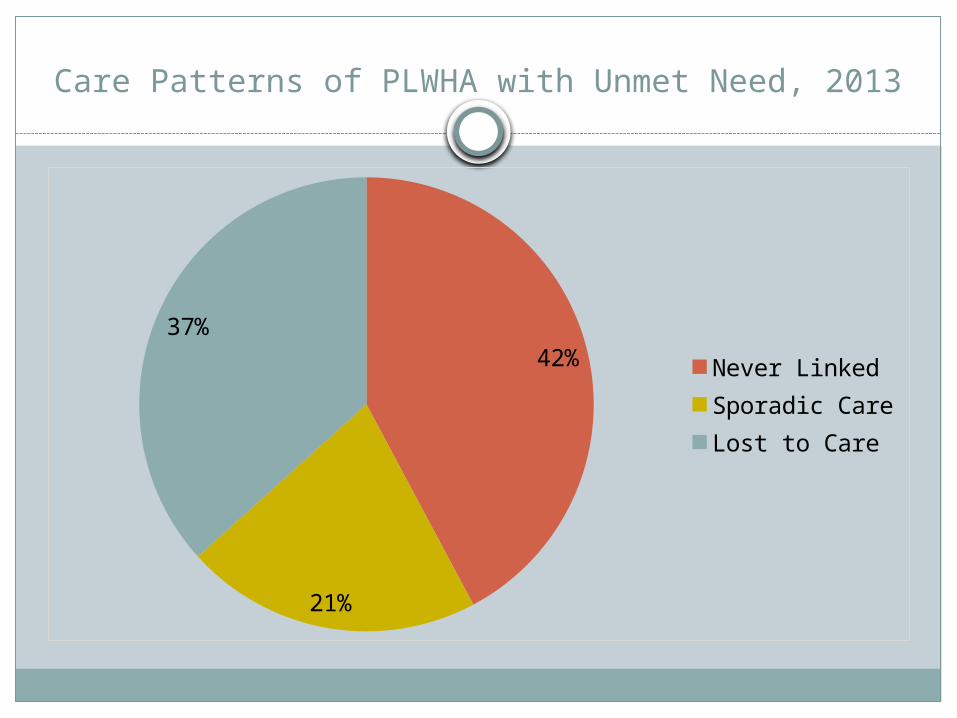
Care Patterns of PLWHA with Unmet Need, 2013
42%
21%
37%Never LinkedSporadic CareLost to Care
Unmet Need Summary
Unmet Need for HIV related primary care remains stable in the Philadelphia EMA.
After several years of consistent declines, the level of unmet need in the EMA has plateaued for PLWH, PLWA, and the combined population. The estimate reasonably demonstrates that these desirable declines are
the result of systematic, concentrated efforts to identify, inform, refer, link and retain persons in care
Unmet need is higher among Latinos, heterosexuals (and NIR), males, persons age 20-39 and those with no insurance
Local analysis suggests that improving linkage to care could have the greatest impact on reducing unmet need in the future.
clinicaloptions.com/hivStarting Antiretroviral Therapy in 2012: A Compendium of Interactive Cases
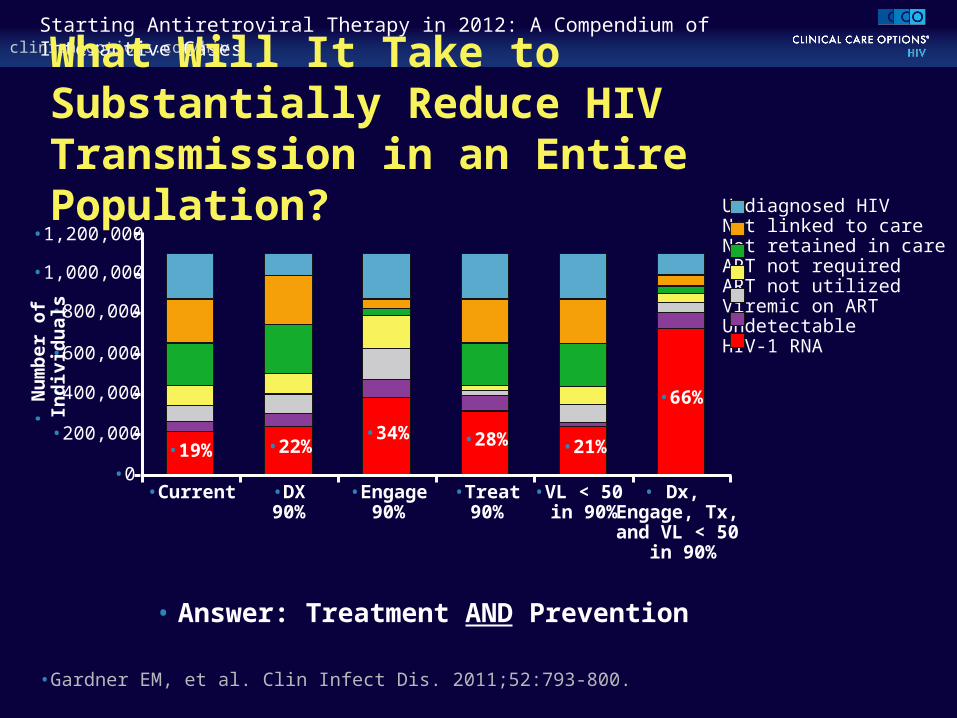
What Will It Take to Substantially Reduce HIV Transmission in an Entire Population?
• Answer: Treatment AND Prevention
•Gardner EM, et al. Clin Infect Dis. 2011;52:793-800.
•200,000
•600,000
•0
•800,000
•1,000,000
•1,200,000
•400,000
•19% •22%•34% •28% •21%
•66%
•N
umbe
r of I
ndiv
idua
ls
•Current •DX90%
•Engage90%
•Treat90%
•VL < 50 in 90%
• Dx, Engage, Tx, and VL < 50
in 90%
Undiagnosed HIVNot linked to careNot retained in careART not requiredART not utilizedViremic on ARTUndetectable HIV-1 RNA
Care Continuum of HIV-Infected People with Mental Illness in Philadelphia
Kathleen A. Brady, MD
Penn Mental Health AIDS Research Center
HIV and Mental Illness
HIV and mental illness are closely intertwined conditions:–5-23% of persons with mental illness
are infected with HIV, compared to 0.3-0.4% of the general population
–As many as half of PLWH have one or more psychiatric disorders
HIV and Mental Illness
Improving the care of PLWH and mental illness will be critical to–meeting the goals of the U.S.
National HIV/AIDS Strategy–accelerating improvements along
the HIV care continuum
Purpose of this Study
(1) Compare differences in retention in care, use of ART, and HIV suppression between PLWH with and without mental illness
(2) help identify gaps in HIV treatment cascade amenable to future intervention
Study Sample
• Philadelphia Medical Monitoring Project (MMP)- population-based sample representative of PLWH (2008-2010)
• Eligibility criteria: (1) known HIV diagnosis (2) age ≥ 18 years (3) enrollment in care at a medical facility (4) new to MMP
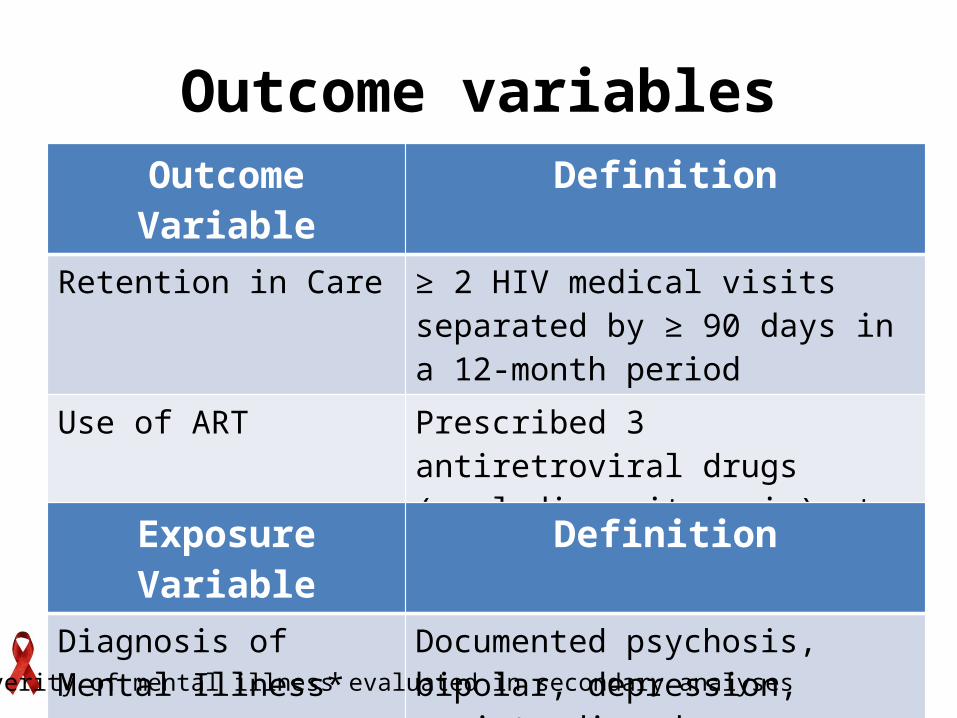
Outcome variablesOutcome Variable Definition
Retention in Care ≥ 2 HIV medical visits separated by ≥ 90 days in a 12-month period
Use of ART Prescribed 3 antiretroviral drugs (excluding ritonavir) at any point during a 12-month period
HIV Viral Suppression HIV-1 RNA ≤ 200 copies/mL at the last measure of the observation period
Exposure Variable DefinitionDiagnosis of Mental Illness*
Documented psychosis, bipolar, depression, anxiety disorder
*Severity of mental illness evaluated in secondary analyses
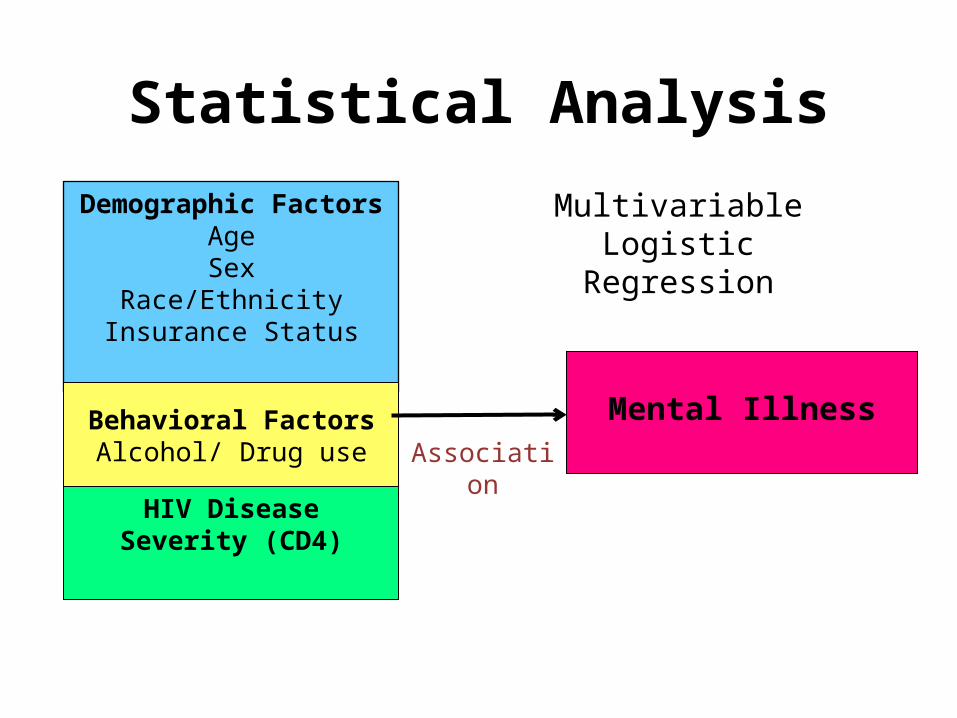
Statistical AnalysisMultivariable Logistic
RegressionDemographic Factors
AgeSex
Race/EthnicityInsurance Status
Behavioral FactorsAlcohol/ Drug use
HIV Disease Severity (CD4)
Mental IllnessAssociation
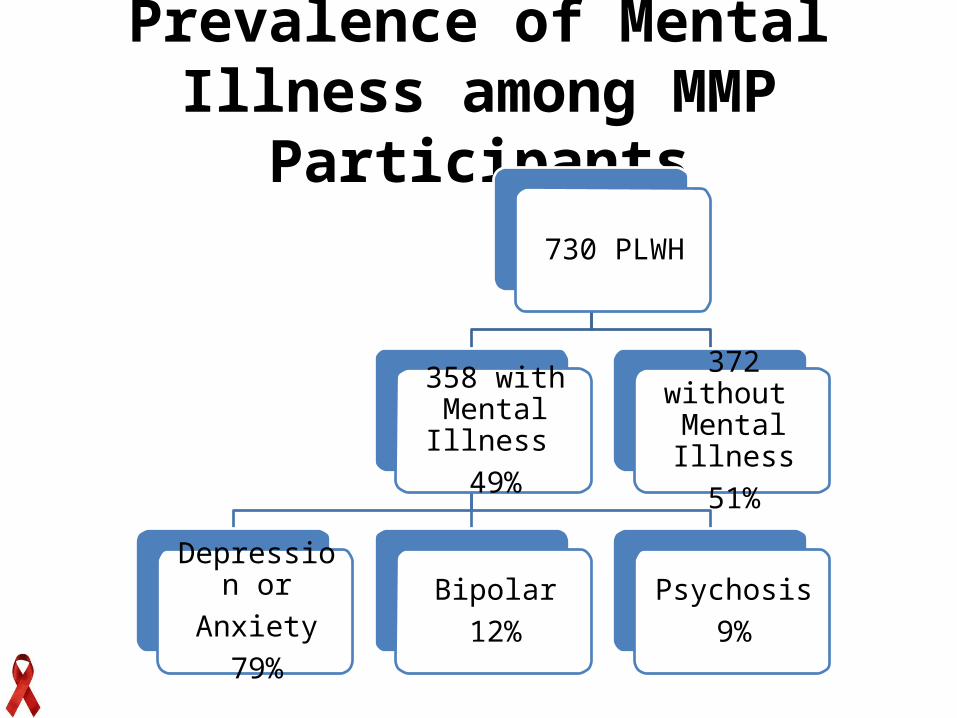
Prevalence of Mental Illness among MMP Participants
730 PLWH
358 with Mental Illness
49%
Depression orAnxiety
79%
Bipolar12%
Psychosis9%
372 without Mental Illness
51%
Factors Associated with Mental IllnessCharacteristics Mental Illness AOR
(95% CI)Sex Female
(Ref male)1.84 (1.31, 2.58)
Race/Ethnicity Black Hispanic
(Ref white)0.45 (0.29, 0.71)1.16 (0.64, .2.11)
Insurance Medicaid Medicare Uninsured
(Ref Private)2.74 (1.61, 4.66)2.27 (1.26, 4.08)1.16 (0.51. 2.63)
Alcohol abuse Yes
(Ref no)2.20 (1.56, 3.10)
Injection Drug Use Yes
(Ref no)2.31 (1.37, 3.89)
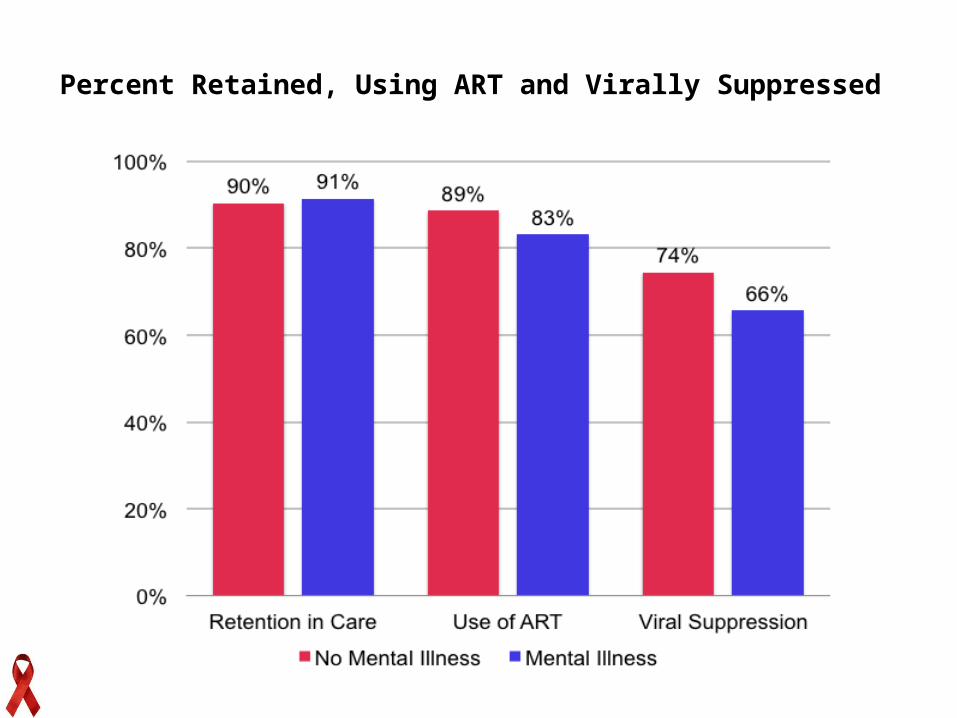
Percent Retained, Using ART and Virally Suppressed
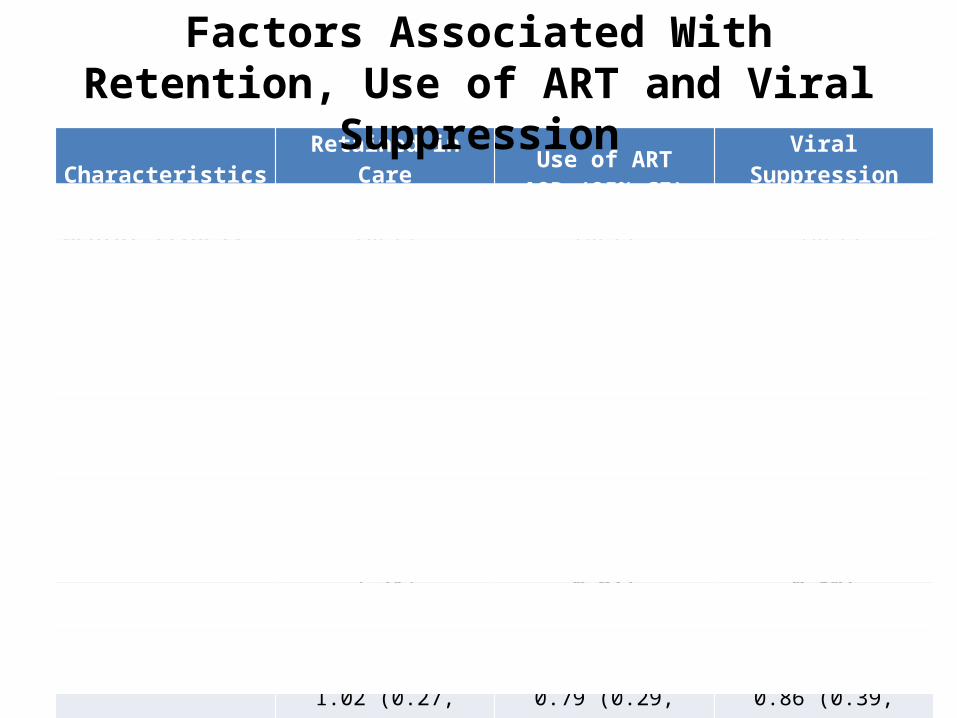
Characteristics Retained in CareAOR (95% CI)
Use of ARTAOR (95% CI)
Viral SuppressionAOR (95% CI)
Mental Illness, No Yes
(Ref)1.30 (0.63, 2.56)
(Ref)0.79 (0.49, 1.25)
(Ref)0.64 (0.46, 0.90)
Age (years), 18-29 30-39 40-49 >49
(Ref)0.86 (0.41, 1.83)1.46 (0.64, 3.34)1.93 (0.86, 4.35)
(Ref)3.70 (1.65, 8.31)2.26 (1.24, 4.11)3.79 (1.76, 8.16)
(Ref)2.05 (1.01, 4.15)3.26 (1.98, 5.38)4.06 (2.39, 6.90)
Sex, Male Female
(Ref)1.32 (0.68, 2.58)
(Ref)0.45 (0.30, 0.67)
(Ref)0.56 (0.329, 0.80)
Race, White Black Hispanic
(Ref)0.97 (0.45, 2.13)1.02 (0.27, 3.85)
(Ref)0.90 (0.45, 1.77)0.79 (0.29, 2.19)
(Ref)0.45 (0.22, 0.93)0.86 (0.39, 1.91)
CD4, <201 cell/mm3
201-350 cell/mm3
351-500 cell/mm3
>500 cell/mm3
(Ref)1.08 (0.51, 2.29)3.52 (1.23, 10.13)1.35 (0.59, 3.07)
(Ref)0.41 (0.15, 1.07)0.34 (0.14, 0.83)0.27 (0.11, 0.65)
(Ref)3.37 (1.89, 6.02)3.37 (1.95, 5.83)4.40 (2.47, 7.83)
Alcohol Abuse, No Yes
(Ref)0.72 (0.28, 1.85)
(Ref)0.76 (0.40, 1.45)
(Ref)0.75 (0.44, 1.27)
Injection Drugs, No Yes
(Ref)1.28 (0.48, 3.46)
(Ref)0.73 (0.35, 1.54)
(Ref)0.95 (0.53, 1.69)
Factors Associated With Retention, Use of ART and Viral Suppression
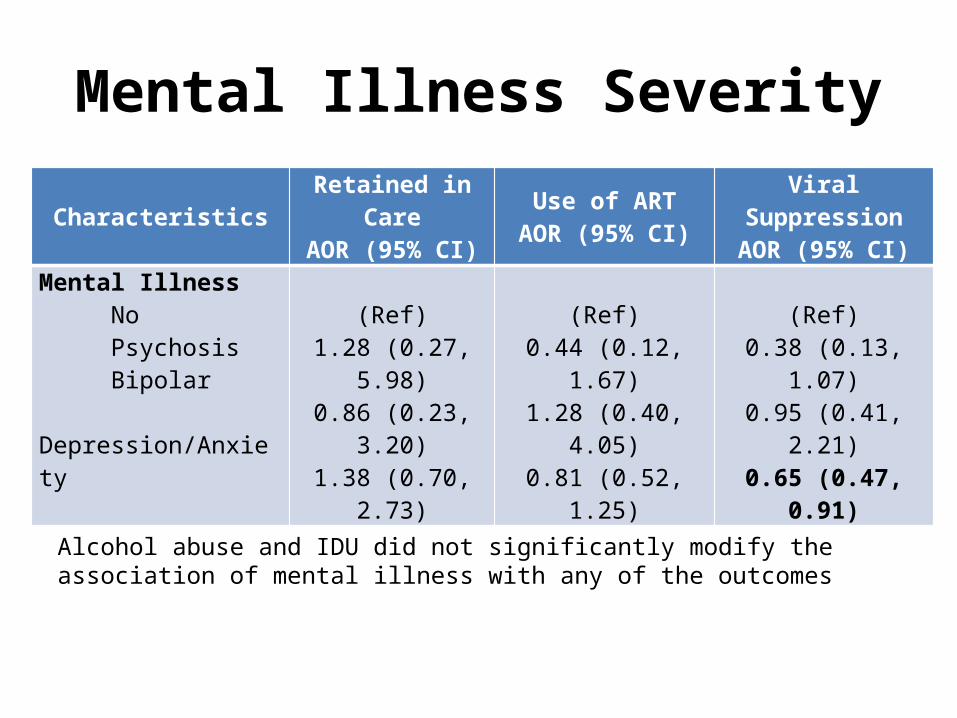
Mental Illness Severity
Characteristics Retained in CareAOR (95% CI)
Use of ARTAOR (95% CI)
Viral SuppressionAOR (95% CI)
Mental Illness No Psychosis Bipolar Depression/Anxiety
(Ref)1.28 (0.27, 5.98)0.86 (0.23, 3.20)1.38 (0.70, 2.73)
(Ref)0.44 (0.12, 1.67)1.28 (0.40, 4.05)0.81 (0.52, 1.25)
(Ref)0.38 (0.13, 1.07)0.95 (0.41, 2.21)0.65 (0.47, 0.91)
Alcohol abuse and IDU did not significantly modify the association of mental illness with any of the outcomes
Limitations
• Limited definition of mental illness• Treatment history not captured• The impact of mental illness on the early
steps of the HIV care continuum unknown
• High retention rates due to sampling bias• Observations limited to one year
Conclusion
• PLWH commonly experience mental illness
• People with a diagnosis of mental illness achieved similar rates of retention in HIV care and ART use but were less likely to be suppressed compared to those without mental illness
Implications of Study Findings
• These findings argue for the importance of identifying and treating mental illness in PLWH to optimize their HIV outcomes
• Model of care: integrating HIV and mental health• The relationship between drug/alcohol abuse on
ART adherence and viral suppression needs to be investigated further
• We need to understand why women do poorly
Acknowledgment
Funding This research was
supported by a grant from the Penn Mental Health AIDS Research Center (PMHARC), an NIH-funded program (P30 MH 097488)
CollaboratorsUniversity of Pennsylvania Baligh Yehia
Alisa Stephens Robert Gross
Karen GlanzBenoit Dube
Drexel UniversityFlorence Momplaisir

QUESTIONS?
The End