Embed Size (px)
Citation preview
Medicaid: Moving Forward
September 2015
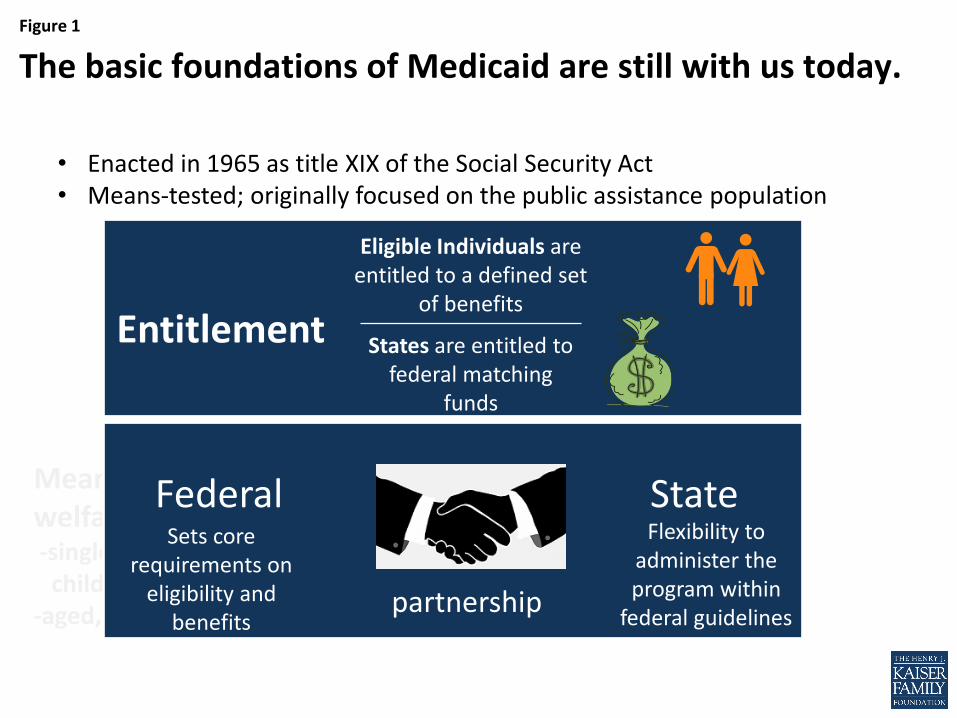
Figure 1
The basic foundations of Medicaid are still with us today.
Mandatory services and populations for participating
states with options for broader coverage
Means-tested, with focus on welfare population: -single parents with dependent children -aged, blind, and disabled
Federal State
Entitlement
• Enacted in 1965 as title XIX of the Social Security Act • Means-tested; originally focused on the public assistance population
Eligible Individuals are entitled to a defined set
of benefits
States are entitled to federal matching
funds
Sets core requirements on
eligibility and benefits
Flexibility to administer the program within
federal guidelines partnership
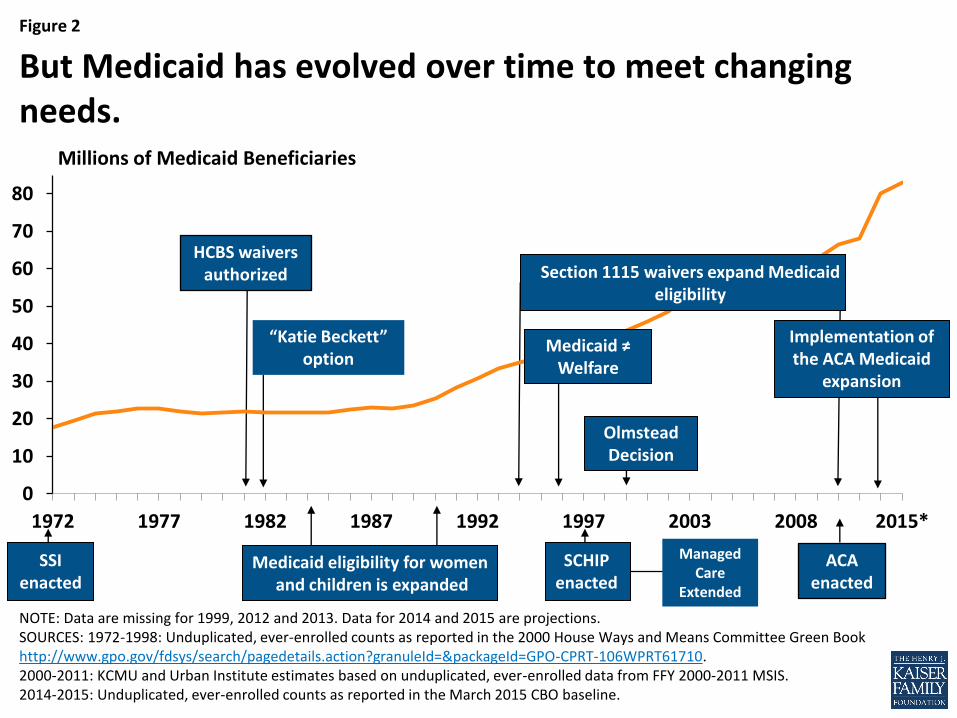
Figure 2
0
10
20
30
40
50
60
70
80
1972 1977 1982 1987 1992 1997 2003 2008 2015*
Managed Care
Extended
Olmstead Decision
But Medicaid has evolved over time to meet changing needs.
Millions of Medicaid Beneficiaries
Medicaid eligibility for women and children is expanded
Medicaid ≠ Welfare
ACA enacted
HCBS waivers authorized
SSI enacted
Section 1115 waivers expand Medicaid eligibility
SCHIP enacted
Implementation of the ACA Medicaid
expansion
“Katie Beckett” option
NOTE: Data are missing for 1999, 2012 and 2013. Data for 2014 and 2015 are projections. SOURCES: 1972-1998: Unduplicated, ever-enrolled counts as reported in the 2000 House Ways and Means Committee Green Book http://www.gpo.gov/fdsys/search/pagedetails.action?granuleId=&packageId=GPO-CPRT-106WPRT61710. 2000-2011: KCMU and Urban Institute estimates based on unduplicated, ever-enrolled data from FFY 2000-2011 MSIS. 2014-2015: Unduplicated, ever-enrolled counts as reported in the March 2015 CBO baseline.
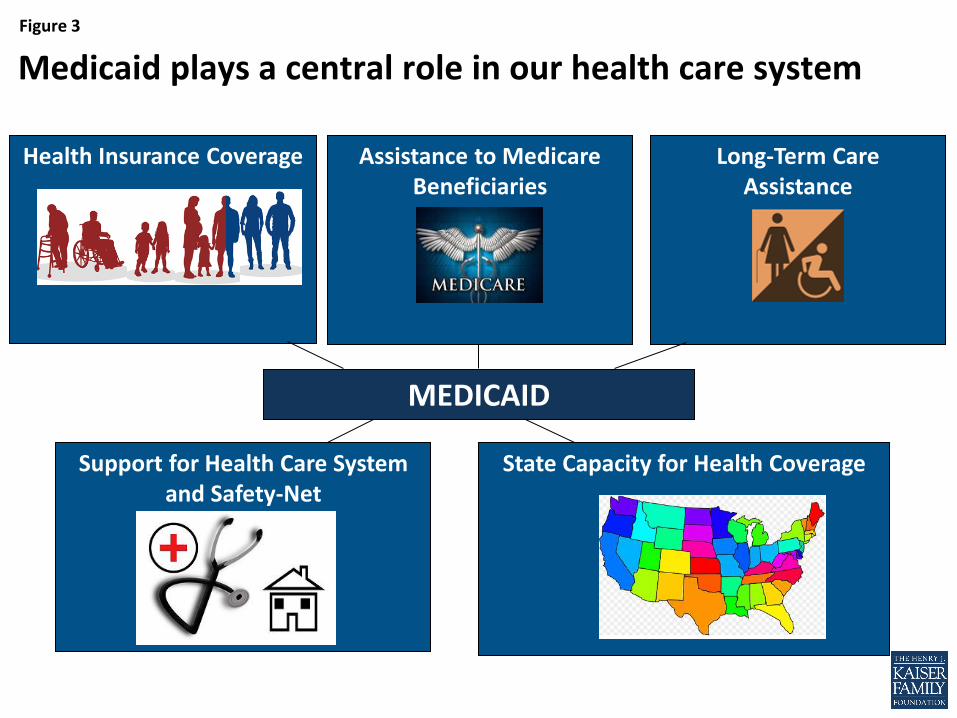
Figure 3
Medicaid plays a central role in our health care system
Health Insurance Coverage
State Capacity for Health Coverage
MEDICAID
Support for Health Care System and Safety-Net
Assistance to Medicare Beneficiaries
Long-Term Care Assistance
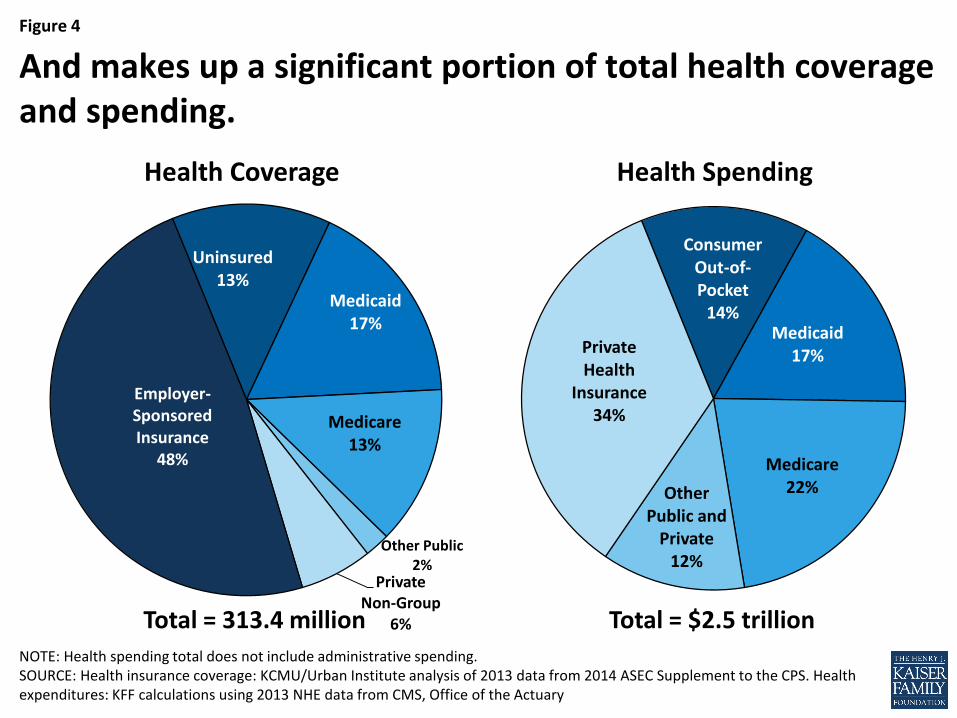
Figure 4
Uninsured 13%
Medicaid 17%
Medicare 13%
Other Public 2%
Private Non-Group
6%
Employer-Sponsored Insurance
48%
Health Coverage
NOTE: Health spending total does not include administrative spending. SOURCE: Health insurance coverage: KCMU/Urban Institute analysis of 2013 data from 2014 ASEC Supplement to the CPS. Health expenditures: KFF calculations using 2013 NHE data from CMS, Office of the Actuary
Consumer Out-of-Pocket
14% Medicaid
17%
Medicare 22% Other
Public and Private
12%
Private Health
Insurance 34%
Health Spending
And makes up a significant portion of total health coverage and spending.
Total = 313.4 million Total = $2.5 trillion
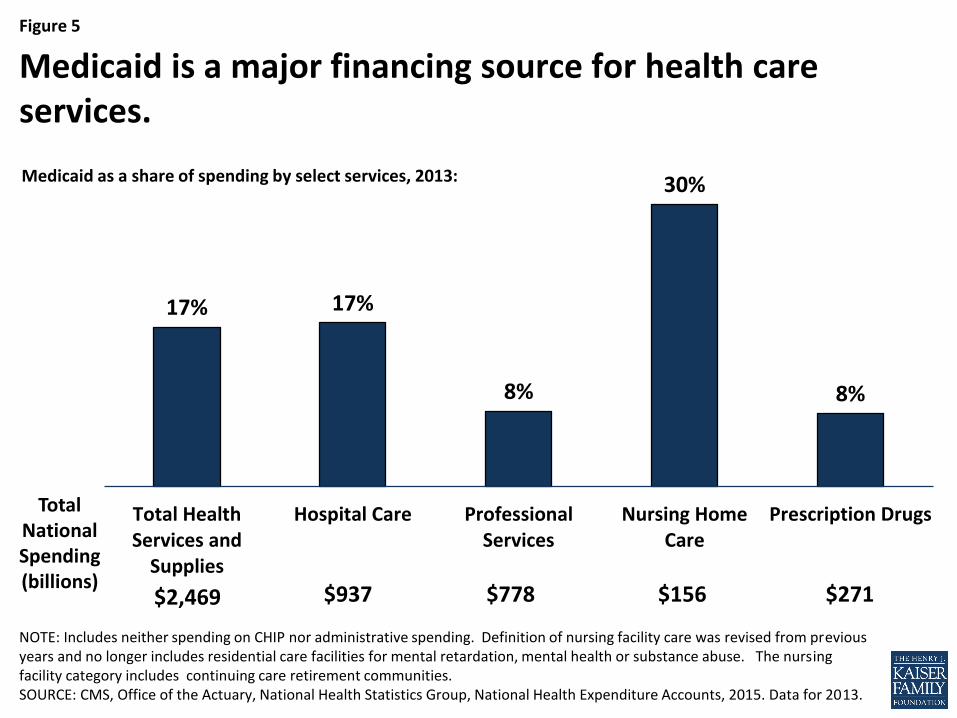
Figure 5
17% 17%
8%
30%
8%
Total HealthServices and
Supplies
Hospital Care ProfessionalServices
Nursing HomeCare
Prescription Drugs
Medicaid as a share of spending by select services, 2013:
NOTE: Includes neither spending on CHIP nor administrative spending. Definition of nursing facility care was revised from previous years and no longer includes residential care facilities for mental retardation, mental health or substance abuse. The nursing facility category includes continuing care retirement communities. SOURCE: CMS, Office of the Actuary, National Health Statistics Group, National Health Expenditure Accounts, 2015. Data for 2013.
Medicaid is a major financing source for health care services.
Total National Spending (billions)
$2,469 $937 $778 $156 $271
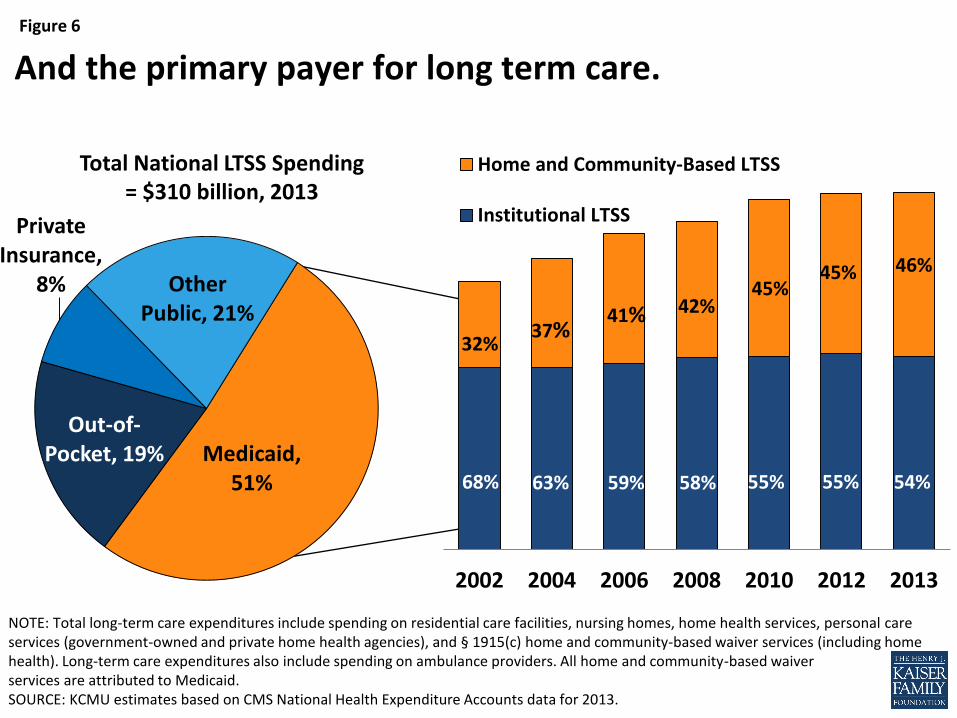
Figure 6
NOTE: Total long-term care expenditures include spending on residential care facilities, nursing homes, home health services, personal care services (government-owned and private home health agencies), and § 1915(c) home and community-based waiver services (including home health). Long-term care expenditures also include spending on ambulance providers. All home and community-based waiver services are attributed to Medicaid. SOURCE: KCMU estimates based on CMS National Health Expenditure Accounts data for 2013.
And the primary payer for long term care.
Out-of-Pocket,
15%
Total National LTSS Spending = $310 billion, 2013
2002 2004 2006 2008 2010 2012 2013
Home and Community-Based LTSS
Institutional LTSS
68% 63% 58% 55% 55% 54% 59%
37% 42%
45%
32%
45% 46%
41%
Medicaid, 51%
Out-of-Pocket, 19%
Private Insurance,
8% Other Public, 21%
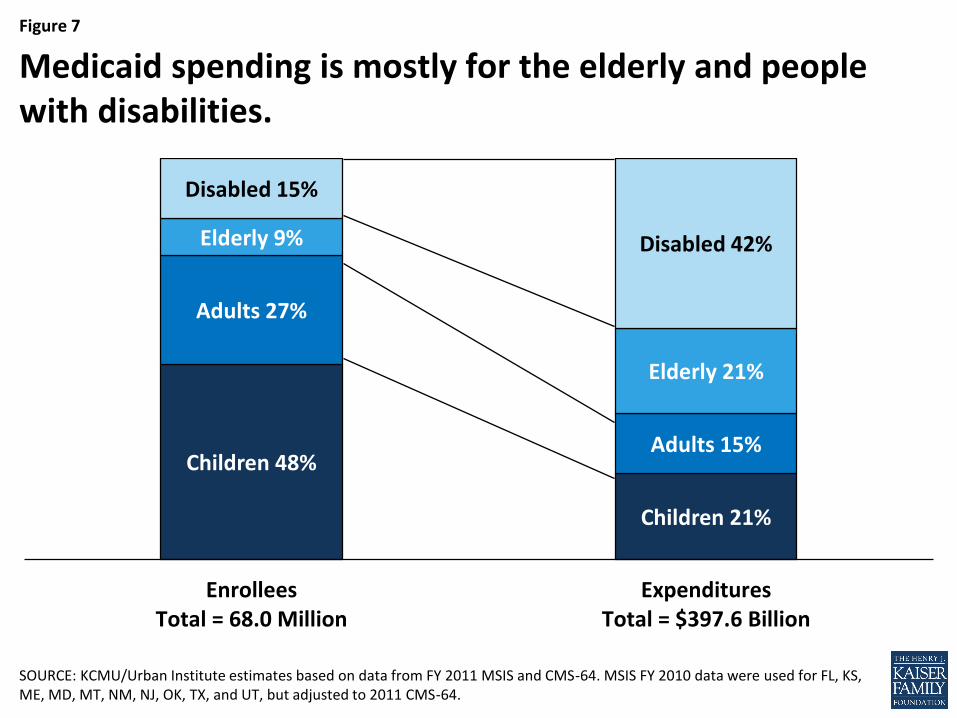
Figure 7
Children 48%
Children 21%
Adults 27%
Adults 15%
Elderly 9%
Elderly 21%
Disabled 15%
Disabled 42%
EnrolleesTotal = 68.0 Million
ExpendituresTotal = $397.6 Billion
SOURCE: KCMU/Urban Institute estimates based on data from FY 2011 MSIS and CMS-64. MSIS FY 2010 data were used for FL, KS, ME, MD, MT, NM, NJ, OK, TX, and UT, but adjusted to 2011 CMS-64.
Medicaid spending is mostly for the elderly and people with disabilities.
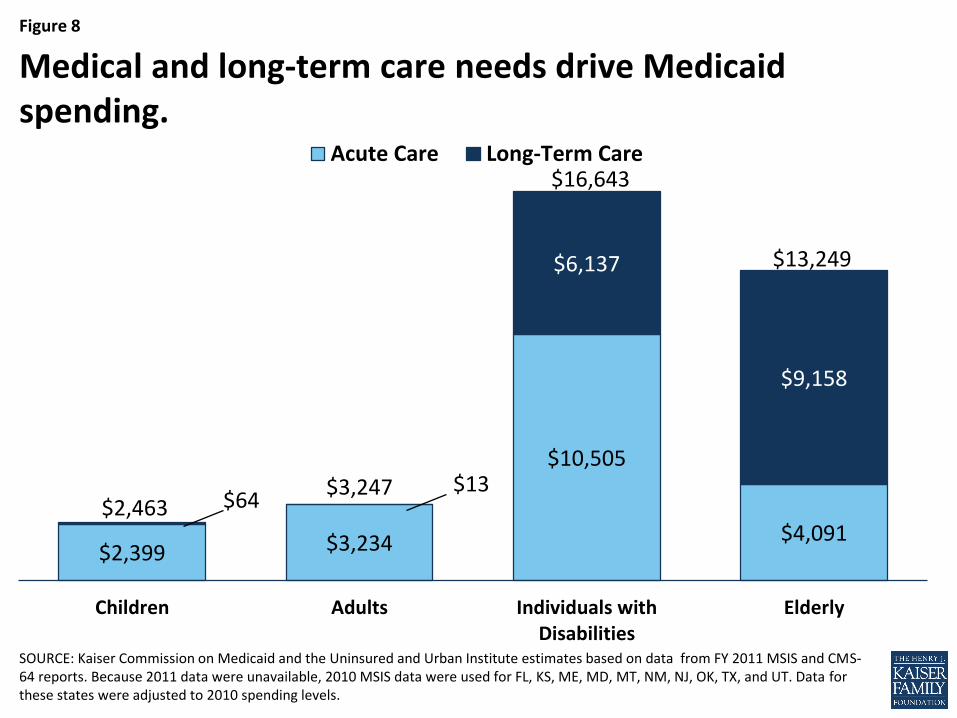
Figure 8
$2,399 $3,234
$10,505
$4,091
$64 $13
$6,137
$9,158
$2,463 $3,247
Children Adults Individuals withDisabilities
Elderly
Acute Care Long-Term Care$16,643
$13,249
SOURCE: Kaiser Commission on Medicaid and the Uninsured and Urban Institute estimates based on data from FY 2011 MSIS and CMS-64 reports. Because 2011 data were unavailable, 2010 MSIS data were used for FL, KS, ME, MD, MT, NM, NJ, OK, TX, and UT. Data for these states were adjusted to 2010 spending levels.
Medical and long-term care needs drive Medicaid spending.
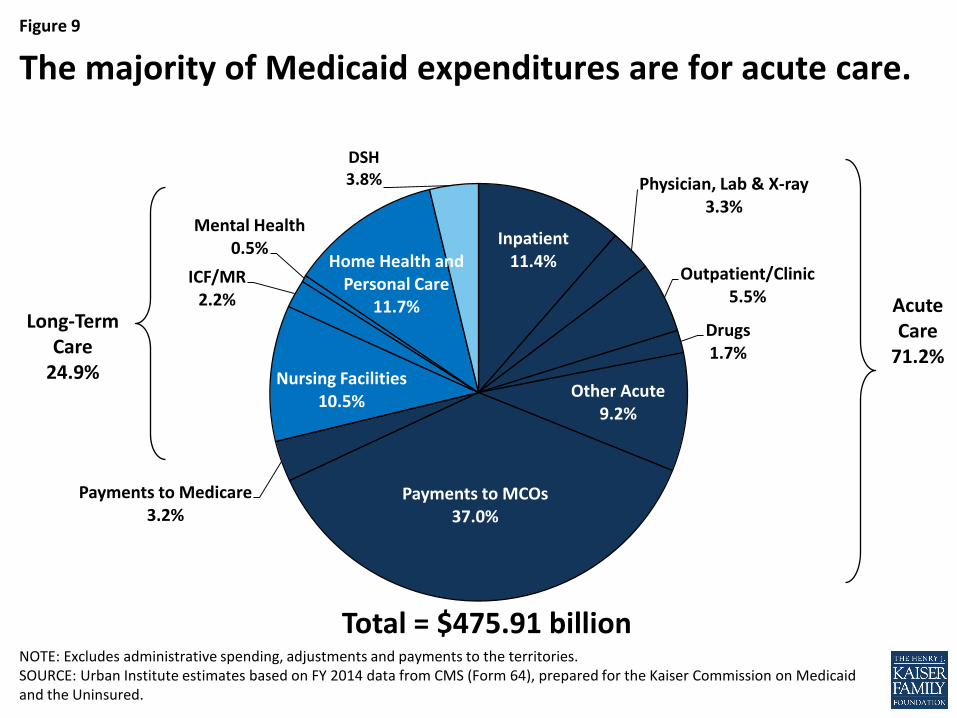
Figure 9
Inpatient 11.4%
Physician, Lab & X-ray 3.3%
Outpatient/Clinic 5.5%
Drugs 1.7%
Other Acute 9.2%
Payments to MCOs 37.0%
Payments to Medicare 3.2%
Nursing Facilities 10.5%
ICF/MR 2.2%
Mental Health 0.5%
Home Health and Personal Care
11.7%
DSH 3.8%
NOTE: Excludes administrative spending, adjustments and payments to the territories. SOURCE: Urban Institute estimates based on FY 2014 data from CMS (Form 64), prepared for the Kaiser Commission on Medicaid and the Uninsured.
The majority of Medicaid expenditures are for acute care.
Total = $475.91 billion
Acute Care
71.2%
Long-Term Care
24.9%
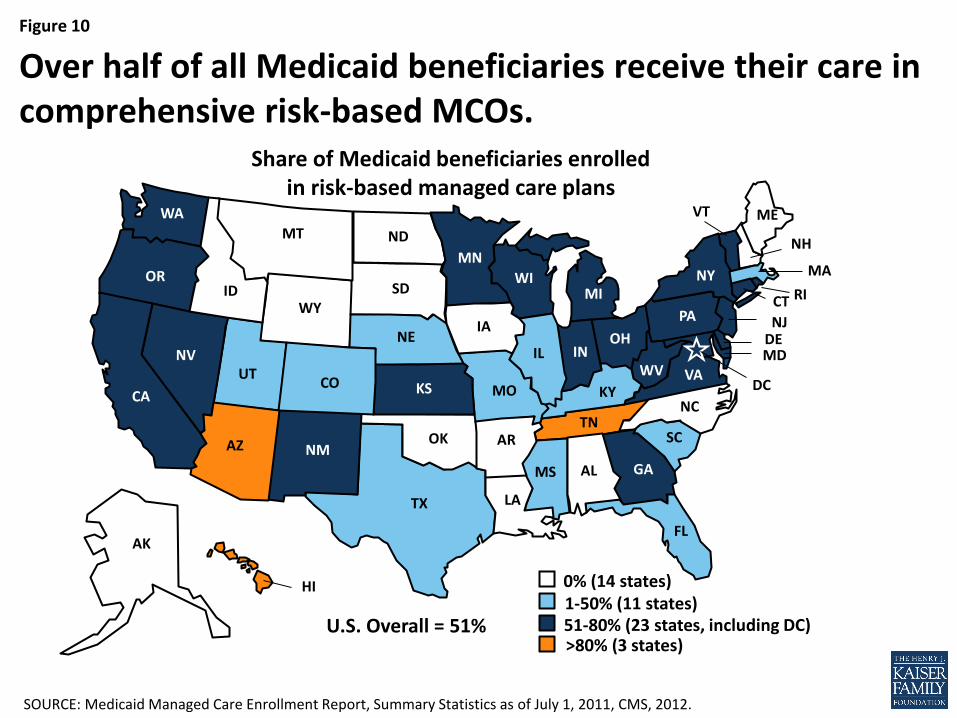
Figure 10
SOURCE: Medicaid Managed Care Enrollment Report, Summary Statistics as of July 1, 2011, CMS, 2012.
Over half of all Medicaid beneficiaries receive their care in comprehensive risk-based MCOs.
WY
WI
WV
WA
VA
VT
UT
TX
TN
SD
SC
RI
PA
OR
OK
OH
ND
NC
NY
NM
NJ
NH
NV NE
MT
MO
MS
MN
MI
MA
MD
ME
LA
KY KS
IA
IN IL
ID
HI
GA
FL
DC
DE
CT
CO
CA
AR AZ
AK
AL
1-50% (11 states) 0% (14 states)
51-80% (23 states, including DC) >80% (3 states)
U.S. Overall = 51%
Share of Medicaid beneficiaries enrolled in risk-based managed care plans
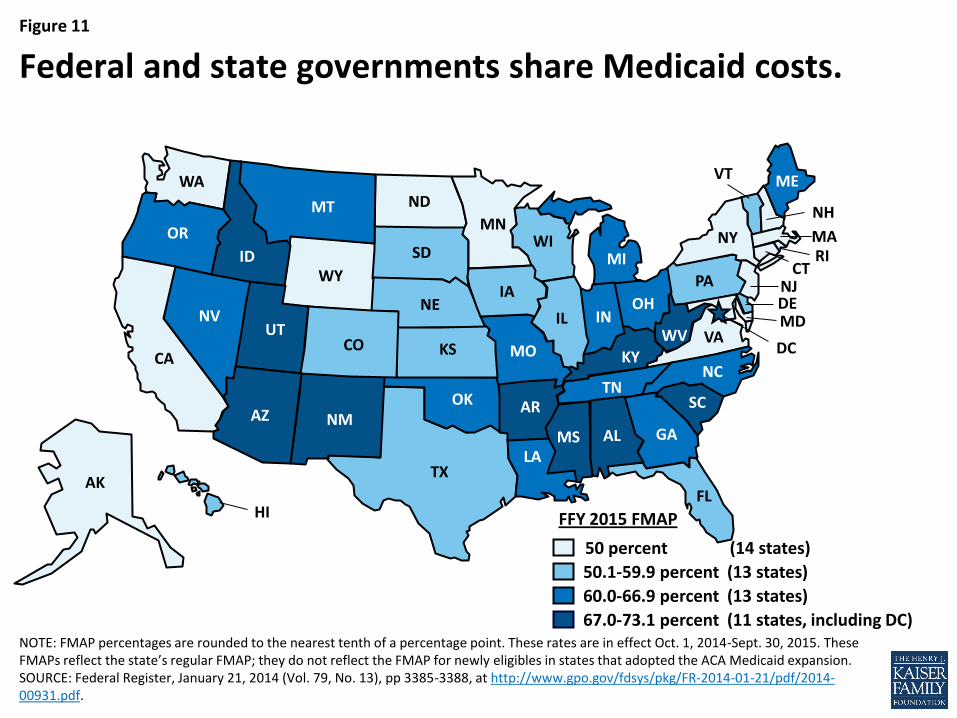
Figure 11
NOTE: FMAP percentages are rounded to the nearest tenth of a percentage point. These rates are in effect Oct. 1, 2014-Sept. 30, 2015. These FMAPs reflect the state’s regular FMAP; they do not reflect the FMAP for newly eligibles in states that adopted the ACA Medicaid expansion. SOURCE: Federal Register, January 21, 2014 (Vol. 79, No. 13), pp 3385-3388, at http://www.gpo.gov/fdsys/pkg/FR-2014-01-21/pdf/2014-00931.pdf.
Federal and state governments share Medicaid costs.
WA
OR
WY
UT
TX
SD
OK
ND
NM
NV NE
MT
LA
KS
ID
HI
CO
CA
AR AZ
AK
WI
WV VA
TN SC
OH
NC MO
MS
MN
MI
KY
IA
IN IL
GA
FL
AL
VT
PA
NY
NJ
NH
MA
ME
DC
CT
DE
RI
MD
50.1-59.9 percent (13 states)
50 percent (14 states)
60.0-66.9 percent (13 states)
67.0-73.1 percent (11 states, including DC)
FFY 2015 FMAP
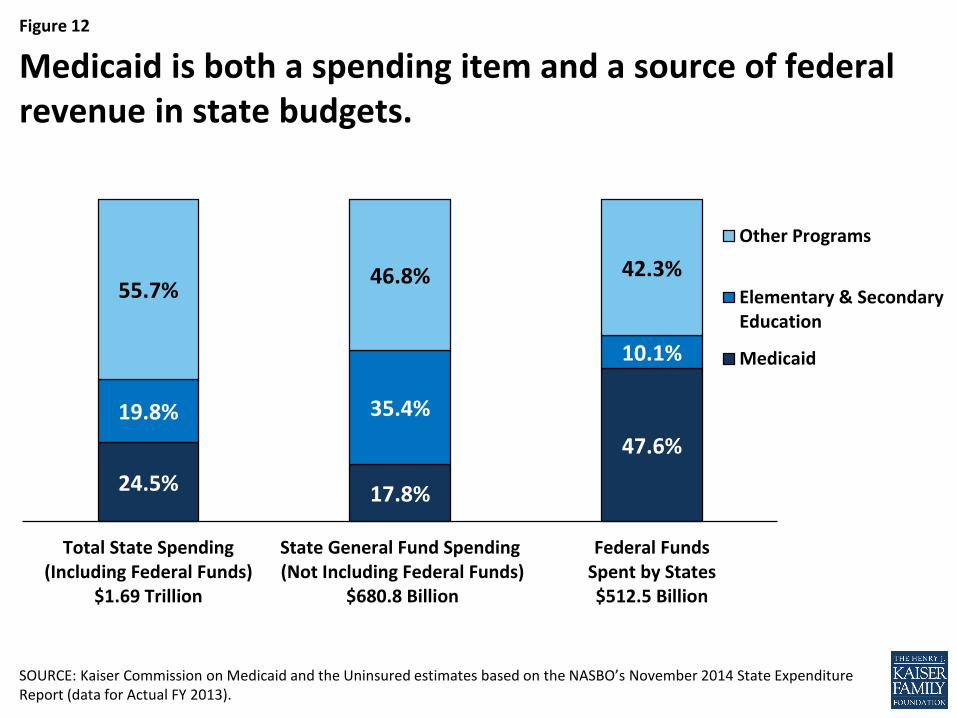
Figure 12
24.5% 17.8%
47.6%
19.8% 35.4%
10.1%
55.7% 46.8% 42.3%
Total State Spending(Including Federal Funds)
$1.69 Trillion
State General Fund Spending (Not Including Federal Funds)
$680.8 Billion
Federal FundsSpent by States$512.5 Billion
Other Programs
Elementary & SecondaryEducation
Medicaid
SOURCE: Kaiser Commission on Medicaid and the Uninsured estimates based on the NASBO’s November 2014 State Expenditure Report (data for Actual FY 2013).
Medicaid is both a spending item and a source of federal revenue in state budgets.
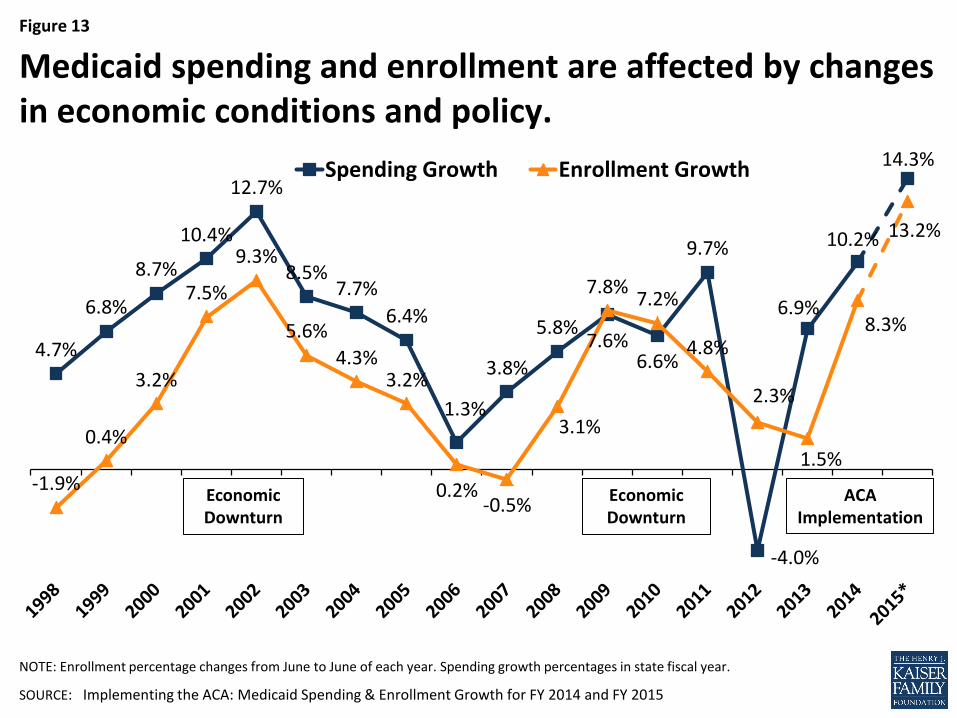
Figure 13
4.7%
6.8%
8.7%
10.4%
12.7%
8.5% 7.7%
6.4%
1.3%
3.8%
5.8% 7.6%
6.6%
9.7%
-4.0%
6.9%
10.2%
14.3%
-1.9%
0.4%
3.2%
7.5%
9.3%
5.6%
4.3% 3.2%
0.2% -0.5%
3.1%
7.8% 7.2%
4.8%
2.3%
1.5%
8.3%
13.2%
Spending Growth Enrollment Growth
Economic Downturn
Economic Downturn
ACA Implementation
NOTE: Enrollment percentage changes from June to June of each year. Spending growth percentages in state fiscal year.
SOURCE: Implementing the ACA: Medicaid Spending & Enrollment Growth for FY 2014 and FY 2015
Medicaid spending and enrollment are affected by changes in economic conditions and policy.
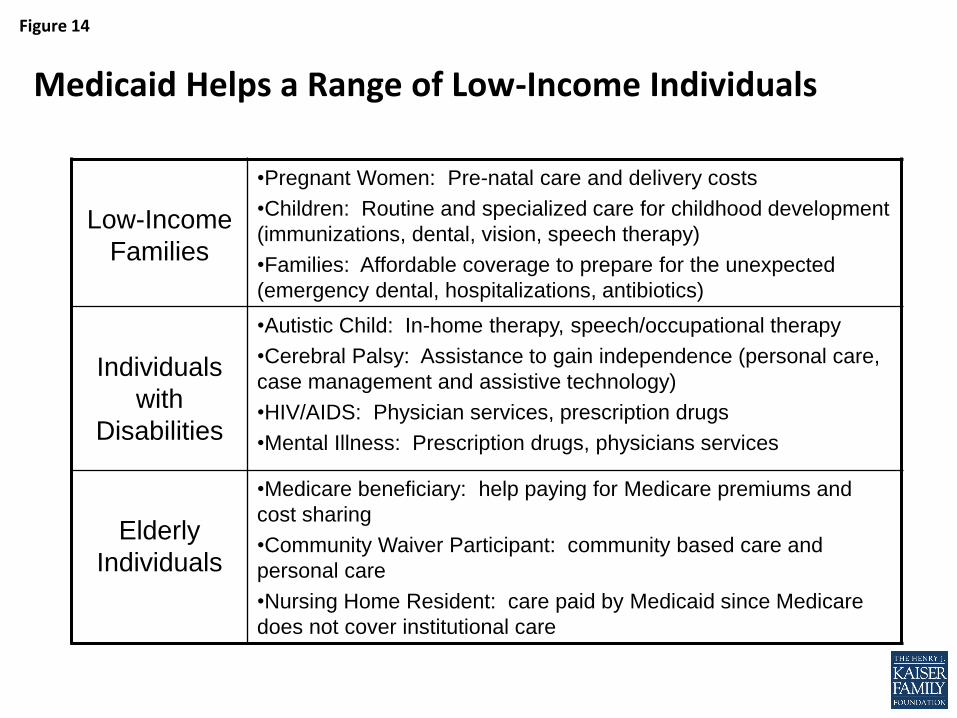
Figure 14
Medicaid Helps a Range of Low-Income Individuals
Low-Income
Families
•Pregnant Women: Pre-natal care and delivery costs
•Children: Routine and specialized care for childhood development
(immunizations, dental, vision, speech therapy)
•Families: Affordable coverage to prepare for the unexpected
(emergency dental, hospitalizations, antibiotics)
Individuals
with
Disabilities
•Autistic Child: In-home therapy, speech/occupational therapy
•Cerebral Palsy: Assistance to gain independence (personal care,
case management and assistive technology)
•HIV/AIDS: Physician services, prescription drugs
•Mental Illness: Prescription drugs, physicians services
Elderly
Individuals
•Medicare beneficiary: help paying for Medicare premiums and
cost sharing
•Community Waiver Participant: community based care and
personal care
•Nursing Home Resident: care paid by Medicaid since Medicare
does not cover institutional care
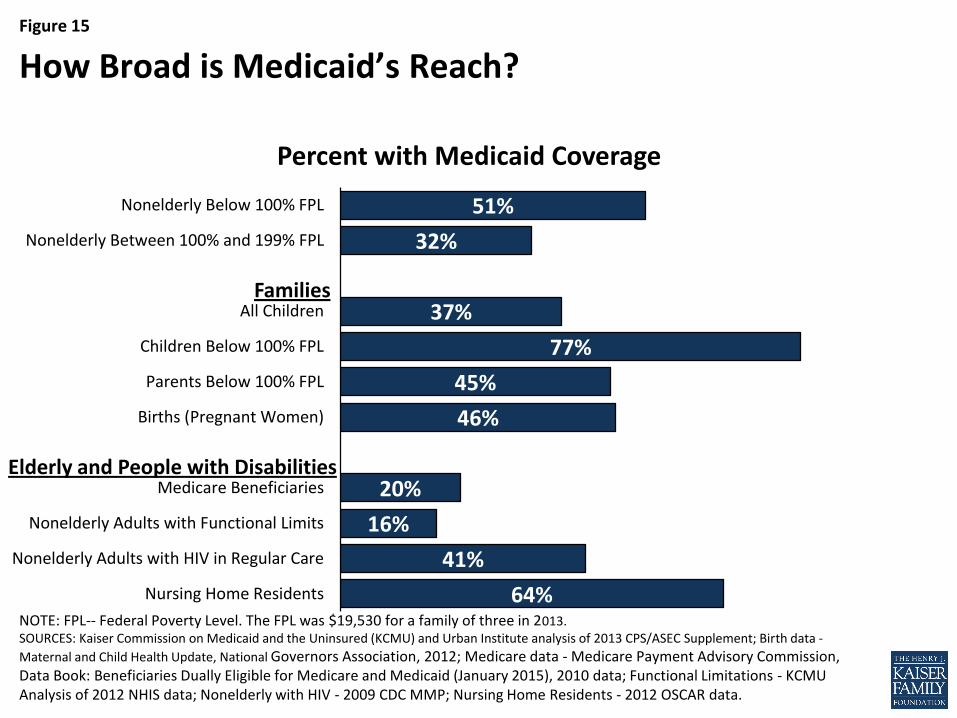
Figure 15
64%
41%
16%
20%
0%
46%
45%
77%
37%
32%
51%
Nursing Home Residents
Nonelderly Adults with HIV in Regular Care
Nonelderly Adults with Functional Limits
Medicare Beneficiaries
Births (Pregnant Women)
Parents Below 100% FPL
Children Below 100% FPL
All Children
Nonelderly Between 100% and 199% FPL
Nonelderly Below 100% FPL
Percent with Medicaid Coverage
NOTE: FPL-- Federal Poverty Level. The FPL was $19,530 for a family of three in 2013. SOURCES: Kaiser Commission on Medicaid and the Uninsured (KCMU) and Urban Institute analysis of 2013 CPS/ASEC Supplement; Birth data -
Maternal and Child Health Update, National Governors Association, 2012; Medicare data - Medicare Payment Advisory Commission, Data Book: Beneficiaries Dually Eligible for Medicare and Medicaid (January 2015), 2010 data; Functional Limitations - KCMU Analysis of 2012 NHIS data; Nonelderly with HIV - 2009 CDC MMP; Nursing Home Residents - 2012 OSCAR data.
How Broad is Medicaid’s Reach?
Families
Elderly and People with Disabilities
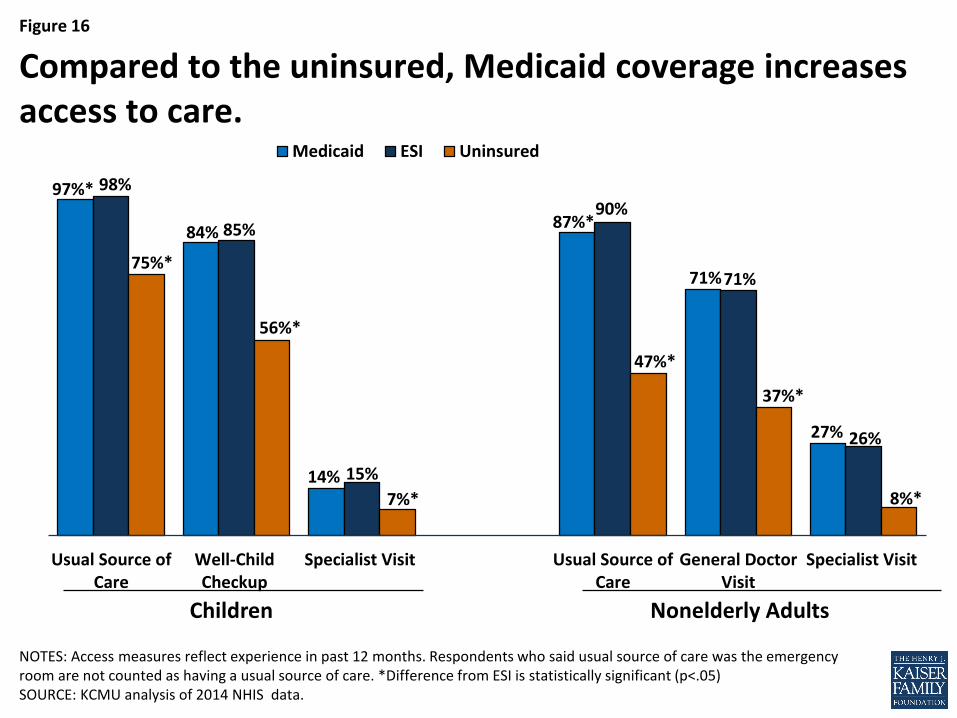
Figure 16
97%*
84%
14%
87%*
71%
27%
98%
85%
15%
90%
71%
26%
75%*
56%*
7%*
47%*
37%*
8%*
Usual Source ofCare
Well-ChildCheckup
Specialist Visit Usual Source ofCare
General DoctorVisit
Specialist Visit
Medicaid ESI Uninsured
NOTES: Access measures reflect experience in past 12 months. Respondents who said usual source of care was the emergency room are not counted as having a usual source of care. *Difference from ESI is statistically significant (p<.05) SOURCE: KCMU analysis of 2014 NHIS data.
Compared to the uninsured, Medicaid coverage increases access to care.
Children Nonelderly Adults
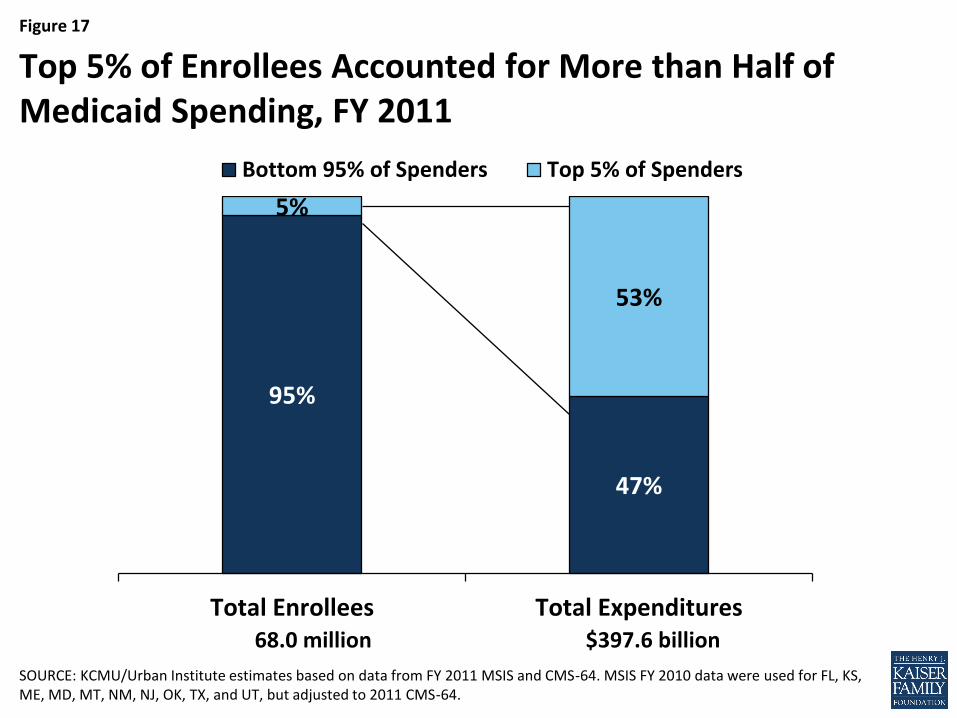
Figure 17
95%
47%
5%
53%
Total Enrollees Total Expenditures
Bottom 95% of Spenders Top 5% of Spenders
SOURCE: KCMU/Urban Institute estimates based on data from FY 2011 MSIS and CMS-64. MSIS FY 2010 data were used for FL, KS, ME, MD, MT, NM, NJ, OK, TX, and UT, but adjusted to 2011 CMS-64.
Top 5% of Enrollees Accounted for More than Half of Medicaid Spending, FY 2011
68.0 million $397.6 billion
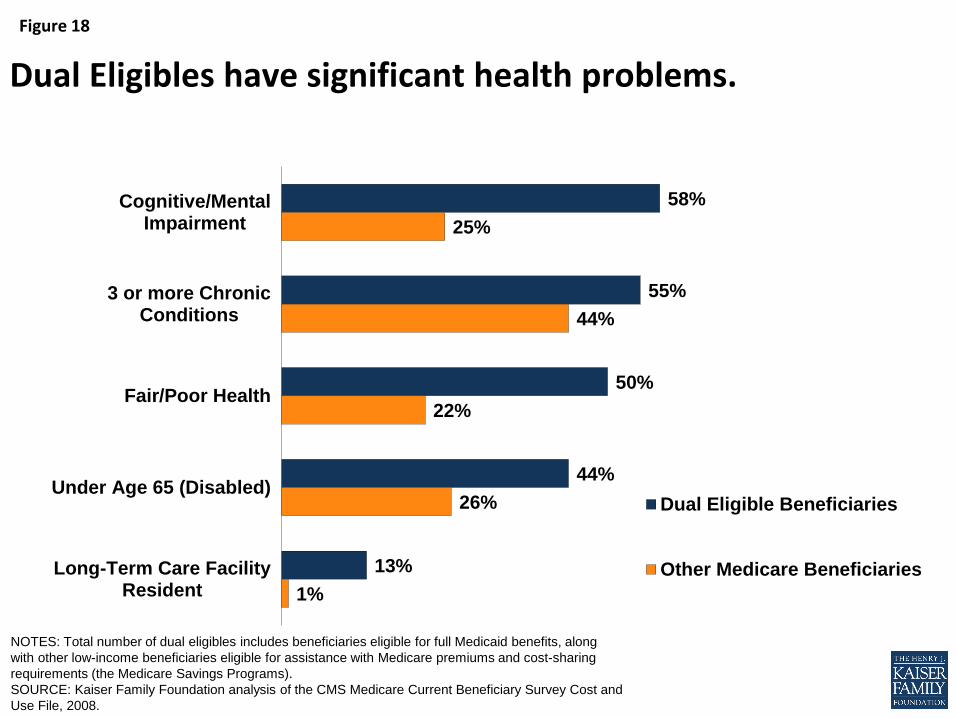
Figure 18
58%
55%
50%
44%
13%
25%
44%
22%
26%
1%
Cognitive/MentalImpairment
3 or more ChronicConditions
Fair/Poor Health
Under Age 65 (Disabled)
Long-Term Care FacilityResident
Dual Eligible Beneficiaries
Other Medicare Beneficiaries
Dual Eligibles have significant health problems.
NOTES: Total number of dual eligibles includes beneficiaries eligible for full Medicaid benefits, along
with other low-income beneficiaries eligible for assistance with Medicare premiums and cost-sharing
requirements (the Medicare Savings Programs).
SOURCE: Kaiser Family Foundation analysis of the CMS Medicare Current Beneficiary Survey Cost and
Use File, 2008.
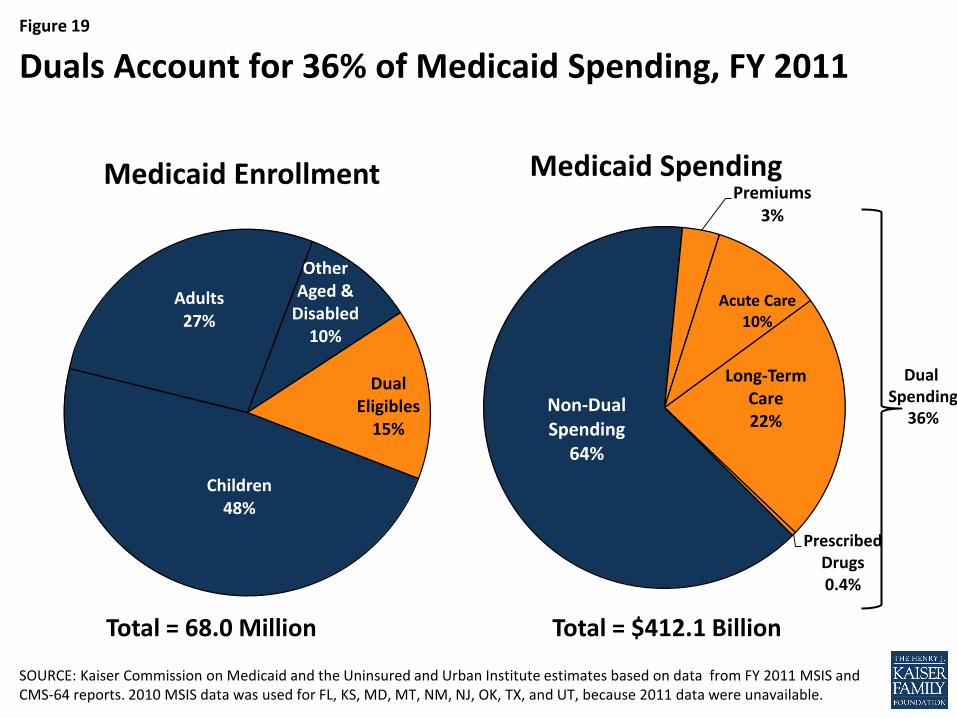
Figure 19
Children 48%
Adults 27%
Other Aged &
Disabled 10%
Dual Eligibles
15%
Medicaid Enrollment
SOURCE: Kaiser Commission on Medicaid and the Uninsured and Urban Institute estimates based on data from FY 2011 MSIS and CMS-64 reports. 2010 MSIS data was used for FL, KS, MD, MT, NM, NJ, OK, TX, and UT, because 2011 data were unavailable.
Long-Term Care 22%
Prescribed Drugs 0.4%
Non-Dual Spending
64%
Premiums 3%
Acute Care 10%
Medicaid Spending
Duals Account for 36% of Medicaid Spending, FY 2011
Dual Spending
36%
Total = 68.0 Million Total = $412.1 Billion
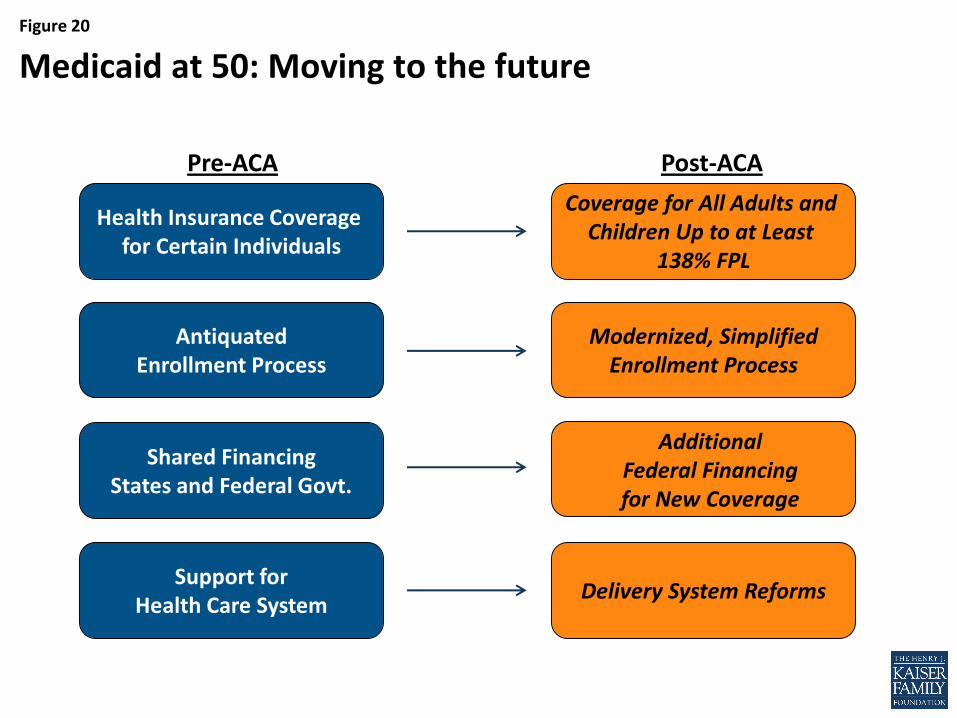
Figure 20
Medicaid at 50: Moving to the future
Delivery System Reforms
Health Insurance Coverage for Certain Individuals
Antiquated Enrollment Process
Support for Health Care System
Coverage for All Adults and Children Up to at Least
138% FPL
Modernized, Simplified Enrollment Process
Pre-ACA Post-ACA
Shared Financing States and Federal Govt.
Additional Federal Financing for New Coverage
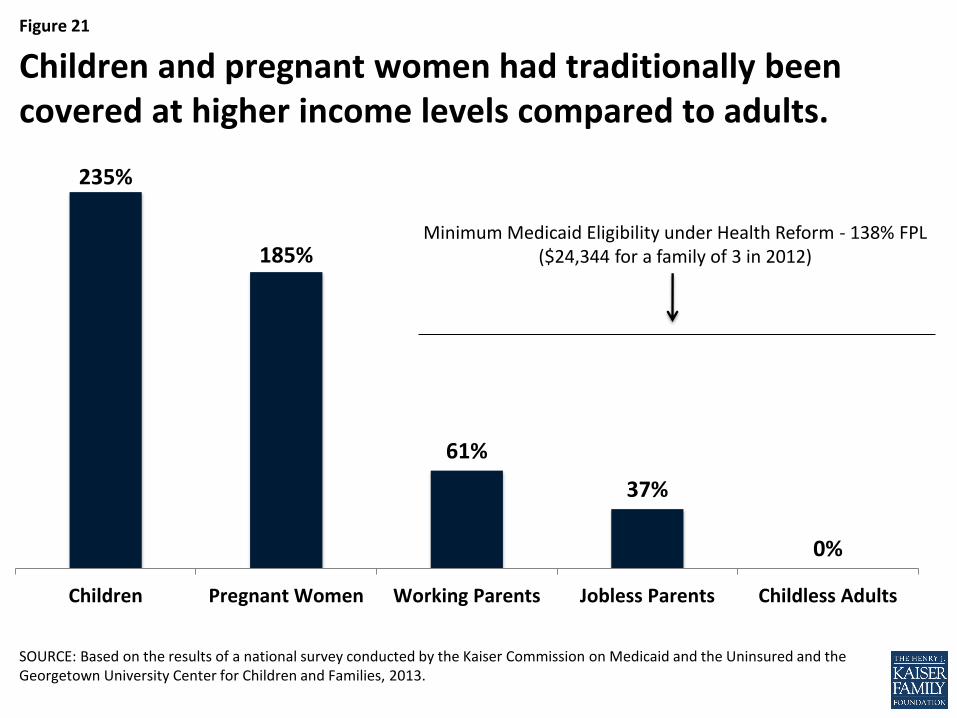
Figure 21
SOURCE: Based on the results of a national survey conducted by the Kaiser Commission on Medicaid and the Uninsured and the Georgetown University Center for Children and Families, 2013.
Children and pregnant women had traditionally been covered at higher income levels compared to adults.
235%
185%
61%
37%
0%
Children Pregnant Women Working Parents Jobless Parents Childless Adults
Minimum Medicaid Eligibility under Health Reform - 138% FPL ($24,344 for a family of 3 in 2012)
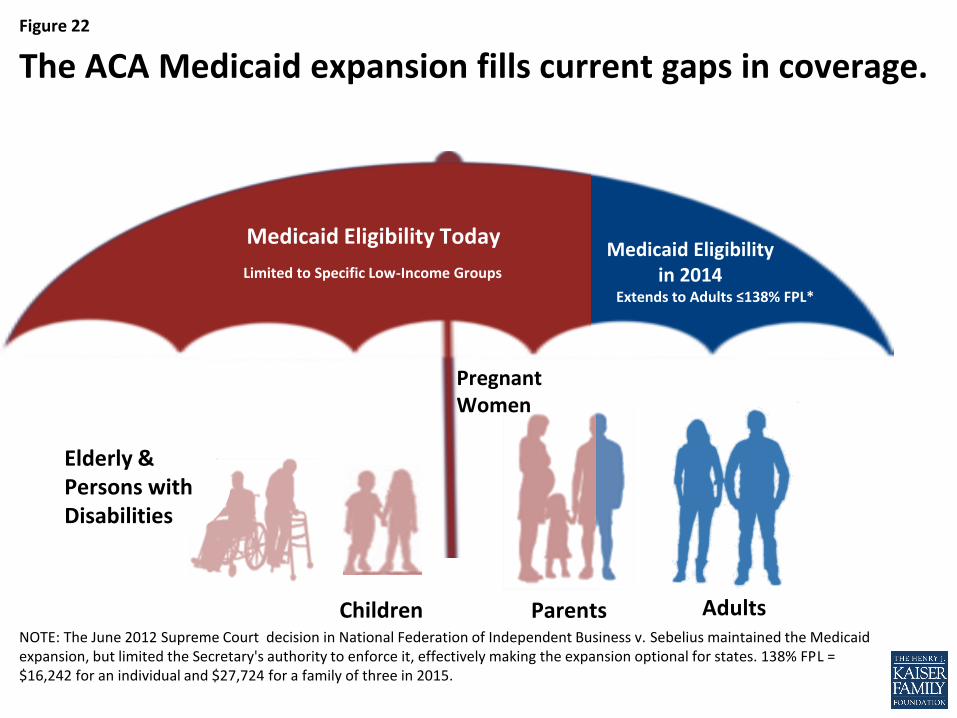
Figure 22
NOTE: The June 2012 Supreme Court decision in National Federation of Independent Business v. Sebelius maintained the Medicaid expansion, but limited the Secretary's authority to enforce it, effectively making the expansion optional for states. 138% FPL = $16,242 for an individual and $27,724 for a family of three in 2015.
The ACA Medicaid expansion fills current gaps in coverage.
Adults
Elderly & Persons with Disabilities
Parents
Pregnant Women
Children
Extends to Adults
≤138% FPL*
Medicaid Eligibility Today Medicaid Eligibility
in 2014 Limited to Specific Low-Income Groups
Extends to Adults ≤138% FPL*
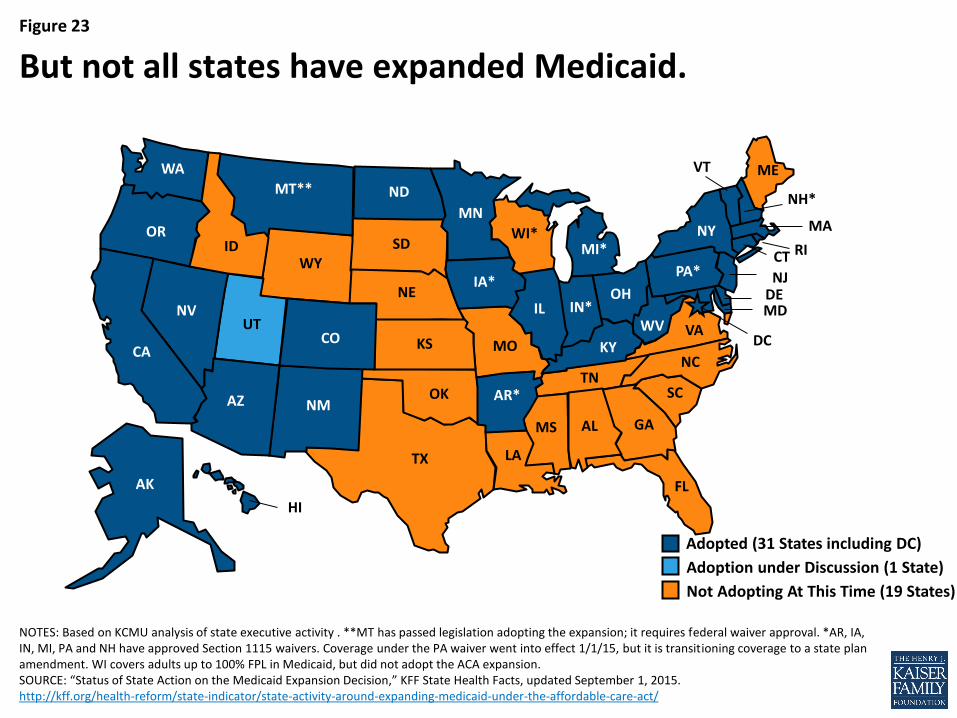
Figure 23
NOTES: Based on KCMU analysis of state executive activity . **MT has passed legislation adopting the expansion; it requires federal waiver approval. *AR, IA, IN, MI, PA and NH have approved Section 1115 waivers. Coverage under the PA waiver went into effect 1/1/15, but it is transitioning coverage to a state plan amendment. WI covers adults up to 100% FPL in Medicaid, but did not adopt the ACA expansion. SOURCE: “Status of State Action on the Medicaid Expansion Decision,” KFF State Health Facts, updated September 1, 2015. http://kff.org/health-reform/state-indicator/state-activity-around-expanding-medicaid-under-the-affordable-care-act/
But not all states have expanded Medicaid.
WY
WI*
WV
WA
VA
VT
UT
TX
TN
SD
SC
RI
PA*
OR
OK
OH
ND
NC
NY
NM
NJ
NH*
NV NE
MT**
MO
MS
MN
MI*
MA
MD
ME
LA
KY KS
IA*
IN* IL
ID
HI
GA
FL
DC
DE
CT
CO
CA
AR* AZ
AK
AL
Adopted (31 States including DC)
Adoption under Discussion (1 State)
Not Adopting At This Time (19 States)
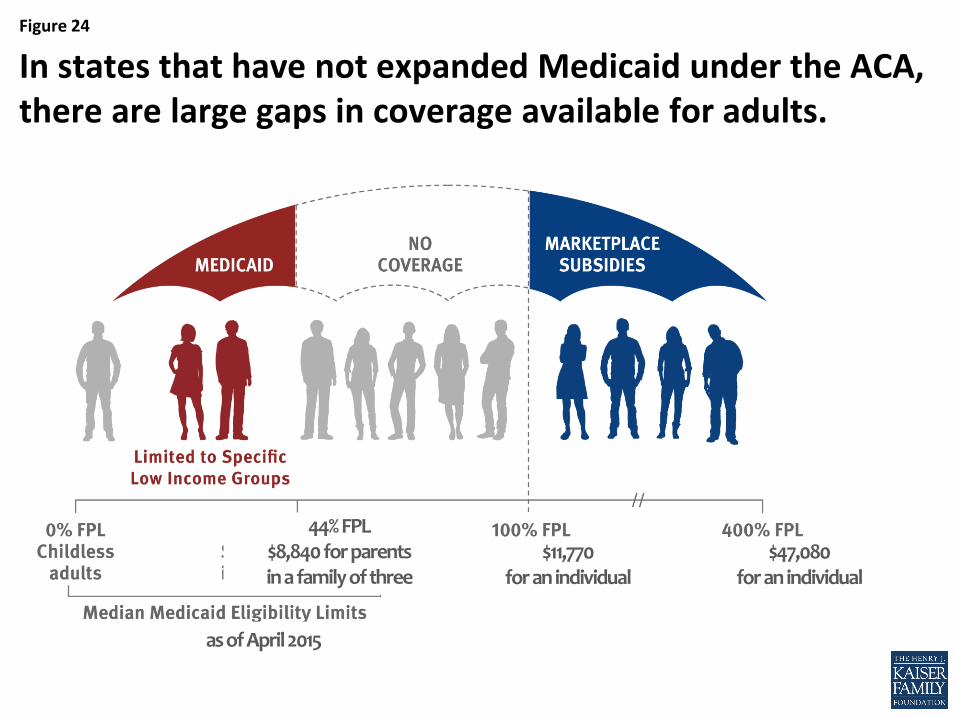
Figure 24
In states that have not expanded Medicaid under the ACA, there are large gaps in coverage available for adults.
as of October 2014 as of April 2015
44% FPL $8,840 for parents in a family of three
$11,770 for an individual
$47,080 for an individual
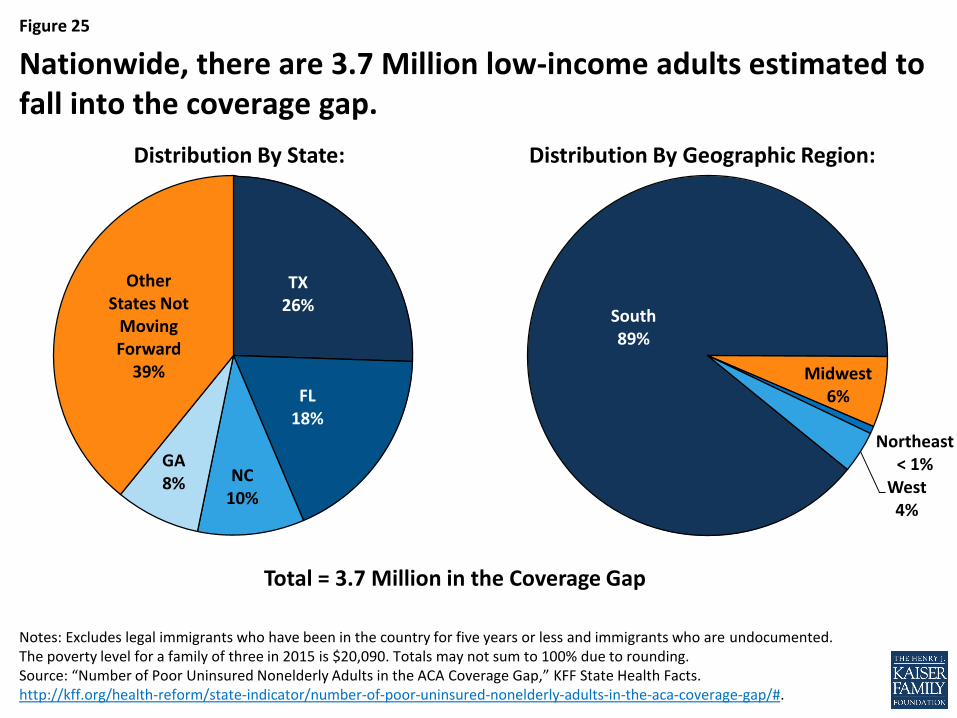
Figure 25
Notes: Excludes legal immigrants who have been in the country for five years or less and immigrants who are undocumented. The poverty level for a family of three in 2015 is $20,090. Totals may not sum to 100% due to rounding. Source: “Number of Poor Uninsured Nonelderly Adults in the ACA Coverage Gap,” KFF State Health Facts. http://kff.org/health-reform/state-indicator/number-of-poor-uninsured-nonelderly-adults-in-the-aca-coverage-gap/#.
Nationwide, there are 3.7 Million low-income adults estimated to fall into the coverage gap.
TX 26%
FL 18%
NC 10%
GA 8%
Other States Not
Moving Forward
39%
South 89%
Midwest 6%
Northeast < 1%
West 4%
Total = 3.7 Million in the Coverage Gap
Distribution By Geographic Region: Distribution By State:
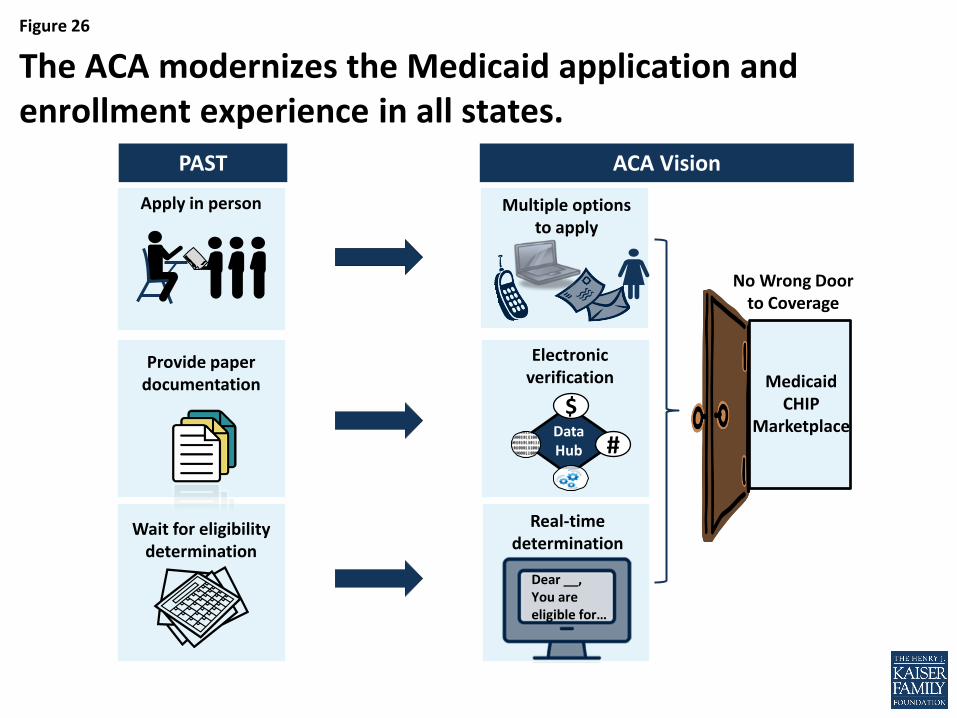
Figure 26
The ACA modernizes the Medicaid application and enrollment experience in all states.
ACA Vision PAST
Real-time determination
Data Hub
$
#
Dear __, You are eligible for…
Apply in person Multiple options to apply
Provide paper documentation
Electronic verification
Wait for eligibility determination
Medicaid CHIP
Marketplace
No Wrong Door to Coverage
Figure 27
While other key reforms bolster primary care and focus on transforming care delivery and payment systems.
• Increased Medicare and Medicaid payments for primary care
• Investment in community health centers
• Health care workforce development
• Emphasis on prevention
• Patient-centered medical home and accountable care models
– Health homes for Medicaid beneficiaries with chronic conditions
• Shift away from fee-for-service toward value-based payment
• New options for home and community-based long-term services and supports
Figure 28
• Coverage (Eligibility, Outreach and Enrollment)
– Will state decisions to implement the Medicaid expansion change?
– How will the ACA affect Medicaid enrollment? Uninsured?
– How well will new enrollment systems work and how well will systems be coordinated across health programs?
– What outreach strategies work best, least?
• Financing and Fiscal Issues
– What effect will the ACA have on state and federal Medicaid spending? Will the ACA Medicaid expansion have other fiscal effects (reductions in uncompensated care or other indigent care funding, broader economic effects, effects for providers)
• Access to and Delivery of Services
– How will increased Medicaid coverage affect access to health care and services - and ultimately health outcomes?
– How will delivery system changes affect access to care?
– What new innovations will be successful in integrating care for complex populations (duals demonstrations)
Medicaid Policy Issues Going Forward