Embed Size (px)
Citation preview
1
Practical guide to using post-market safety
data to target medical device innovation
How you can use DeviceMatters data to understand safety
issues and market needs for targeted quality improvements
April 2012
2
Terms of use
The materials and information within this presentation are for your information only. Acelly LLC does not
practice medicine or provide medical services or advice, and the information in this presentation should not be
considered medical advice. The information in this report is provided "as is" and should not be relied upon for
any specific purpose. Further, there are limitations inherent in electronic data indexing, and this report might
not have captured all relevant data through the coverage date indicated. Acelly LLC, Qmed (a UBM brand)
and its affiliates do not make, and hereby disclaim, any representation or warranty as to this presentation's
accuracy, completeness, merchantability, or fitness for a particular purpose. Acelly LLC, Qmed (a UBM brand)
and its affiliates shall not be liable to you for any losses suffered (including, without limitation, damages for
any consequential loss or loss of business opportunities or projects, or loss of profits), whether in contract, tort
or otherwise from your use of this presentation or its contents, or from any action or omission taken as a result
of using this report or its contents.
www.devicematters.com
3
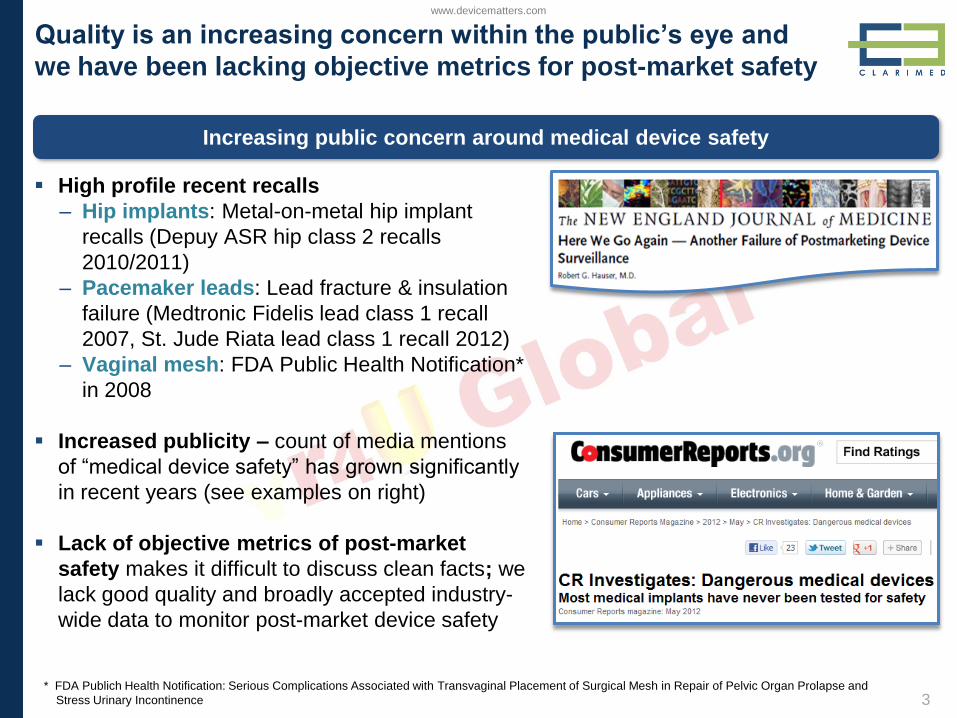
Increasing public concern around medical device safety
Quality is an increasing concern within the public’s eye and
we have been lacking objective metrics for post-market safety
High profile recent recalls
– Hip implants: Metal-on-metal hip implant
recalls (Depuy ASR hip class 2 recalls
2010/2011)
– Pacemaker leads: Lead fracture & insulation
failure (Medtronic Fidelis lead class 1 recall
2007, St. Jude Riata lead class 1 recall 2012)
– Vaginal mesh: FDA Public Health Notification*
in 2008
Increased publicity – count of media mentions
of “medical device safety” has grown significantly
in recent years (see examples on right)
Lack of objective metrics of post-market
safety makes it difficult to discuss clean facts; we
lack good quality and broadly accepted industry-
wide data to monitor post-market device safety
* FDA Publich Health Notification: Serious Complications Associated with Transvaginal Placement of Surgical Mesh in Repair of Pelvic Organ Prolapse and
Stress Urinary Incontinence
www.devicematters.com

4
With good post-market quality metrics, we could achieve a lot
Spot quality
trends
Identify quality
gaps
Track and
compare safety
performance
Understand
risk factors
Early alert for potential quality and safety issues
Identify opportunities for safer next generation
solutions
Learn when & why things go wrong post-market
to design an improved next generation product
Help strategy teams identify patient needs
Drive product strategy to help differentiate
products based on post-market quality & safety
Refine marketing messages for existing products
Refine target populations and corresponding
marketing messages based on typical device
failure modes
www.devicematters.com
5
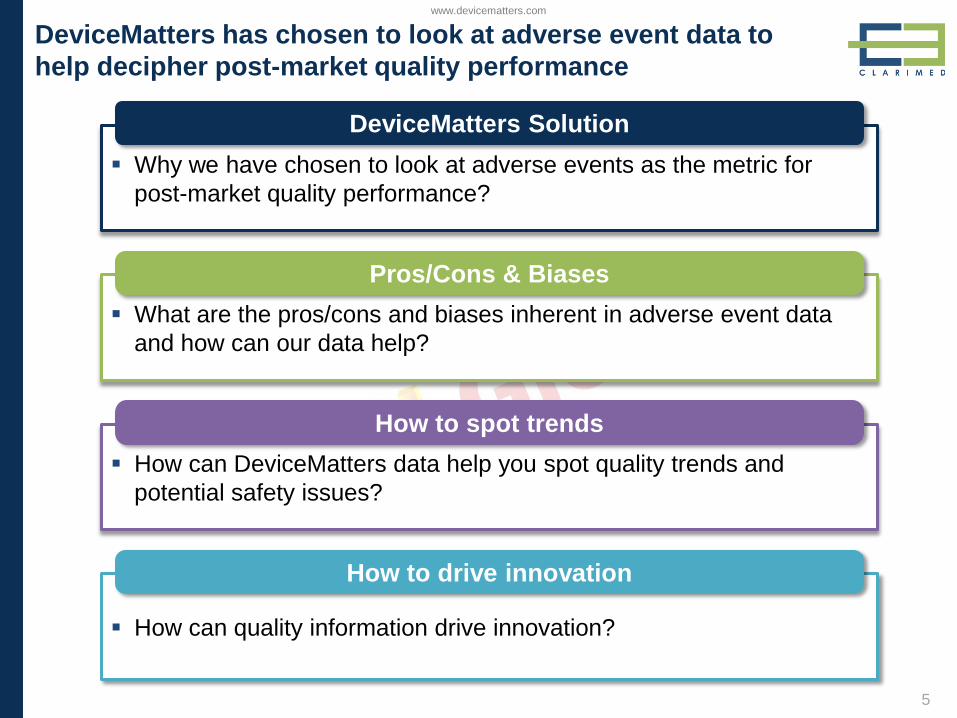
DeviceMatters has chosen to look at adverse event data to
help decipher post-market quality performance
How can quality information drive innovation?
Why we have chosen to look at adverse events as the metric for
post-market quality performance?
DeviceMatters Solution
What are the pros/cons and biases inherent in adverse event data
and how can our data help?
Pros/Cons & Biases
How to drive innovation
How can DeviceMatters data help you spot quality trends and
potential safety issues?
How to spot trends
www.devicematters.com
6
Quiz
200,000
100,00050,000
How many adverse event reports do you believe
were filed for medical devices in 2011?
400,000B.
A.
D.
C.
www.devicematters.com
7
Quiz
200,000
100,00050,000
How many adverse event reports do you believe
were filed for medical devices in 2011?
400,000B.
A.
D.
C.
www.devicematters.com
8
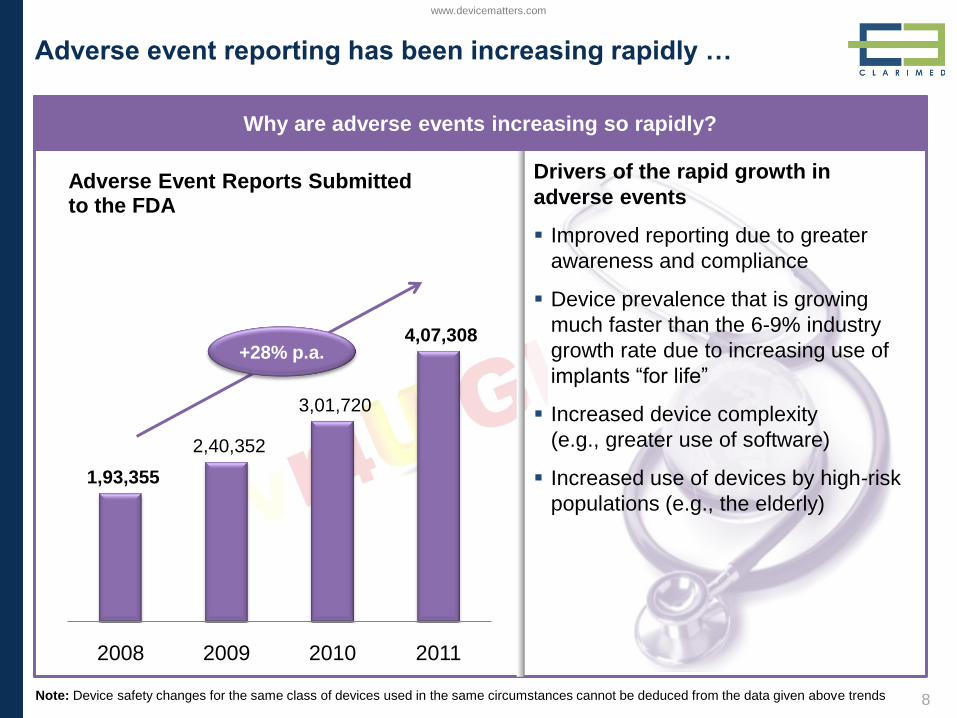
Adverse event reporting has been increasing rapidly …
Note: Device safety changes for the same class of devices used in the same circumstances cannot be deduced from the data given above trends
1,93,355
2,40,352
3,01,720
4,07,308
2008 2009 2010 2011
Adverse Event Reports Submitted to the FDA
+28% p.a.
Why are adverse events increasing so rapidly?
Drivers of the rapid growth in
adverse events
Improved reporting due to greater
awareness and compliance
Device prevalence that is growing
much faster than the 6-9% industry
growth rate due to increasing use of
implants “for life”
Increased device complexity
(e.g., greater use of software)
Increased use of devices by high-risk
populations (e.g., the elderly)
www.devicematters.com
9
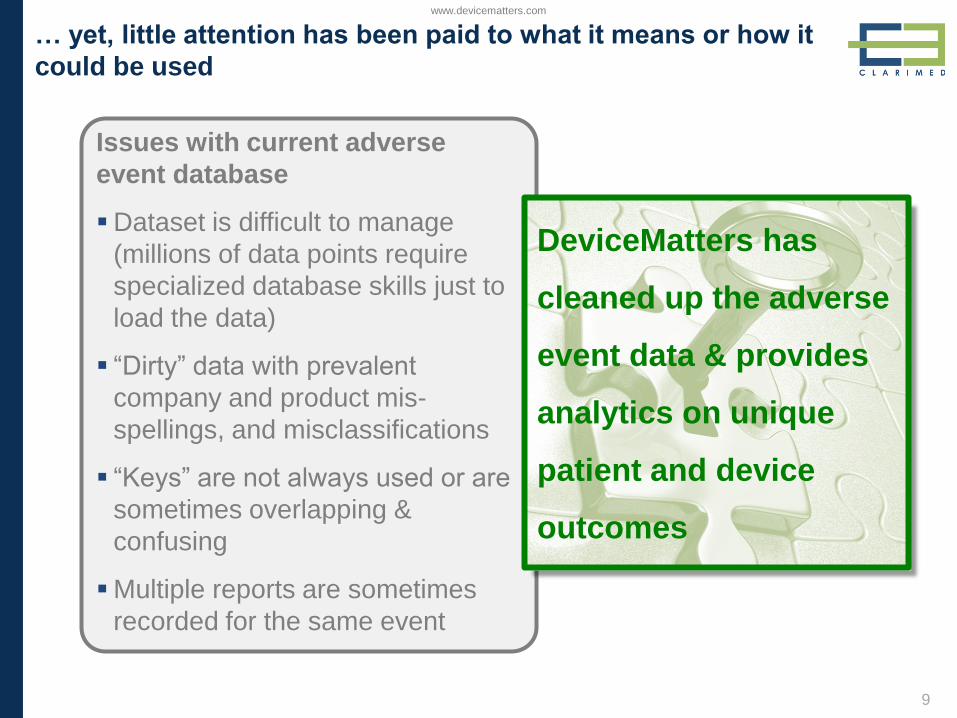
… yet, little attention has been paid to what it means or how it
could be used
Issues with current adverse
event database
Dataset is difficult to manage
(millions of data points require
specialized database skills just to
load the data)
“Dirty” data with prevalent
company and product mis-
spellings, and misclassifications
“Keys” are not always used or are
sometimes overlapping &
confusing
Multiple reports are sometimes
recorded for the same event
DeviceMatters has
cleaned up the adverse
event data & provides
analytics on unique
patient and device
outcomes
www.devicematters.com
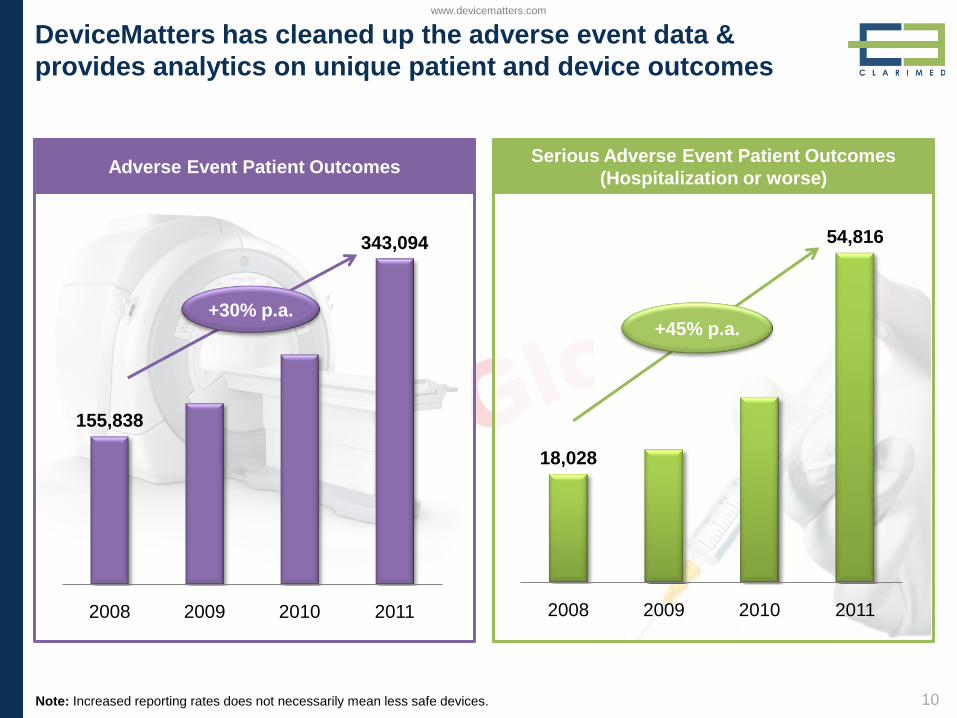
10
Adverse Event Patient Outcomes
155,838
343,094
2008 2009 2010 2011
Serious Adverse Event Patient Outcomes
(Hospitalization or worse)
18,028
54,816
2008 2009 2010 2011
DeviceMatters has cleaned up the adverse event data &
provides analytics on unique patient and device outcomes
+30% p.a.+45% p.a.
Note: Increased reporting rates does not necessarily mean less safe devices.
www.devicematters.com
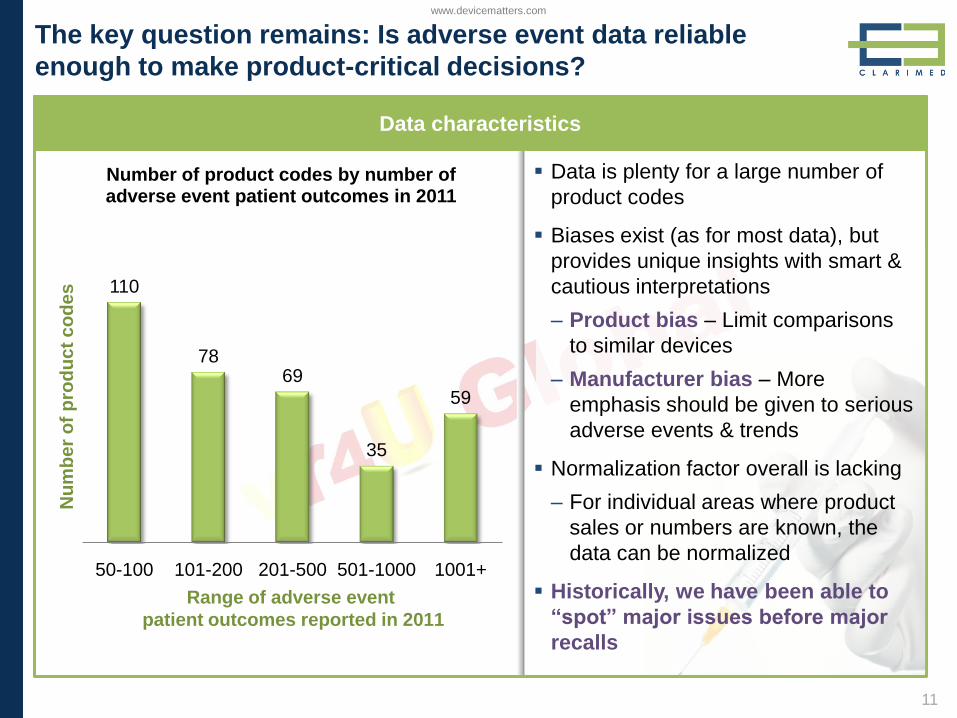
11
The key question remains: Is adverse event data reliable
enough to make product-critical decisions?
110
7869
35
59
50-100 101-200 201-500 501-1000 1001+
Number of product codes by number of adverse event patient outcomes in 2011
Range of adverse event
patient outcomes reported in 2011
Nu
mb
er
of
pro
du
ct
co
de
s
Data characteristics
Data is plenty for a large number of
product codes
Biases exist (as for most data), but
provides unique insights with smart &
cautious interpretations
– Product bias – Limit comparisons
to similar devices
– Manufacturer bias – More
emphasis should be given to serious
adverse events & trends
Normalization factor overall is lacking
– For individual areas where product
sales or numbers are known, the
data can be normalized
Historically, we have been able to
“spot” major issues before major
recalls
www.devicematters.com
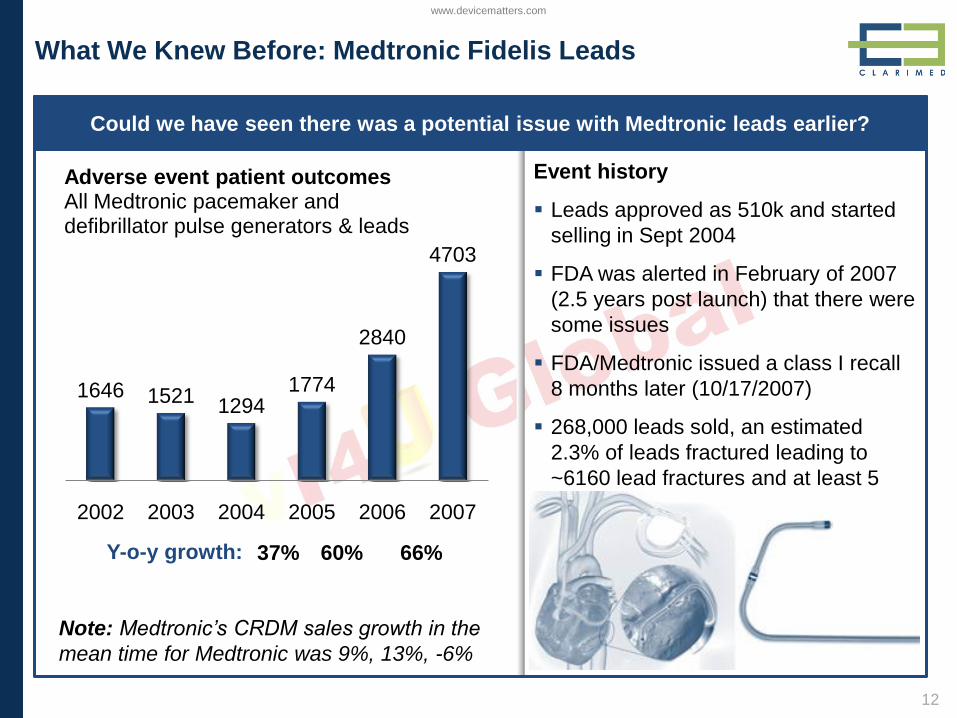
12
What We Knew Before: Medtronic Fidelis Leads
Event history
Leads approved as 510k and started
selling in Sept 2004
FDA was alerted in February of 2007
(2.5 years post launch) that there were
some issues
FDA/Medtronic issued a class I recall
8 months later (10/17/2007)
268,000 leads sold, an estimated
2.3% of leads fractured leading to
~6160 lead fractures and at least 5
deaths
1646 15211294
1774
2840
4703
2002 2003 2004 2005 2006 2007
Adverse event patient outcomesAll Medtronic pacemaker and defibrillator pulse generators & leads
37% 60% 66%Y-o-y growth:
Note: Medtronic’s CRDM sales growth in the
mean time for Medtronic was 9%, 13%, -6%
Could we have seen there was a potential issue with Medtronic leads earlier?
www.devicematters.com
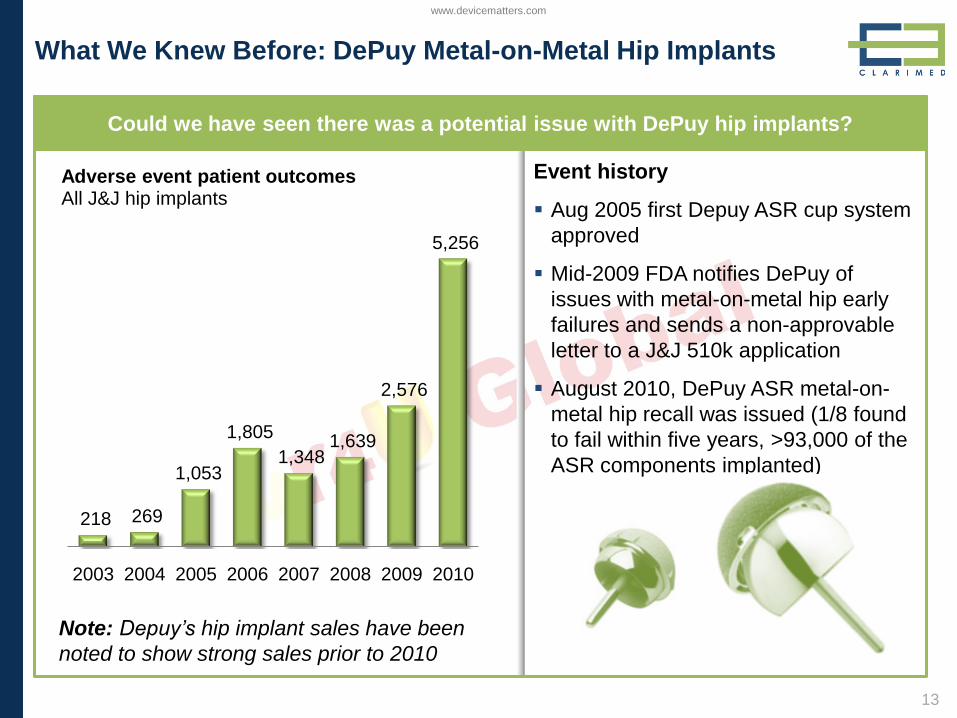
13
What We Knew Before: DePuy Metal-on-Metal Hip Implants
Event history
Aug 2005 first Depuy ASR cup system
approved
Mid-2009 FDA notifies DePuy of
issues with metal-on-metal hip early
failures and sends a non-approvable
letter to a J&J 510k application
August 2010, DePuy ASR metal-on-
metal hip recall was issued (1/8 found
to fail within five years, >93,000 of the
ASR components implanted)
Note: Depuy’s hip implant sales have been
noted to show strong sales prior to 2010
218 269
1,053
1,805
1,348 1,639
2,576
5,256
2003 2004 2005 2006 2007 2008 2009 2010
Adverse event patient outcomesAll J&J hip implants
Could we have seen there was a potential issue with DePuy hip implants?
www.devicematters.com
14
`
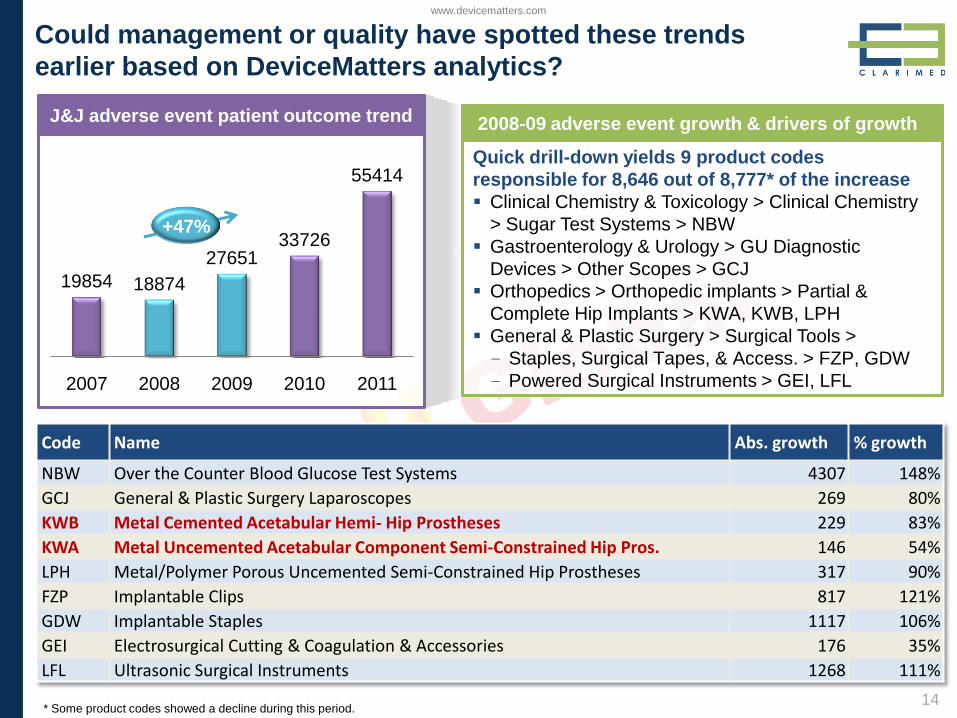
Could management or quality have spotted these trends
earlier based on DeviceMatters analytics?
J&J adverse event patient outcome trend
* Some product codes showed a decline during this period.
J&J adverse event patient outcome trend
19854 18874
2765133726
55414
2007 2008 2009 2010 2011
+47%
2008-09 adverse event growth & drivers of growth
Code Name Abs. growth % growth
NBW Over the Counter Blood Glucose Test Systems 4307 148%
GCJ General & Plastic Surgery Laparoscopes 269 80%
KWB Metal Cemented Acetabular Hemi- Hip Prostheses 229 83%
KWA Metal Uncemented Acetabular Component Semi-Constrained Hip Pros. 146 54%
LPH Metal/Polymer Porous Uncemented Semi-Constrained Hip Prostheses 317 90%
FZP Implantable Clips 817 121%
GDW Implantable Staples 1117 106%
GEI Electrosurgical Cutting & Coagulation & Accessories 176 35%
LFL Ultrasonic Surgical Instruments 1268 111%
Quick drill-down yields 9 product codes
responsible for 8,646 out of 8,777* of the increase
Clinical Chemistry & Toxicology > Clinical Chemistry
> Sugar Test Systems > NBW
Gastroenterology & Urology > GU Diagnostic
Devices > Other Scopes > GCJ
Orthopedics > Orthopedic implants > Partial &
Complete Hip Implants > KWA, KWB, LPH
General & Plastic Surgery > Surgical Tools >
– Staples, Surgical Tapes, & Access. > FZP, GDW
– Powered Surgical Instruments > GEI, LFL
www.devicematters.com
15
`
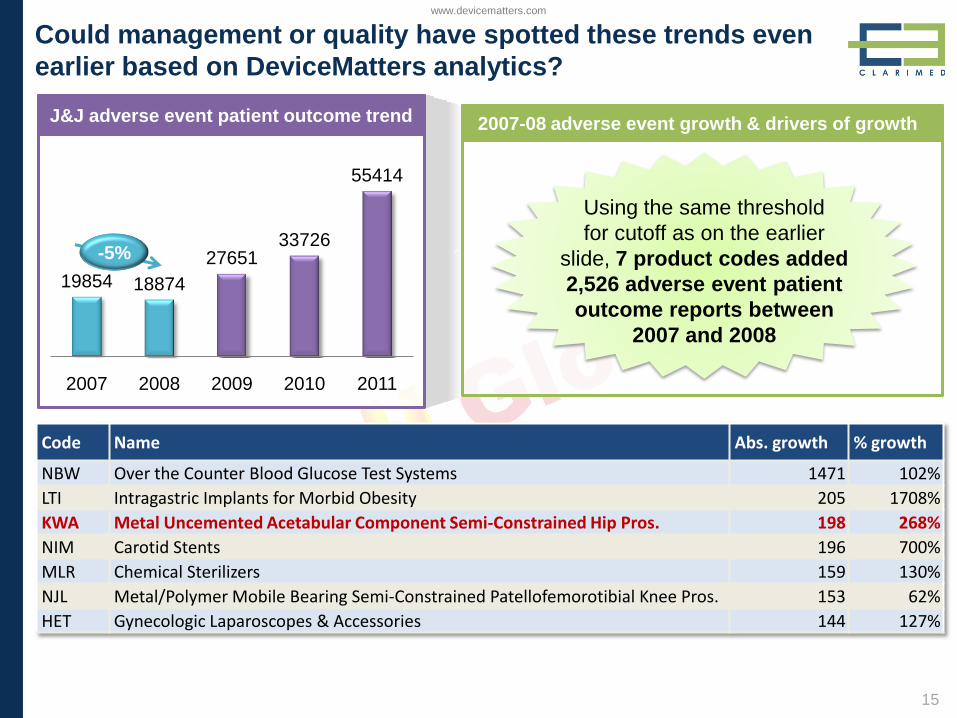
Could management or quality have spotted these trends even
earlier based on DeviceMatters analytics?
J&J adverse event patient outcome trendJ&J adverse event patient outcome trend
19854 18874
2765133726
55414
2007 2008 2009 2010 2011
-5%
2007-08 adverse event growth & drivers of growth
Code Name Abs. growth % growth
NBW Over the Counter Blood Glucose Test Systems 1471 102%
LTI Intragastric Implants for Morbid Obesity 205 1708%
KWA Metal Uncemented Acetabular Component Semi-Constrained Hip Pros. 198 268%
NIM Carotid Stents 196 700%
MLR Chemical Sterilizers 159 130%
NJL Metal/Polymer Mobile Bearing Semi-Constrained Patellofemorotibial Knee Pros. 153 62%
HET Gynecologic Laparoscopes & Accessories 144 127%
Using the same threshold
for cutoff as on the earlier
slide, 7 product codes added
2,526 adverse event patient
outcome reports between
2007 and 2008
www.devicematters.com
16
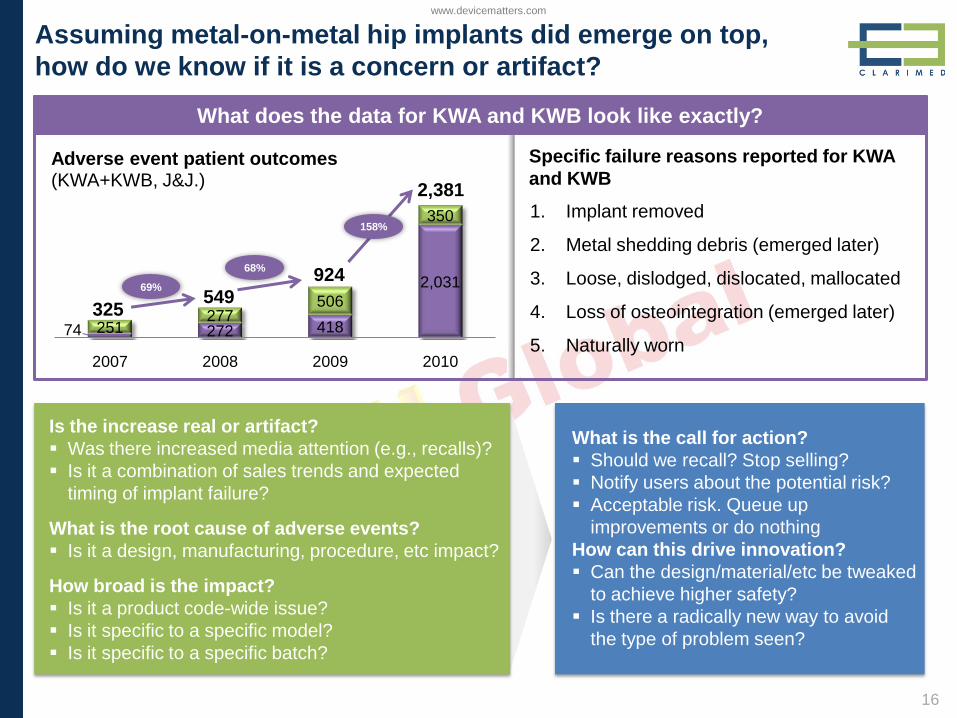
Assuming metal-on-metal hip implants did emerge on top,
how do we know if it is a concern or artifact?
74 272 418
2,031
251277
506
350
2007 2008 2009 2010
Adverse event patient outcomes (KWA+KWB, J&J.)
1. Implant removed
2. Metal shedding debris (emerged later)
3. Loose, dislodged, dislocated, mallocated
4. Loss of osteointegration (emerged later)
5. Naturally worn
Specific failure reasons reported for KWA
and KWB
What is the call for action?
Should we recall? Stop selling?
Notify users about the potential risk?
Acceptable risk. Queue up
improvements or do nothing
How can this drive innovation?
Can the design/material/etc be tweaked
to achieve higher safety?
Is there a radically new way to avoid
the type of problem seen?
325549
924
2,381
What does the data for KWA and KWB look like exactly?
Is the increase real or artifact?
Was there increased media attention (e.g., recalls)?
Is it a combination of sales trends and expected
timing of implant failure?
What is the root cause of adverse events?
Is it a design, manufacturing, procedure, etc impact?
How broad is the impact?
Is it a product code-wide issue?
Is it specific to a specific model?
Is it specific to a specific batch?
69%
68%
158%
www.devicematters.com
17
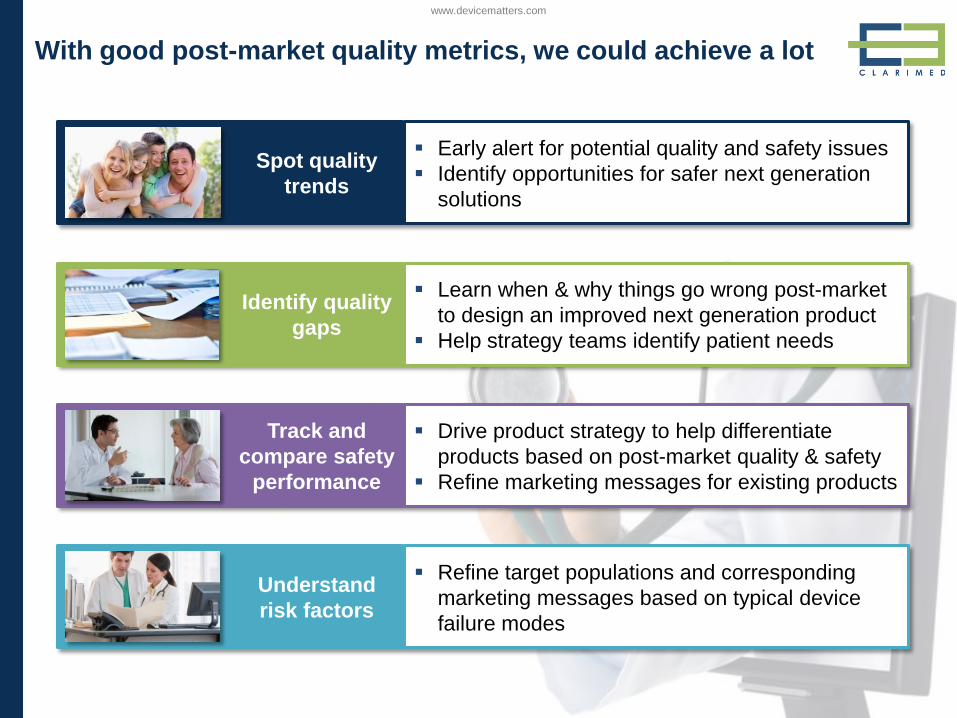
With good post-market quality metrics, we could achieve a lot
Spot quality
trends
Identify quality
gaps
Track and
compare safety
performance
Understand
risk factors
Early alert for potential quality and safety issues
Identify opportunities for safer next generation
solutions
Learn when & why things go wrong post-market
to design an improved next generation product
Help strategy teams identify patient needs
Drive product strategy to help differentiate
products based on post-market quality & safety
Refine marketing messages for existing products
Refine target populations and corresponding
marketing messages based on typical device
failure modes
www.devicematters.com
18
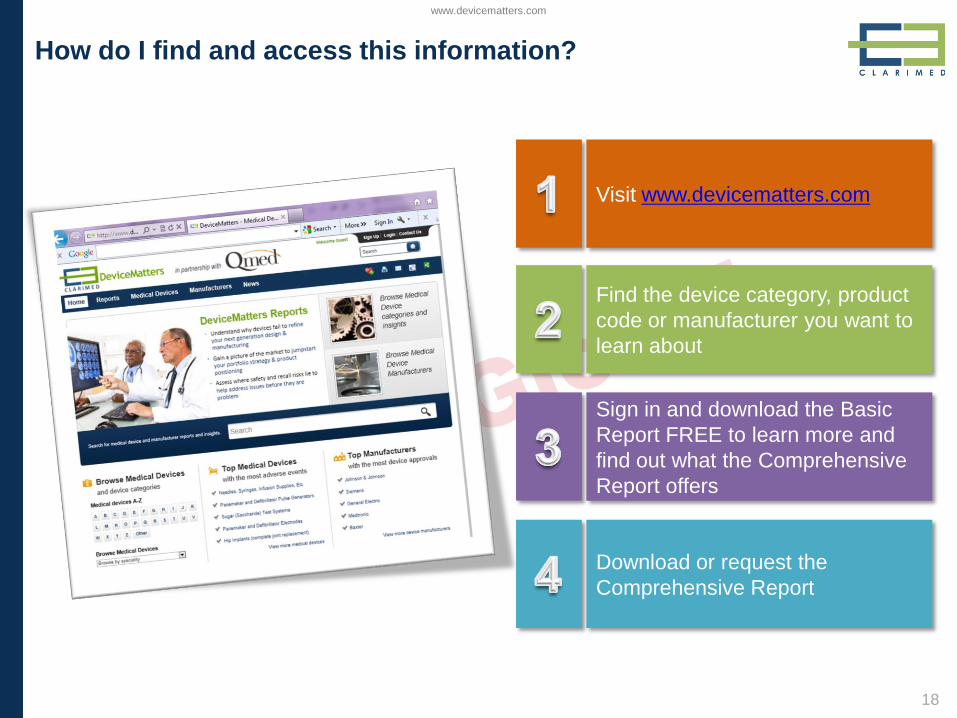
How do I find and access this information?
Visit www.devicematters.com
Sign in and download the Basic
Report FREE to learn more and
find out what the Comprehensive
Report offers
Find the device category, product
code or manufacturer you want to
learn about
Download or request the
Comprehensive Report
www.devicematters.com
19
Contact Us
TERMS OF USE
The materials and information within this presentation are for your information only. Acelly LLC does not practice medicine or provide
medical services or advice, and the information in this presentation should not be considered medical advice. The information in this
report is provided "as is" and should not be relied upon for any specific purpose. Further, there are limitations inherent in electronic
data indexing, and this report might not have captured all relevant data through the coverage date indicated. Acelly LLC, Qmed (a
UBM brand) and its affiliates do not make, and hereby disclaim, any representation or warranty as to this presentation's accuracy,
completeness, merchantability, or fitness for a particular purpose. Acelly LLC, Qmed (a UBM brand) and its affiliates shall not be liable
to you for any losses suffered (including, without limitation, damages for any consequential loss or loss of business opportunities or
projects, or loss of profits), whether in contract, tort or otherwise from your use of this presentation or its contents, or from any action or
omission taken as a result of using this report or its contents.
Clarimed & DeviceMatters
www.devicematters.com
Qmed, a UBM Canon brand
www.qmed.com
http://www.qmed.com/contact-us
www.devicematters.com