Embed Size (px)
Citation preview

www.medtecheurope.org 1
Yves Verboven
Director, Market Access & Economic Policies
Procurement, “the” cornerstone to access to novel Medical Technology in Europe.

www.medtecheurope.org 2
MedTech Industry Association
Alliance
Medical Devices
In-Vitro Diagnostics
MedTech Europe

3


THE EUROPEAN MEDTECH
INDUSTRY IN FIGURES
2014
www.medtecheurope.org

European MedTech Imports, Exports & Trade balance
www.medtecheurope.org 6
Medical devices and Imaging excluding in-vitro diagnostics. Europe refers to EU (excluding Cyprus, Luxembourg, Malta) +
Norway, Switzerland.
Data related to total exports and total imports include EU intra-trade. Trade balance refers to external trade balance.
Source: Espicom, Eucomed calculations.
6.0 7.1 8.0 7.3
13.2 14.6 15.8 15.2
55
58
63 64
74
78
84 80
49 51
55 57 61
64
68 65
0.0
10.0
20.0
30.0
40.0
50.0
60.0
70.0
80.0
90.0
2006 2007 2008 2009 2010 2011 2012 2013
bill
ion
EU
R
Trade balance
Exports
Imports

Employment comparison
www.medtecheurope.org 7
575,000
520,000
675,000
-
100,000
200,000
300,000
400,000
500,000
600,000
700,000
800,000
European MedTech industry US MedTech industry European pharmaceuticalindustry
num
ber
of people
em
plo
yed
Europe refers to EU + Norway, Switzerland. Latest year available.
Source: Eurostat, Eucomed calculations based on the data obtained from National Associations of 15 countries. Countries with
(partially) provided data: Belgium, Czech Republic, Denmark, France, Germany, Greece, Ireland, Italy, Netherlands, Poland,
Portugal, Spain, Sweden, UK, Switzerland.
EFPIA – The Pharmaceutical Industry in Figures. Key Data 2013.
S. Tripp, M. Grueber, R. Helwig - The Economic Impact of the U.S. Advanced Medical Technology Industry, Battelle Technology
Partnership Practice, March 2012.

Number of people employed in the MedTech industry
per 10,000 inhabitants
www.medtecheurope.org 8
Source: Eurostat, Eucomed calculations based on the data obtained from National Associations.
USA data source: S. Tripp, M. Grueber, R. Helwig - The Economic Impact of the U.S. Advanced Medical Technology Industry,
Battelle Technology Partnership Practice, March 2012.

Trade
Europe’s MedTech trade surplus in 2013 is estimated at €15 billion,
more than a twofold increase since 2006.
Countries with the highest trade surplus* are Germany, Ireland and Switzerland
www.medtecheurope.org 9
*including EU intra-trade
Medical technology excluding in vitro diagnostics. Europe refers to EU (excluding Cyprus, Luxembourg, Malta) + Norway, Switzerland.
Source: Espicom, Eucomed calculations.

MEDTECH
www.medtecheurope.org

www.medtecheurope.org 11

MedTech Industry - A Diverse Sector
There are more than 500,000 medical technologies registered ,
ranging from syringes, bandages, In-vitro diagnostics to eye
implants and artificial limbs (20,000 generic groups)
Source: Global Medical Devices Nomenclature (GMDN) Agency, 2010 www.medtecheurope.org

Diversity and classification of medical technology
www.medtecheurope.org 13
1The classification of medical devices is a ‘risk based’ system based on the vulnerability of the human body taking account of the
potential risks associated with the devices. The classification rules are based on different criteria such as the duration of contact with the
patient, the degree of invasiveness and the part of the body affected by the use of the device. 2IVD classification is based on the degree of health risk posed to an individual and public, and is related to the risk of an incorrect result
arising from the use of the IVD.
Source: European Commission.

Medical technology market estimates by area and sales growth
www.medtecheurope.org 14
World, 2013-2020
Source: World Preview 2013, Outlook to 2018: The Future of Medtech, EvaluateMedTech™, September 2013.

INNOVATION
www.medtecheurope.org

Top technical fields in patent applications
www.medtecheurope.org 16
Analysis based on European patent applications filed with the EPO in 2013 (Direct European applications filed in 2013 and
International (PCT) applications entering the European phase in 2013), including divisional applications filed during the year.
Based on the WIPO IPC-Technology concordance as revised in January 2013.
Source: European Patent Office
Number of patent applications filed, by field, 2013
41%
39%
20%

Evolution of European patent applications by technical field
2004-2013
www.medtecheurope.org 17
Analysis based on European patent applications filed with the EPO from 2004 to 2013 (Direct European applications filed and
International (PCT) applications entering the European phase in these years), including divisional applications filed during the year.
Based on the WIPO IPC-Technology concordance as revised in January 2013.
Source: European Patent Office
0
2 000
4 000
6 000
8 000
10 000
12 000
Nu
mb
er
of p
ate
nt a
pp
lica
tion
s f
iled w
ith
EP
O
Medical technology Pharmaceuticals Biotechnology

MedTech Companies in Europe
almost 25,000 medical technology companies
www.medtecheurope.org 18
Europe refers to EU + Norway, Switzerland. An enterprise is considered to be an SME if it employs fewer than 250 persons and has
an annual turnover not exceeding €50 million.
Source: Eucomed calculations based on the data obtained from National Associations of 15 countries for the latest year available.
Countries with (partially) provided data: Belgium, Czech Republic, Denmark, France, Germany, Greece, Ireland, Italy, Netherlands,
Poland, Portugal, Spain, Sweden, UK, Switzerland.

European MedTech market
Is estimated at roughly
www.medtecheurope.org 19
Europe refers to EU + Norway, Switzerland. Market size refers to the total annual value of products sold in Europe in the final
purchaser’s prices, i.e. the total amount spent from public and private sources on medical technology.
Source: WHO Global Health Expenditure Database, Eurostat, Eucomed calculations based on the data obtained from National
Associations of 15 countries for the latest year available. Countries with (partially) provided data: Belgium, Czech Republic,
Denmark, France, Germany, Greece, Ireland, Italy, Netherlands, Poland, Portugal, Spain, Sweden, UK, Switzerland.

Breakdown of total healthcare expenditure in Europe
www.medtecheurope.org 20
Europe refers to EU + Switzerland, Norway. MedTech data – latest year available, healthcare expenditure data – 2010.
Source: WHO, Eurostat, EFPIA, EDMA, Eucomed calculations.

Per capita investment in various fields in Europe
in EUR, latest year available
www.medtecheurope.org 21
Weighted European average. Europe refers to EU + Norway, Switzerland.
Source: WHO Global Health Expenditure Database, Eurostat, Eucomed calculations based on the data obtained from National
Associations.

Market Access Model

www.medtecheurope.org 23
PROCUREMENT
FIRST ENTRY POINT
TO MARKET
Estimated
70% procured
www.medtecheurope.org 24
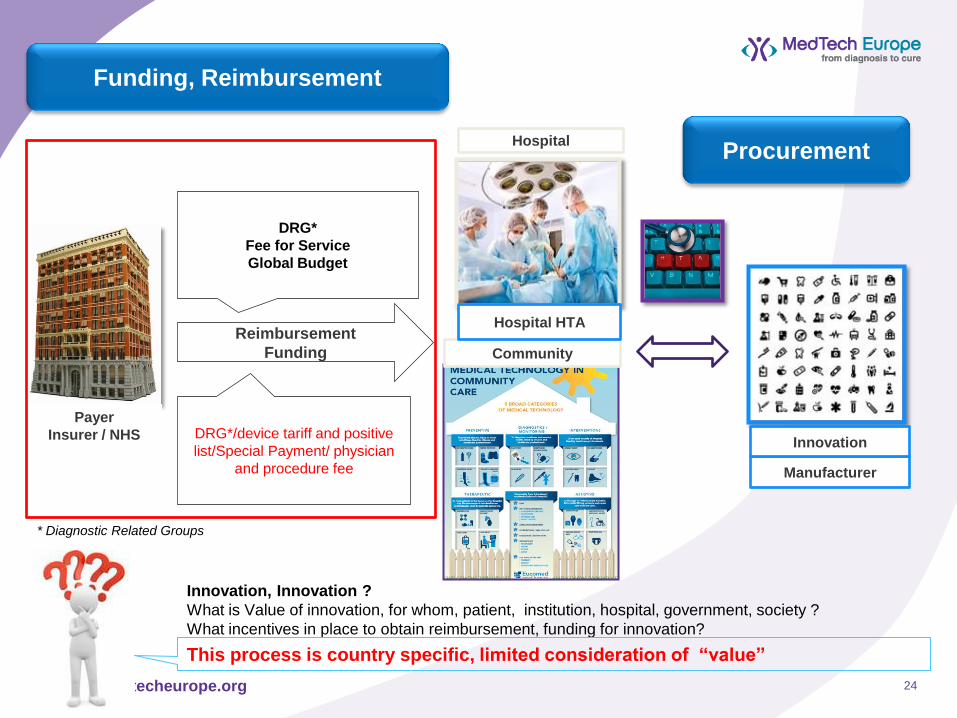
Hospital
Reimbursement
Funding
DRG*
Fee for Service
Global Budget
Innovation, Innovation ?
What is Value of innovation, for whom, patient, institution, hospital, government, society ?
What incentives in place to obtain reimbursement, funding for innovation?
This process is country specific, limited consideration of “value”
Payer
Insurer / NHS DRG*/device tariff and positive
list/Special Payment/ physician
and procedure fee Manufacturer
Innovation
Funding, Reimbursement
Community
* Diagnostic Related Groups
Procurement
Hospital HTA
Procurement of medtech innovations
Impact of procurement in the EU on the innovation
strength of the medical technology sector
Joint study, University of Twente and Simon-Kucher &
Partners commissioned by Eucomed

innovations are differentiated according to three key dimensions
Definitions
Number of substitutes
Signifies a market/product category dimension
Number of interchangeable products in the market
Level of clinician influence
Signifies a stakeholder dimension
Degree of influence of clinicians on product selection
and procurement
Influence depends on the therapeutic specialty, the
unmet need and the perceived improvement of
patient outcomes
Product conformity
Signifies a process dimension
High product conformity, i.e. fit with existing
procurement processes and demand specifications
Low product conformity, i.e. requires time and effort to
learn and process/specification adaptations and
developments on the procurement side
Low
Leve
l o
f c
lin
icia
n in
flu
en
ce
High
Low
Innovation classification cube

61 interviews with procurement bodies and industry reps were held and
systematic literature research was done
Source: Simon-Kucher & Partners; *Spain was excluded due to major changes in the healthcare system and a strong focus on cost reductions, Switzerland as a non-EU country
was included due to market relevance
30 interviews with:
Regional procurement bodies
GPOs
Individual (university) hospitals
Countries* and procurement
bodies
Sweden
Switzerland
Austria Czech Rep
Netherlands
UK
France
Poland
Italy Germany
31 interviews with:
Major medical device
companies
SMEs
Eucomed SME expert
Medtech industry
representatives
Scopus and Pubmed
databases
General studies on
procurement centralization
Product specific procurement
studies for selected products
Cost-effectiveness studies for
selected studies
Systematic literature research

A total of 11 medtech case studies were selected and analyzed which
covered all areas of the innovation classification cube
High Number of substitutes
Leve
l o
f c
lin
icia
n in
flu
en
ce
Low product conformity
High product conformity
High
1
4
11
9
8
7
10b 2a 2b
2c 3 6
Low
1 Customized OR procedure trays
2 Drug-eluting
stents
a) 1st generation
b) 2nd generation
c) 3rd generation
3 Endoprosthetics – Mobile-bearing knee
implants
4 High-end radiology equipment
5 Incontinence pants
6 Insulin pumps with CGM
7 Integrated patient monitoring systems
8 Negative pressure wound therapy
9 Safety medical devices
10 Spinal
implants
a) Cervical plates
b) Artificial disc replacement
11 Transcatheter aortic valve implantation
10a
5
Low
Mo
de
rate
Innovation classification “cube”*

Innovations
Hypotheses
DES 3rd generation
Endoprosthetics: MB knee implants*
Spinal implants: Cervical plates
High-end radiology equipment --
Customized OR procedure trays ()
Incontinence pants ()
Integrated patient monitoring systems ()
Safety medical devices ()
DES 1st / 2nd generation -- / ** -- / **
Insulin pumps with CGM
Negative pressure wound therapy
Spinal implants: Artificial disc replacement -- --
Transcatheter aortic valve implants --*** --***
Case study analysis reveals that the impact of procurement varies
29
*Latest generation **1st gen: not applicable, 2nd gen: no impact ***Predominantly not purchased through centralized/coop. procurement
Confirmed () Partly confirmed Not confirmed -- No exposure to PC
Group 1:
impact
Group 2:
Impact
depends
Group 3:
No
exposure
Increasing
procurement
centralization
Reduced short-
term price level
Reduced
innovation
adoption
Increasing
procurement
centralization
Reduced
innovation
adoption

implications of Procurement on adoption and price
level of product categories were assessed
Source: Simon-Kucher & Partners
Subject
to PC? Insights and impact
Drug-eluting
stents 3rd
generation
Procurement centralization of DES started in 2004/2005
This and other factors such as increasing competition and a study revealing
potential safety issues of DES in 2007, drove price erosion in the DES market
Today, 2nd-generation products are often considered “sufficient”. Centralized and
cooperative procurement bodies often use them as their standard products
In addition, PC’s strong focus on price leads to further price erosion and limited
opportunities to achieve price premiums for next-generation products
Endopros-
thetics: MB
knee implants
PC of mobile-bearing knee implants started in ~2002
PC drove price erosion of fixed-bearing implants and made it impossible to sustain
a price premium for mobile bearing implants, despite regular launch of new
products/next-generation products
This has led to reduced adoption of next-generation MB implants priced at a
premium over FB implants
Spinal
implants:
Cervical plates
PC of cervical plates started in ~2002/2003
Today, PC limits adoption and price potential of next-generation cervical plates due
to strong demand standardization
High-end
radiology
equipment ~
High-end equipment not yet in the focus of centralized procurement
PC (among other factors such as increasing competition) drives price erosion in
low- to mid-end radiology equipment thereby increasing the price differential to
high-end equipment
This affects adoption of high-end equipment indirectly as price premiums vs. low-
to mid-end equipment can get prohibitively high
yes ~ to limited extent no

Expenditure on MedTech
It is estimated that only around 7.5 % of
total European healthcare expenditure
is attributed to MedTech.
Procurement - >
Price only not the solution as MedTech not “the” cost-driver
www.medtecheurope.org 31
Source: WHO, Eurostat, EFPIA, EDMA, Eucomed calculations,

EU Semester – FISCAL STABILITY
www.medtecheurope.org 32
Source: European Commission

5.4 6.0
7.3
2.4
6.0
4.9
1.8
4.1
3.3
4.1 3.9 3.5
4.7
2.2
7.1
2.0
4.0
1.5
6.9
2.1
3.4 4.0
5.6
11.2
7.3
3.3
8.6
7.4
3.4
-11.6
-4.4
-6.5
-2.8
-4.6
-0.8
1.0
-0.1
-2.3
-0.6
-2.3
-1.0 -0.5
0.5 0.4
2.4
0.1
2.1
-3.7
0.7 1.3
0.5
2.6 2.4
-5.0
2.9
4.5
5.9
4.8
-11.0
-0.6
1.7
-1.4
0.9
-2.7
-4.1
-1.5
0.8
-0.7
1.3 0.6
0.1
-0.7 -0.4
-1.3
1.3
-0.6
5.2
0.9 0.5
1.4
-0.6
0.2
8.1
2.0
0.6 0.2
4.0
-12.0
-10.0
-8.0
-6.0
-4.0
-2.0
0.0
2.0
4.0
6.0
8.0
10.0
12.0
2000-2009 2010 2011
Austerity
www.medtecheurope.org 33
Annual average growth rate in health expenditure per capita, in real terms, 2000 to 2011
Source: WHO Global Health Expenditure Database, Eurostat, Eucomed calculations.

A changing environment ….
Non Communicable – Chronic Disease
Ageing
Demographic
Austerity – reduced per capita
Or Healthcare System Reform
And Investment in Health, in Medtech

Ageing … Other factors Public healthcare expenditure projections
35
AWG - Ageing Working Group of Economic Policy Committee
Source: European Commission, The 2012 Ageing Report Economic and budgetary projections for the 27 EU Member States (2010-2060)
www.medtecheurope.org
8.3%
8.9%

The burden of chronic diseases in Europe
www.medtecheurope.org 36
Source: European Chronic Disease Alliance

Demographics Driving Demand for Healthcare
www.medtecheurope.org
1.7
1.8
1.8
2.2
1.7
2.3
2.1
2.0
1,9
2.1
1.7
2.3
1.5
1.8
2.4
1.8
1.7
1.7
1.8 2.1
1.8
1.8
1.5
2.2
1.5
2.1
2.7
1.6
3.2
3.2
3.5
3.6
3.7
3.8
3.8
3.8
3.8
3.9
3.9
4.0
4.0
4.0
4.0
4.0
4.1
4.2
4.3
4.3
4.6
4.6
4.7
4.9
5.3
5.3
5.8
5.9
0.0 2.0 4.0 6.0
Germany
Italy
Greece
Sweden
Portugal
Belgium
Finland
Austria
EU27
France
Bulgaria
Denmark
Latvia
Estonia
UK
Spain
Hungary
Slovenia
Lithuania
Netherlands
Czech Republik
Malta
Romania
Luxembourg
Poland
Cyprus
Ireland
Slovakia
2060 ← 2010
2060
Difference 2010-2060
Weighted EU average.
Source: European Commission Services, Eurostat, EUROPOP2010.
Old age support ratio 2010 and 2060 (projections):
Number of people working age (15-64)
per person of pension age (65+)

Economic Growth Health Care Expenditure
Evolution of GDP vs. HC expenditure - EU28, 1995-2011
www.medtecheurope.org 38
Source: WHO Global Health Expenditure Database, Eurostat, Eucomed calculations
1.0
1.2
1.4
1.6
1.8
2.0
2.2
1995 1996 1997 1998 1999 2000 2001 2002 2003 2004 2005 2006 2007 2008 2009 2010 2011
index
Healthcareexpenditure
GDP8.8%
10.4%
% - the percentage of
GDP spent on healthcare

.
www.medtecheurope.org 39
More sustainable health system
Health as human capital
Reducing Inequalities
COST -> ”INVESTING IN HEALTH”
Health a Value in itself
Health a pre-requisite for economic growth
Improving cost efficiency and reconciling fiscal consolidation targets with
the continued provision of sufficient levels of public services
improving the health of the population in general and reinforcing
employability, thus making active employment policies more effective,
helping to secure adequate livelihoods and contributing to growth.
contributing to social cohesion and breaking the vicious spiral of
poor health contributing to, and resulting from, poverty and
exclusion.
EU Public Health Strategy

40
MEDTECH – TIME TO CHANGE HOW TO DO BUSINESS
www.medtecheurope.org
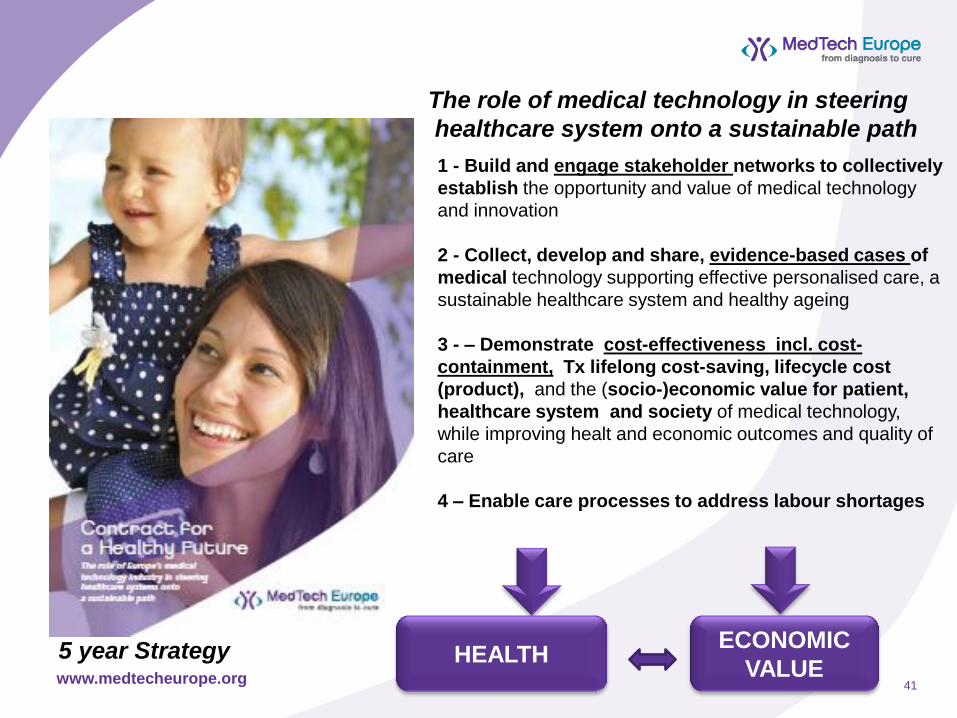
CONTRACT FOR A
HEALTHY FUTURE
www.medtecheurope.org 41
M
The role of medical technology in steering
healthcare system onto a sustainable path
5 year Strategy
1 - Build and engage stakeholder networks to collectively
establish the opportunity and value of medical technology
and innovation
2 - Collect, develop and share, evidence-based cases of
medical technology supporting effective personalised care, a
sustainable healthcare system and healthy ageing
3 - – Demonstrate cost-effectiveness incl. cost-
containment, Tx lifelong cost-saving, lifecycle cost
(product), and the (socio-)economic value for patient,
healthcare system and society of medical technology,
while improving healt and economic outcomes and quality of
care
4 – Enable care processes to address labour shortages
HEALTH ECONOMIC
VALUE
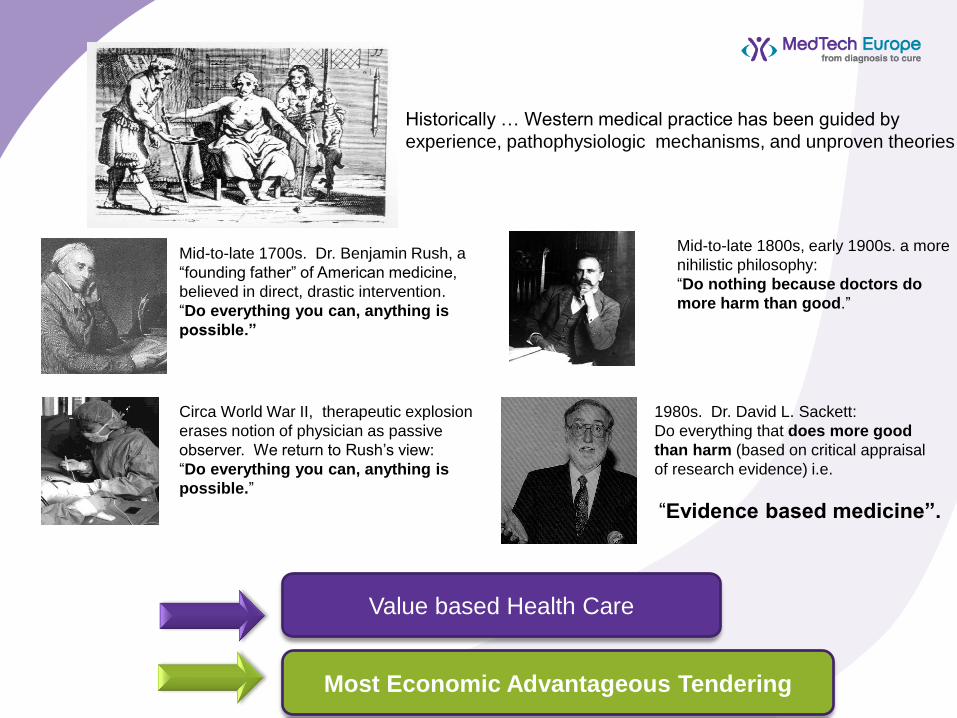
Mid-to-late 1700s. Dr. Benjamin Rush, a
“founding father” of American medicine,
believed in direct, drastic intervention.
“Do everything you can, anything is
possible.”
Mid-to-late 1800s, early 1900s. a more
nihilistic philosophy:
“Do nothing because doctors do
more harm than good.”
Circa World War II, therapeutic explosion
erases notion of physician as passive
observer. We return to Rush’s view:
“Do everything you can, anything is
possible.”
1980s. Dr. David L. Sackett:
Do everything that does more good
than harm (based on critical appraisal
of research evidence) i.e.
“Evidence based medicine”.
Historically … Western medical practice has been guided by
experience, pathophysiologic mechanisms, and unproven theories
Most Economic Advantageous Tendering
Value based Health Care

www.medtecheurope.org 43
Cost - Containment
• Avoid disease progression
• Avoid hospitalizations
• Avoid disease
• Avoid complication
• Avoid waste
• Avoid costly set-up of Tx
• Optimize most costly resources
• Product life-cycle cost
• Offer Procurement Innovation –
“Solutions”
• => “ Bleu Economy “

European Semester
the growing importance of health care and long-term care
The CSRs are related to the need to improve the fiscal sustainability of healthcare and/or long-term care systems:
BE, DE, ES, FR, MT, NL, AT, PL, PT, SI, SK;
…the need to increase their (cost-)efficiency and/or (cost-)effectiveness:
BE, BG, CZ, DE, IE, ES, HR, LV, MT, AT, PL, PT, RO, SK, FI ;
…and more specific recommendations in the areas of…
44
6
15
19
15
7
2012 2013 2014 Healthcare
Long-termcare
Graph, Table: Number of EU Member
States with country-specific
recommendations in
healthcare/long-term care
Enable Reforms

VALUE OF INVESTING IN MEDTECH
Healthcare systems
Efficient & effective
contribute to fiscal
stability and “Bleu
Economy
“Economic”
Advantageous
Patient’s/ Citizen
Income reduces
inequality
(wealth <-> health)
(Economic Growth)
Silver Economy
(Economic Growth)
Productivity
(workforce, carers)
( Economic Growth)

Public Procurement : From Cost to Value & Investment
www.medtecheurope.org 46
Tender preparation : Preliminary Market Consultation, Prior
involvement of candidates or tenderers, labels
Flexible procedures : Choice of procedures, Open
procedure, competitive procedure with negotiation,
competitive dialogue, innovation partnership
Art. 67: Contract Award Criteria
Most Economic Advantageous Tendering
Art. 68 : Life Cycle cost, Cost-Effectiveness
(incl. environmental, social, economic) – method tbd

47
MEDTECH
www.medtecheurope.org
CONTRACT FOR A
HEALTHY FUTURE
MOST ECONOMIC
ADVANTAGEOUS
TENDERING

www.medtecheurope.org 48
Procurement, “the” cornerstone to access to novel Medical Technology in Europe.