Embed Size (px)
DESCRIPTION
Citation preview

the knowledge reportcincinnati, oh
www.colliers.com/cincinnati
market indicators
*Projected change to Following Quarter
Q1 12 Q2 12*
VacancY
net aBsorPtion
construction — —
rental rate — —
Q1 2012 | industrial
oVerall VacancY rate
ABSORPTION UP AS INDUSTRIAL MARKET CONTINUES TO MOVE IN THE RIGHT DIRECTION
executiVe summarYthe greater Cincinnati industrial market started the year on a strong note, producing 706,211 square feet of positive net absorption for the first quarter of 2012. this positive momentum was carried over from 2011, as the fourth quarter finished on an upswing. the overall vacancy rate stands at 9.2% and the overall weighted asking rate for industrial properties in the first quarter was $3.31 per square foot.
northern kentuckYthe northern kentucky submarkets showed an impressive 438,011 square feet of net absorption. Most of this activity was tied to the Airport submarket, as this area posted 509,805 square feet of positive absorption. larger deals of note that contributed to this activity include Schwarz paper leasing 316,000 square feet of space at Airpark International distribution Center #1; Verst group logistics leasing 290,521 square feet of space at 1100 Burlington pike; and leanCor Supply Chain leasing 106,920 square feet of space at 2265 progress drive. rental rates at the Airport averaged $3.07 per square foot, while the Florence market was slightly higher at $3.26 per square foot.
suBurBan ohio suBmarketson the northern side of the river, tri-County/Union Centre led the way with 497,710 square feet of positive absorption. general Motors was the largest transaction of note in this submarket, as the company purchased a 394,480-square-foot building at 8752 Jacquemin drive that they were currently occupying. Most other submarkets on the ohio side showed modest gains, with the exception of lockland/evendale giving back 196,057 square feet of space. rental rates in the ohio submarkets ranged from $2.27 per square foot in hamilton to $4.76 per square foot in the western Corridor.
constructionon the construction side, one large speculative building is still under construction and several smaller build-to-suit projects are continuing to move forward. the speculative building is in Monroe, as IdI continues construction on its 553,338-square-foot distribution center at 1100 logistics way. this building is expected to be completed in May of 2012. Additional construction of speculative industrial space is not anticipated anytime soon, but we will continue to see build-to-suit projects hit our market as manufacturing continues to improve.
9 5%
10.0%
10.5%
9.0%
9.5%
4Q 0
9
1Q 1
0
2Q 1
0
3Q 1
0
4Q 1
0
1Q 1
1
2Q 1
1
3Q 1
1
4Q 1
1
1Q 1
2
transactions are believed to be accurate but not guaranteed.
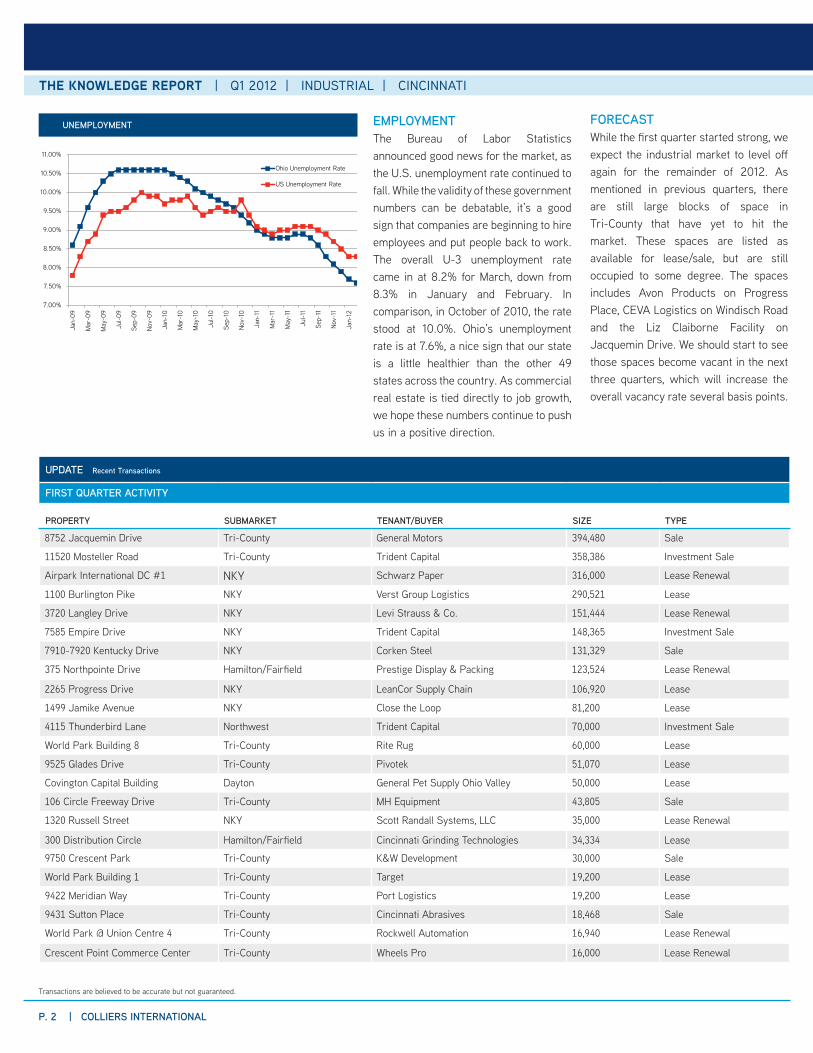
emPloYmentthe Bureau of labor Statistics announced good news for the market, as the U.S. unemployment rate continued to fall. while the validity of these government numbers can be debatable, it’s a good sign that companies are beginning to hire employees and put people back to work. the overall U-3 unemployment rate came in at 8.2% for March, down from 8.3% in January and February. In comparison, in october of 2010, the rate stood at 10.0%. ohio’s unemployment rate is at 7.6%, a nice sign that our state is a little healthier than the other 49 states across the country. As commercial real estate is tied directly to job growth, we hope these numbers continue to push us in a positive direction.
Forecastwhile the first quarter started strong, we expect the industrial market to level off again for the remainder of 2012. As mentioned in previous quarters, there are still large blocks of space in tri-County that have yet to hit the market. these spaces are listed as available for lease/sale, but are still occupied to some degree. the spaces includes Avon products on progress place, CeVA logistics on windisch road and the liz Claiborne Facility on Jacquemin drive. we should start to see those spaces become vacant in the next three quarters, which will increase the overall vacancy rate several basis points.
uPdate recent transactions
First Quarter actiVitY
ProPertY suBmarket tenant/BuYer size tYPe
8752 Jacquemin drive tri-County general Motors 394,480 Sale
11520 Mosteller road tri-County trident Capital 358,386 Investment Sale
Airpark International dC #1 nkY Schwarz paper 316,000 lease renewal
1100 Burlington pike nkY Verst group logistics 290,521 lease
3720 langley drive nkY levi Strauss & Co. 151,444 lease renewal
7585 empire drive nkY trident Capital 148,365 Investment Sale
7910-7920 kentucky drive nkY Corken Steel 131,329 Sale
375 northpointe drive hamilton/Fairfield prestige display & packing 123,524 lease renewal
2265 progress drive nkY leanCor Supply Chain 106,920 lease
1499 Jamike Avenue nkY Close the loop 81,200 lease
4115 thunderbird lane northwest trident Capital 70,000 Investment Sale
world park Building 8 tri-County rite rug 60,000 lease
9525 glades drive tri-County pivotek 51,070 lease
Covington Capital Building dayton general pet Supply ohio Valley 50,000 lease
106 Circle Freeway drive tri-County Mh equipment 43,805 Sale
1320 russell Street nkY Scott randall Systems, llC 35,000 lease renewal
300 distribution Circle hamilton/Fairfield Cincinnati grinding technologies 34,334 lease
9750 Crescent park tri-County k&w development 30,000 Sale
world park Building 1 tri-County target 19,200 lease
9422 Meridian way tri-County port logistics 19,200 lease
9431 Sutton place tri-County Cincinnati Abrasives 18,468 Sale
world park @ Union Centre 4 tri-County rockwell Automation 16,940 lease renewal
Crescent point Commerce Center tri-County wheels pro 16,000 lease renewal
7.00%
7.50%
8.00%
8.50%
9.00%
9.50%
10.00%
10.50%
11.00%
Jan-
09
Mar
-09
May
-09
Jul-0
9
Sep-
09
Nov-
09
Jan-
10
Mar
-10
May
-10
Jul-1
0
Sep-
10
Nov-
10
Jan-
11
Mar
-11
May
-11
Jul-1
1
Sep-
11
Nov-
11
Jan-
12
Ohio Unemployment Rate
US Unemployment Rate
unemPloYment
the knowledge report | Q1 2012 | industrial | cincinnati
P. 2 | colliers international

SUBMARKET Total Inventory Total Vacant SF Vacancy Rate Quarterly Absorption YTD Absorption Avg. Rate
Airport 27,221,161 2,445,013 9.0% 509,805 509,805 $3.07
Blue Ash 12,787,682 1,086,545 8.5% 68,667 68,667 $3.75
Kenton/Campbell County 5,845,329 100,900 1.7% 0 0 $3.90
Central/Midtown 47,423,206 4,051,790 8.5% (6,192) (6,192) $2.85
Covington 8,338,550 400,477 4.8% 33,773 33,773 $3.64
Eastern Corridor 12,650,115 2,823,082 22.3% (44,005) (44,005) $3.30
Florence 24,447,909 1,059,130 4.3% (105,567) (105,567) $3.26
Hamilton 7,972,378 648,296 8.1% (106,927) (106,927) $2.27
I-71 North Corridor 10,980,157 1,535,149 14.0% 76,343 76,343 $3.90
Lockland/Evendale 20,650,536 1,097,590 5.3% (196,057) (196,057) $2.85
I-75 North Corridor 21,991,003 1,965,268 8.9% (16,339) (16,339) $3.65
Tri-County/Union Centre 66,964,416 7,692,188 11.5% 497,710 497,710 $3.41
Western Corridor 7,126,143 324,516 4.6% (5,000) (5,000) $4.76
MARKET TOTALS 274,398,585 25,229,944 9.2% 706,211 706,211 $3.31
INDUSTRIAL SUBMARKET DATA
aVg. asking rates (Per sF-Full serVice gross)
$2
$3
$4
$5
$6
$7
$8
4Q 0
9
1Q 1
0
2Q 1
0
3Q 1
0
4Q 1
0
1Q 1
1
2Q 1
1
3Q 1
1
4Q 1
1
1Q 1
2
General Rate Flex Rate Distribution Rate
QuarterlY net aBsorPtion
squa
re F
eet
-1,000,000
-500,000
0
500,000
1,000,000
1,500,000
4Q 0
9
1Q 1
0
2Q 1
0
3Q 1
0
4Q 1
0
1Q 1
1
2Q 1
1
3Q 1
1
4Q 1
1
1Q 1
2
the knowledge report | Q1 2012 | industrial | cincinnati
colliers international | P. 3
ceo | PrinciPal: Shenan p. Murphy, CCIM+1 513 721 4200
Colliers International statistics are audited annually and may result in revisions to previously reported quarterly and final year-end figures
Colliers International | greater Cincinnati 425 walnut Street, Suite 1200Cincinnati, oh 45202
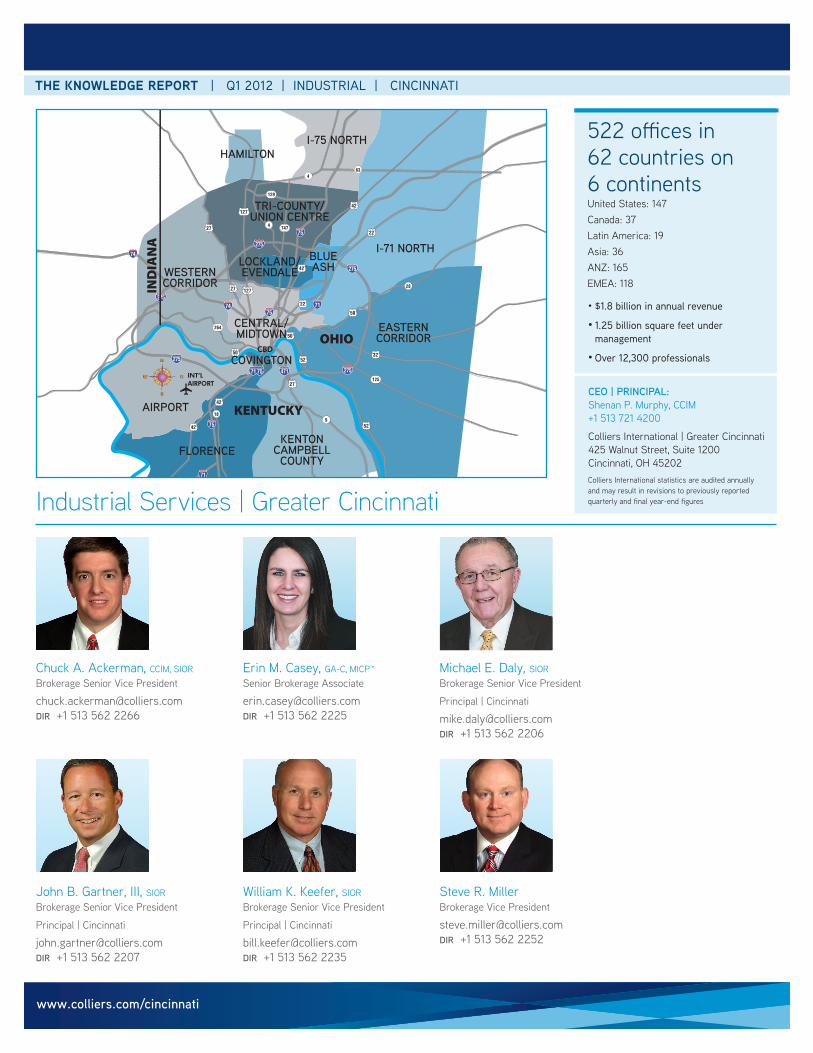
Industrial Services | Greater Cincinnati
INT’LAIRPORT
I-75 NORTH
TRI-COUNTY/UNION CENTRE
I-71 NORTHBLUEASHLOCKLAND/
EVENDALE
CENTRAL/MIDTOWN EASTERN
CORRIDOR
WESTERNCORRIDOR
KENTONCAMPBELLCOUNTY
COVINGTON
AIRPORT
FLORENCE
HAMILTON
www.colliers.com/cincinnati
Chuck A. Ackerman, CCIM, SIorBrokerage Senior Vice president
[email protected] +1 513 562 2266
John B. gartner, III, SIorBrokerage Senior Vice president
principal | Cincinnati
[email protected] +1 513 562 2207
william k. keefer, SIorBrokerage Senior Vice president
principal | Cincinnati
[email protected] +1 513 562 2235
Steve r. MillerBrokerage Vice president
[email protected] +1 513 562 2252
erin M. Casey, gA-C, MICp™Senior Brokerage Associate
[email protected] +1 513 562 2225
Michael e. daly, SIorBrokerage Senior Vice president
principal | Cincinnati
[email protected] +1 513 562 2206
522 offices in 62 countries on 6 continentsUnited States: 147Canada: 37latin America: 19Asia: 36AnZ: 165eMeA: 118
• $1.8 billion in annual revenue
• 1.25 billion square feet under management
• Over 12,300 professionals
the knowledge report | Q1 2012 | industrial | cincinnati