Embed Size (px)
Citation preview

Introduction to critical appraisal of quantitative research for healthcare
Alan Fricker
Library Liaison Manager

Objectives of session• Understand the main concepts of critical appraisal and its role
in evidence based practice
• Understand the different levels of quantitative evidence
• Know about resources available to help critically appraise research

Daily Mail exercise• Would you treat a patient based on this
article? Why?
• Validity
• Reliability
• Transferability to practice
(by Laurie Pink)

What is evidence based practice?
Evidence-based practice is the integration of
• individual clinical expertise
with the
• best available external clinical evidence from systematic research
and
• patient’s values and expectations

The evidence-based practice (EBP) process
• Decision or question arising from a patient’s care
• Formulate a focused question
• Search for the best evidence
• Appraise the evidence
• Apply the evidence

EBP in practice
http://clinicalevidence.com/x/set/static/cms/efficacy-categorisations.html 21 Feb 2014

Why does evidence from research fail to get into practice?
• 75% cannot understand the statistics
• 70% cannot critically appraise a research paper
Using research for Practice: a UK experience of the
barriers scale. Dunn, V. et al.

What is critical appraisal?• “To weigh up the evidence critically to assess its validity
(closeness to the truth) and usefulness (clinical applicability) “[Sackett and Haynes, 1995]
• “Critical appraisal is concerned
with the acquisition of necessary
skills with which to
discern clinical research
papers accurately”
[Ajentunmobi, 2002]

Why critical appraisal?
• “It usually comes as a surprise to students to learn that some...published articles belong in the bin and should not be used to inform practice” (Greenhalgh, 2006)
• Not all papers are equal: some are good, some are bad, most have strengths and weaknesses

True or False? Critical appraisal is...• An objective assessment of research
process and results
• Tearing research apart
• Assessment of a paper based on it’s results
• A balanced evaluation of benefits and strengths of the research against its flaws and weaknesses
• Trying to prove the authors “wrong”
• A process that can only be undertaken by experts and statisticians
• True
• False
• False
• True
• False
• False
10

How do I appraise?
• Step 1: Identify the research method used
– Quantitative or qualitative?
• Step 2: Identify the research methodology and whether it is appropriate
– Systematic review? Clinical trial?
• Step 3: Checklists keep you focused (CASP)
http://www.casp-uk.net/

CASP website
12

Appraising original research• Rigour: are the results valid?
– Is the research question focused?
– Was the method appropriate?
– How was it conducted, e.g. randomisation, blinding, recruitment and follow up?
• Results: what did the research find?
– How was data collected and analysed?
– Are they significant?
• Relevance: Will the results help my work with patients?
13

Components of a research paper: IMRAD
• Introduction
– Why?
• Methods
– How?
• Results and
– What?
• Discussion
– Meaning
Step 1: Identify the research method
Quantitative QualitativeUses numbers to describeand analyse
Uses words to describe and analyse
Useful for finding preciseanswers to definedquestions
Useful for finding detailedinformation about people’s attitudes / perceptions
Objective process Subjective process
Deductive reasoning Inductive reasoning
Statistical sampling Theoretical sampling
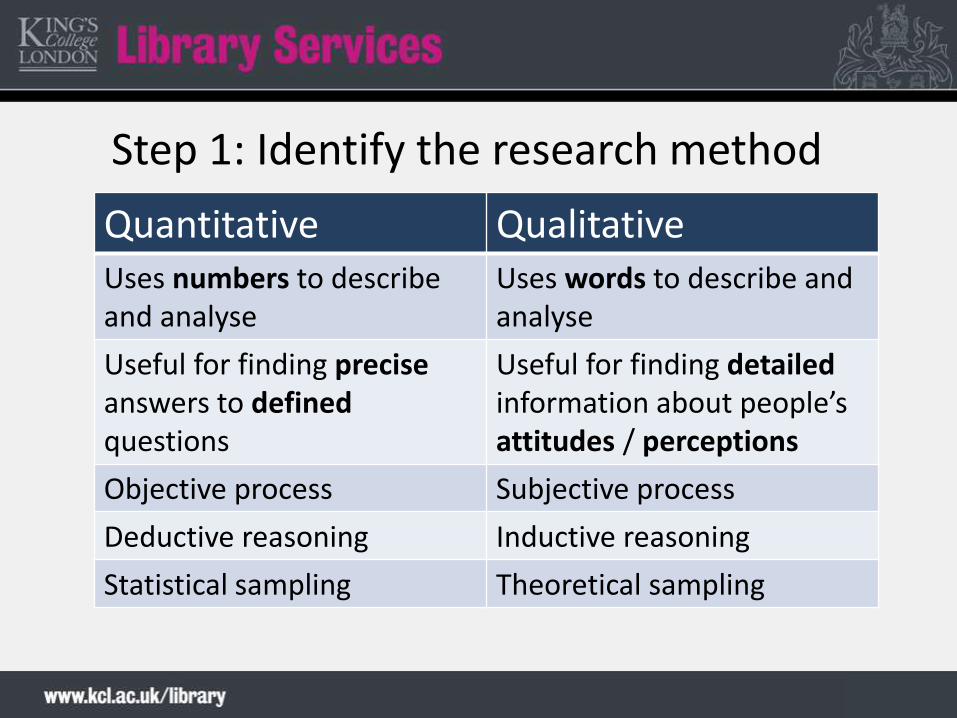
Quant or qual?
• How effective is outpatient pulmonary rehabilitation in patients with COPD?
• Why might patients with COPD choose not to receive outpatient pulmonary rehabilitation?
• What is the optimum model for transitions to palliative care in hospitals?
• How are transitions to palliative care perceived by hospital staff?
• Qualitative
Qualitative
Quantitative
Quantitative

Step 2: Identify the methodology• Clinical trial
– Whether one intervention is better than another
– Systematic review / meta-analysis measures overall effect of several clinical trials
• Cohort study
– Measures effectiveness of intervention over time
• Case-controlled study
– Comparative: what makes some populations different from others
• Survey / Case study
– How things are now (Crombie, 1996)

All studies are not created equal! (but...it often depends on the question being asked)
Systematic reviews
Meta-analysis
Randomised
controlled trials
Cohort studies
Case-controlled studies
Surveys and case reports

Interventional studiesSystematic reviews, RCTs
• Pros:
– Provide compelling evidence
– Overcome confounding factors
• Cons:
– Difficult / time consuming to recruit
– Expensive
– Not appropriate for all conditions
19

Observational studies• Cohort, case-control and case studies / series• Pros:
– Easier to recruit
– Good for addressing questions of harm
• Cons:
– Confounding factors• Age, existing diseases, body mass index, alcohol/tobacco
intake, high blood pressure, socio-economic status etc etc...
– Can provide circumstantial evidence, not definitive proof of the causes of a disease
20

Step 3: Checklist – screening questions
• Question 1: Did the study ask a clearly focused question? (PICO)
– Who is the population under study?
– What is the intervention / exposure?
– What is the outcome(s)
• Question 2: Was the study design appropriate?
– Is it the most suitable one for addressing the study question?

Randomisation
• Question 3: Randomisation
– Patients should be randomly allocated to intervention / control groups
– Is the method described?
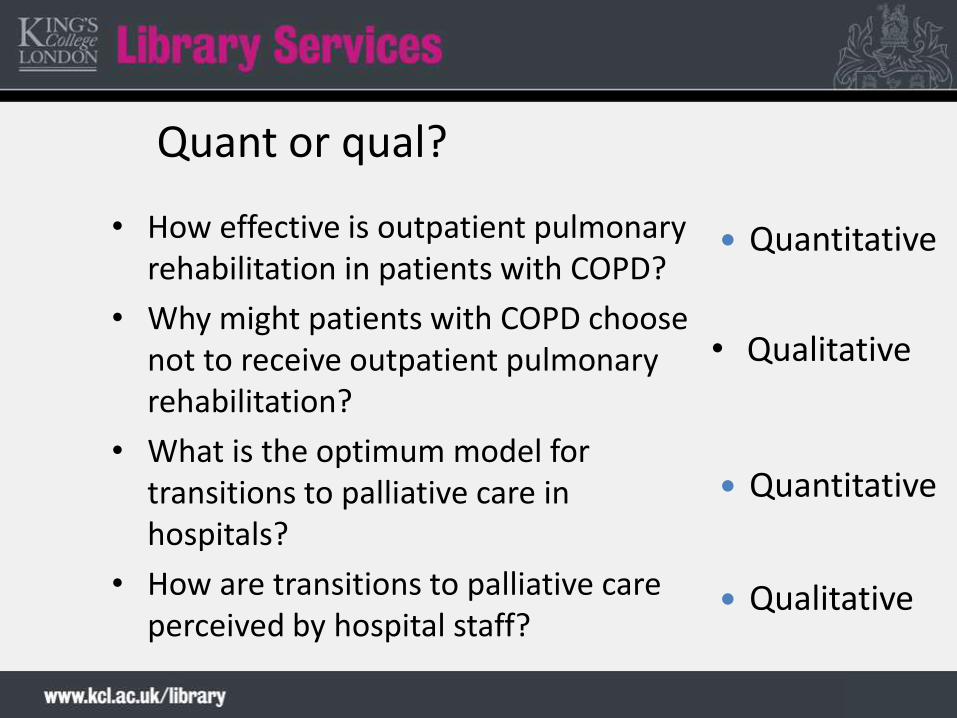
– Are the groups well-balanced?• Baseline table or chart
– If the groups are not balanced is this acknowledged and what steps have been taken to overcome the problem?
Example of baseline table
From: Farion, K J et al (2008) The
effect of vapocoolant spray on pain due to intravenous
cannulation in children: a randomized controlled trial
CMAJ vol 179(1) p31-6

Blinding• Question 4: Blinding
– Preventing those involved in a trial from knowing to which comparison group, i.e. experimental or control, a particular participant belongs
• The risk of bias is minimised
• Participants, caregivers, outcome assessors and analysts can all be blinded– Single and double blinding are in common use
• Blinding of certain groups is not always possible– e.g. Surgeons in surgical trials
• Placebo – inactive version of treatment

Follow-up, intention-to-treat
• Questions 5/6: Were all participants followed up and data collected in the same way?
• Were any participants lost to follow-up?– Flow diagram
• Intention-to-treat analyses– Analysing people, at the end of the trial, in the groups to which
they were randomised, even if they did not receive the intended intervention
– Prevents attrition bias: caused by patients withdrawing from a trial
– Paper should specify if ITT was or was not used

Example of flow diagram
From: Farion, K J et al (2008) The
effect of vapocoolant spray on pain due to intravenous
cannulation in children: a randomized controlled trial
CMAJ vol 179(1) p31-6

Sample size
• Question 7: Sample size
• Based on primary outcome measure
• Power calculation: – Used to calculate the sample size necessary to detect a true
difference between outcomes in the control and intervention groups
– Allows the researchers to work out how large a sample they will need to use
– Power of 80-90% is standard
• For an example of how to calculate see http://www.statisticalsolutions.net/pss_calc.php

Presentation of results• Question 8: How the results are presented
• Results usually expressed in terms of likely harms or benefits – can be relative or absolute– Risk: proportion of people experiencing an outcome
– Measurement: mean or median difference
– Survival curves / hazards
• How large or meaningful is this result?– Odds ratios, mean differences, absolute risk reduction (ARR),
relative risk reduction (RRR), number needed to treat (NNT)

A few facts about...risk• When talking about the chance of something happening
e.g. death, hip fracture, we can talk about: risk andrelative risk
• Risk is the chances of a particular outcome being observed in an individual
• Risk can be good or bad– Risk of someone dying
– Risk of someone getting better
• Risk is a proportion and usually compares risks in an experimental and control group

Expressing comparisonsof effectiveness: an example
You have responsibility for your Trust budget and are looking at introducing a new analgesic. Which one would you fund?
A: Reduces the rate of pain by 62.5%
B: Absolute risk reduction of pain of 50%
C: Decreases patients’ pain rate from 80% to 30%
D: For every 2 patients treated with the new drug, one extra patient would expect a reduction in pain

Answer: They are all the same!
• 200 patients enrolled in study
• We give the new analgesic agent to 100 people and find that 30 still have pain within two hours
• We give a placebo tablet containing no active drug to another 100 people and observe 80 still have pain
• From this we can calculate the Experiment Event Ratio (EER) and the Control Event Ratio (CER) – from which we can calculate ARR, RRR and NNT

EER and CER• Experimental Event Rate (EER) is the
proportion of patients in the experimental group in whom an event (pain) is observed
EER = 30/100 = 30% (0.3)(30% of people who received the drug still experienced pain)
• Control Event Rate (CER) is the proportion of patients in the control group in whom an event (pain) is observed.
CER = 80/100 = 80% (0.8)(80% of people who received a placebo still experienced pain)

ARR & RRR• Absolute Risk Reduction (ARR) is the
difference between the Control Event Rate (CER) and the Experimental Event Rate
– ARR = CER – EER ARR = 80% – 30% = 50% (can also be expressed as 0.5)
– The analgesic will prevent 50% of patients experiencing pain that would have otherwise occurred
• Relative Risk Reduction (RRR) = ARR/CER
– RRR = 50/80 (62.5%) (or 0.625)– Analgesic reduces risk of pain in 62.5% of the experimental
group compared to the control group
ARR!

NNT• The number of people you would need to treat to see one additional occurrence of a specific beneficial outcome
• Number needed to treat (NNT) is 100/ARR (if ARR is a %)
NNT = 100/50 = 2
For every 2 patients treated with the new analgesia, one extra patient would be expected to benefit
• Best NNT=1

Summary• The same data can be presented in different
ways using very simple calculations
• How it is presented often depends upon what the author is trying to convey
• Relative risk reduction (RRR) will be a bigger number (more impressive!) than an absolute risk reduction – use with caution
• ARR or NNT often give a better idea of how likely a patient is to derive benefit from a treatment

Two by Two tables
36

Calculations
37

Precision / significance of results
• Question 9: How precise are the results?
• Are the results precise enough to make a decision
– Did they take into account odds and the play of chance?
– Are the results significant?
• Did they use confidence intervals?
• Did they use p-values?

Odds • Odds is the probability of an event occurring compared to the probability of it not occurring
• The odds of an event occurring in the experimental group is:
– Number of people experiencing the outcome event / Number of people not experiencing it
• Odds ratio
– Odds of people experiencing the outcome event / Odds of people experiencing the control event
– Odds ratio of 1= no difference between groups

Essential statistics: P-value
• Measures probability
• Represents the probability that the result could have occurred by chance if the null hypothesis was true
• Null hypothesis: that there are no differences between groups being compared or no relationship/association between variables in the relevant populations
• P-value of 0.05 or less = “statistically significant” (likelihood of results being due to chance less than1 in 20)

42

Essential statistics: confidence intervals• Assesses significance of a given sample
• The range in which we are 95% (or 99%) confident that the ‘real’ result of the study lies when is extrapolated to the whole of the population sampled in the study
• 95% confidence interval (CI) = “clinically significant”
– Narrow CI (1.07,1.24) = more confident
– Wide CI (0.15, 59.89) = less confident
CIs and statistical significance
• When quoted alongside an absolute difference a CI that includes zero is statistically non-significant
• When quoted alongside a ratio or relative difference a CI that includes one is statistically non-significant
• IF statistically significant:• Less than zero (or one) = less of the outcome in the
treatment group.• More than zero (or one) = more of the outcome.• BUT - Is the outcome good or bad?

Cardiac deaths - less = good

Smoking cessation – more = good
Does statistical significance matter?• Statistical significance does not necessarily equal clinical
significance
• Type I error: Seeing effects that are not real (P<0.05)
• Type 2 error: Seeing no effect when there is one (power > 80%)
• Research papers should not contain too many statistical comparisons – increases chance of spurious findings
• Don’t get bogged down with stats – they are only one part of the paper!
http://www.medicine.ox.ac.uk/bandolier/painres/download/whatis/what_are_conf_inter.pdf

Transferability• Question 10: Transferability
– Can I apply these results to my own practice?
• Group under study: are they the same as your patients?
– Socio-cultural origin, gender, age etc.
– Location of research: country, setting
• Does the paper consider the results from the perspective of difference stakeholders?
• Do the benefits outweigh the harms / costs?
• Should practice / policy change?

Be aware of potential bias• Statistical bias
– Absence of baseline
– Lack of randomisation (selection bias)
– Poor blinding (observer bias)
• Population bias
– Study focuses on one particular group
• Loss to follow-up
http://www.medicine.ox.ac.uk/bandolier/Extraforbando/Bias.pdf

Ethics
• Has the research received ethical approval via an ethics committee?
• Who carried out / funded the research?– Any conflicting interests must be declared
• Is the data anonymised? Did patients given written consent to treatment?
• Evidence of attention to ethical issues (Dawes, 2005)

The good news!
• Some resources have already been critically
appraised for you.
• An increasing number of guidelines and
summaries of appraised evidence are
available on the internet.

Summary• Search for resources that have already been appraised first, e.g.
Guidelines, Cochrane systematic reviews.
• Search down through levels of evidence, e.g. systematic reviews, RCTs.
• Use checklists to appraise research.
• Look out for the following:
– Research design
– Choice of study
– Statistics explained and displayed clearly
– Bias / Ethics considered
– Transferable results

Tips for success• Group work
• Read the paper
• Start with easy questions
• Keep calm and carry on
• Review, feedback
“Undertaking a critical appraisal is really using your everyday skills, and applying them in a more structured and systematic way” - Dawes (2005)

References• Ajetunmobi, O (2001) Making sense of critical appraisal
Arnold, London
• Bowers, D et al (2001) Understanding clinical papers John Wiley & Sons, Chichester
• Bowling, A (2009) Research methods in health (3rd ed)Open University Press, Buckingham
• Chalmers, I and Altman, D G (1995) Systematic reviews BMJ Publishing, London
• Crombie, I K (1996) The pocket guide to critical appraisalBMJ Books, London
• Dawes, M (2005) Evidence-based practice: a primer for healthcare professionals (2nd ed) Elsevier, Edinburgh

References• Everitt, B S (2003) Medical statistics from A-Z Cambridge University
Press, Cambridge
• Greenhalgh, T (2014) How to read a paper: the basics of evidence-based medicine (5th ed) BMJ Books, London
• Hart, A (2001) Making sense of statistics in healthcare Radcliffe Medical Press, Abingdon
• Khan, K S et al (2003) Systematic reviews to support evidence-based medicine RSM Press, London
• Pereira-Maxwell, F (2005) A-Z of medical statistics: a companion for critical appraisal Arnold, London
• Stewart, A (2002) Basic statistics and epidemiology Radcliffe Medical Press, Abingdon

Useful websites• Bandolier http://www.medicine.ox.ac.uk/bandolier/
• Centre for Evidence-based Medicine http://www.cebm.net
• Cochrane Library http://www.thecochranelibrary.com
• Critical Appraisal Skills Programme (CASP) http://www.casp-uk.net/
• Users Guide to the Medical Literature (JAMA) See list of articles http://bit.ly/txAejQ