Embed Size (px)
Citation preview

RENAL DOPPLER
Dr Mohit Goel6 feb, 2014

ANTERIOR APPROACH
The renal arteries are clearly imaged in B Mode from an anterior,
subcostal approach however as it is perpendicular to the ultrasound
beam it is not suitable for Doppler assessment.
Supernumerary (duplicate) arteries can be seen looking posterior to
the IVC in B Mode and Color in a sagittal plane.
ULTRASOUND OF THE RENAL ARTERIES - NORMAL

Anterior Approach

OBLIQUE APPROACH
By moving the probe to the left of midline and angling toward the patient's
right, an acceptable Doppler angle of 60 degrees is achieved. To avoid
aliasing set the colour scale high enough so it is minimized. If the scale is
too low then it is difficult to determine which vessel is the vein and which
vessel is the artery.
Anterior Approach Oblique Approach
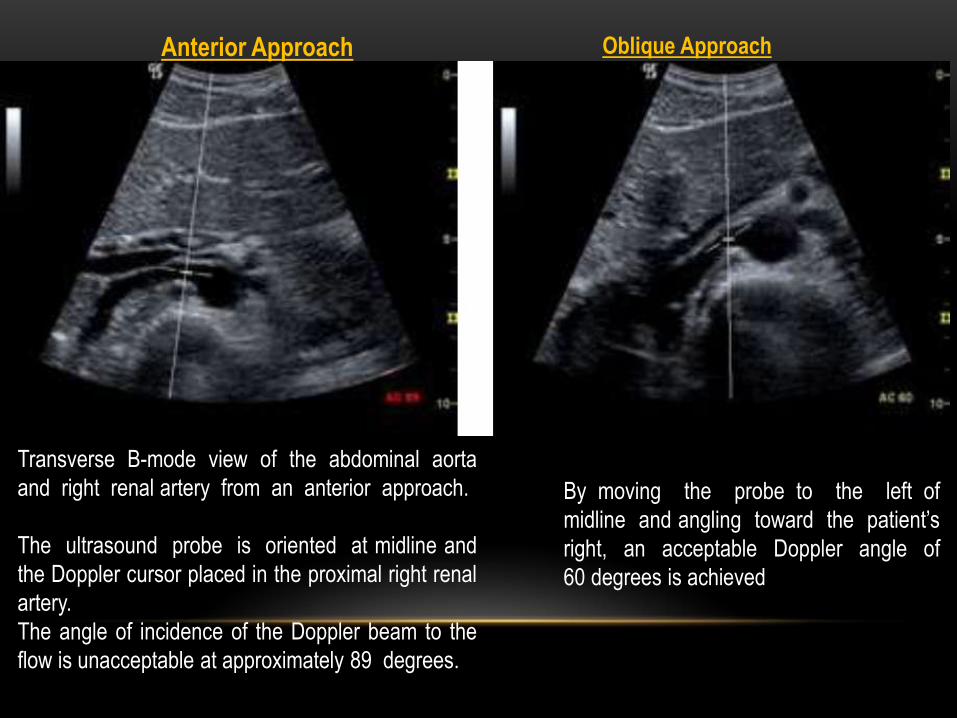
Transverse B-mode view of the abdominal aorta
and right renal artery from an anterior approach.
The ultrasound probe is oriented at midline and
the Doppler cursor placed in the proximal right renal
artery.
The angle of incidence of the Doppler beam to the
flow is unacceptable at approximately 89 degrees.
By moving the probe to the left of
midline and angling toward the patient’s
right, an acceptable Doppler angle of
60 degrees is achieved


Flank/ Coronal Approach
Roll the patient into a decubitus position to avoid bowel gas and improve
visibility of the renal artery, especially the mid to distal portion.


FLANK APPROACH
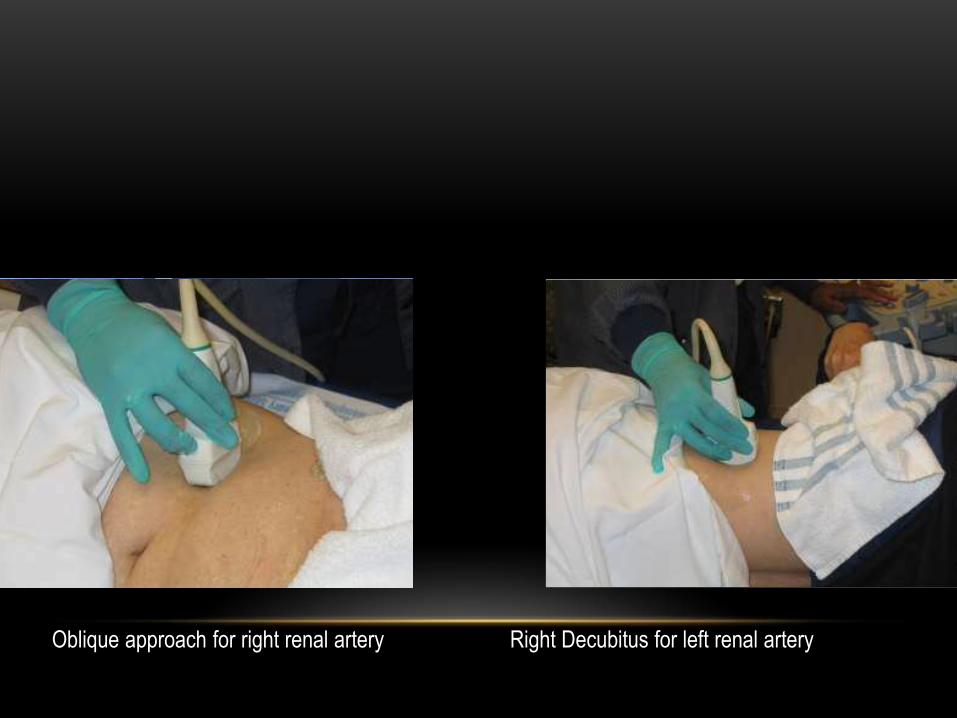
Oblique approach for right renal artery Right Decubitus for left renal artery

The Doppler sample volume is placed
within the proximal right renal artery. In
this view, an acceptable Doppler angle of
60 degrees or less is easily obtained.
Flank approach showing the abdominal aorta and origin of both renal arteries.
The Doppler reading of the abdominal
aorta is taken near the level of the renal
arteries.
This value is applied to the RAR .


Arterial anatomyUpon reaching the renal hilum, the main renal arteries divide into anterior and posterior segmental
arteries. These further divide to feed the multiple segments of the kidney. The segmental arteries, in
turn, give rise to the interlobar arteries which course alongside the renal pyramids toward the
periphery of the kidney. The interlobar arteries branch into arcuate arteries at the corticomedullary
junction. The arcuate arteries travel across the top of the renal pyramids and give rise to the
interlobular arteries
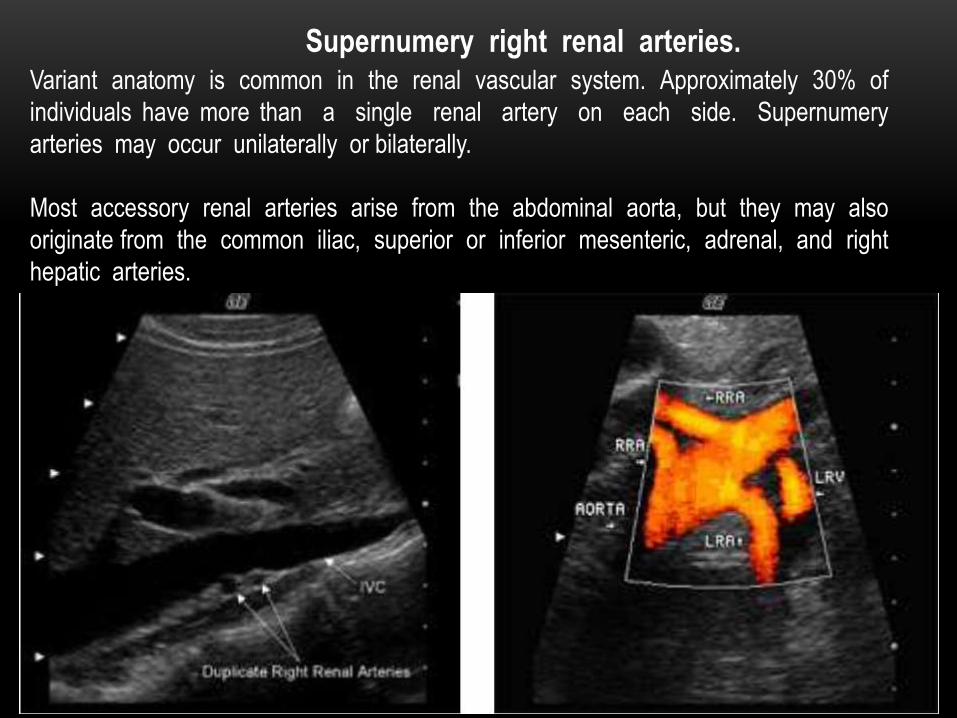
Variant anatomy is common in the renal vascular system. Approximately 30% of
individuals have more than a single renal artery on each side. Supernumery
arteries may occur unilaterally or bilaterally.
Most accessory renal arteries arise from the abdominal aorta, but they may also
originate from the common iliac, superior or inferior mesenteric, adrenal, and right
hepatic arteries.
Supernumery right renal arteries.


Anomalous anatomy affects the venous drainage as well as the arterial
inflow. The left renal vein may follow a retroaortic course passing
posterior to the aorta instead between the aorta and SMA.
Anomalous left renal vein

Circum Aortic Left Renal Vein
Alternatively, the renal vein may be circumaortic, dividing before reaching the aorta with
one branch coursing anteriorly and another posteriorly
Normal renal arteries demonstrate low resistance waveforms – R I <
0.7.
Increased vascular resistance with decreased diastolic flow may be
seen in hydronephrosis, renal vein thrombosis and chronic renal
disease. RI increases with decreasing diastolic flow.

• Normal intrarenal arteries
• – low resistance
• – R I is < 0.7
• – ESP (Early systolic peak)
present
• Rapid acceleration to peak
systole (< .07s)

A low resistance waveform with sharp systolic upstroke is expected in the normal main
renal artery (A).
The early systolic peak (ESP) (arrow) is seen as a small notch in systole in the normal
intrarenal arterial waveform. The systolic upstroke is rapid with an acceleration time of
0.07 seconds or less.
Normal Doppler waveforms obtained from the main renal artery and segmental renal artery

Contrast angiography (CA) is the gold standard in the diagnosis of renal
artery stenosis (RAS).
Due to its invasive nature, however, CA is not suitable for screening.
Multiple studies have shown that Doppler Ultrasound can be an effective
tool in the diagnosis of RAS.

TWO DOPPLER METHODS FOR DETECTING
RENAL ARTERY STENOSIS
• Direct Evaluation
• Direct visualization with
Doppler throughout the
Main renal artery and all
accessory renal arteries
• Indirect Evaluation
• Doppler of the
segmental/interlobar renal
arteries at the upper, mid
and lower renal poles
Two Doppler Methods for Detecting
Renal Artery Stenosis
•Direct Evaluation
– Direct visualization with Doppler throughout the Main renal artery and all accessory renal arteries
• Indirect Evaluation
– Doppler of the segmental/interlobar renal arteries at the upper, mid and lower renal poles
The most reliable approach combines the two methods.

The direct method involves Doppler interrogation of the entire
length of the main renal artery, including any accessory renal
arteries.
Although stenosis is usually located near the renal artery origin,
fibromuscular dysplasia is more often located in the mid to distal
segment, thus requiring a look at the entire length of each artery.
The highest velocity found in the renal artery is compared to that of
the abdominal aorta (at the level of the renal arteries). This is
termed the renal/aortic ratio or RAR.
Direct Evaluation
Direct Evaluation
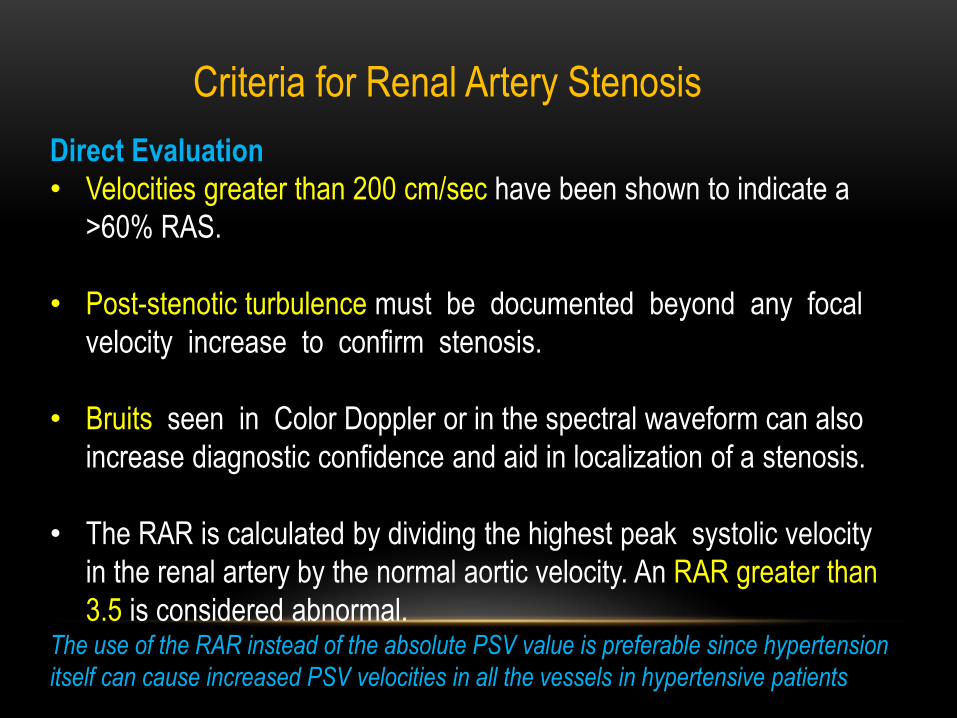
• Velocities greater than 200 cm/sec have been shown to indicate a
>60% RAS.
• Post-stenotic turbulence must be documented beyond any focal
velocity increase to confirm stenosis.
• Bruits seen in Color Doppler or in the spectral waveform can also
increase diagnostic confidence and aid in localization of a stenosis.
• The RAR is calculated by dividing the highest peak systolic velocity
in the renal artery by the normal aortic velocity. An RAR greater than
3.5 is considered abnormal. The use of the RAR instead of the absolute PSV value is preferable since hypertension
itself can cause increased PSV velocities in all the vessels in hypertensive patients
Criteria for Renal Artery Stenosis

Patient with renal artery stenosis
Image A is a color Doppler image of a stenotic right renal artery origin.
A color bruit is seen in the tissue surrounding the area of the post stenotic turbulence.
The presence of the bruit can help to identify the location of the stenosis and increase
diagnostic confidence.

A Doppler reading(B) obtained near the renal artery origin shows velocities over 600
cm/s in systole and over 300 cm/s in diastole consistent with a high grade stenosis.
The arrows are pointing to a bruit that is evident on the spectral display.

Image C shows a spectral waveform obtained in the area of poststenotic turbulence just beyond
the maximal area of stenosis.
The velocity is lower at 317 cm/s and the waveform profile is irregular due to the turbulent flow.
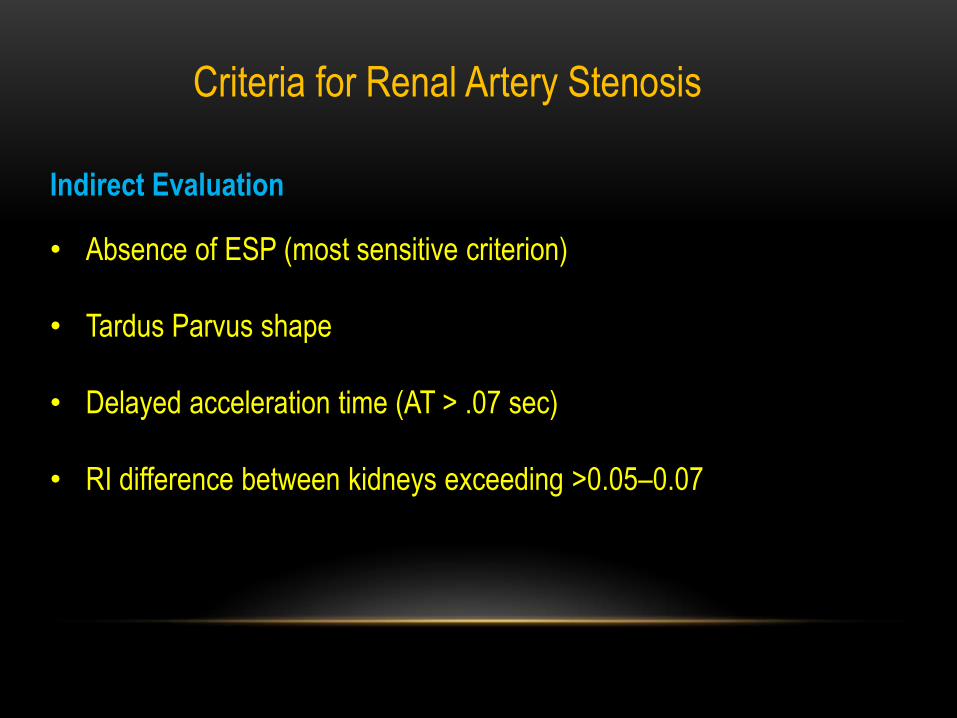
Indirect Evaluation
• Absence of ESP (most sensitive criterion)
• Tardus Parvus shape
• Delayed acceleration time (AT > .07 sec)
• RI difference between kidneys exceeding >0.05–0.07
Criteria for Renal Artery Stenosis

The Doppler waveform obtained from the segmental renal arteries within the right
kidney shows a tardus parvus shape with absence of the ESP (D).
The AT measures 0.11 sec.

Tardus–parvus waveform in a patient with RA stenosis. Note the delayed and dampened
upstroke yielding a rounded appearance to the waveform.

Normal Range of abnormal waveforms with increasing levels
of renal artery stenosis from top to bottom.
• The ESP is detected on each waveform.
• In some cases, the ESP is the highest peak, but in
others, the highest peak occurs later in systole.
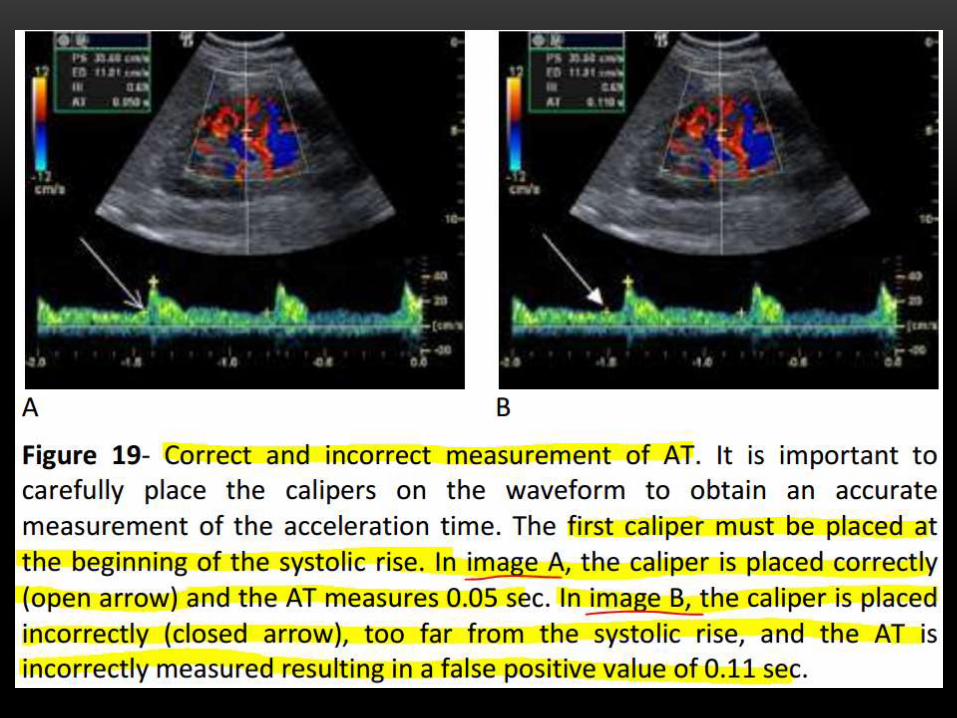
• The AT is always measured to the first systolic peak,
which is the ESP in normal waveforms.
Since the ESP is absent on abnormal waveforms, the AT is
measured from the beginning of systole to the systolic
peak. These waveforms are termed tardus parvus due
to the delayed systolic acceleration.

RENAL TRANSPLANT
• Pathologies
• Rejection.
• Infraction.
• Renal artery anastomotic stenosis
• Renal vein anastomotic stenosis
• A V fistula.
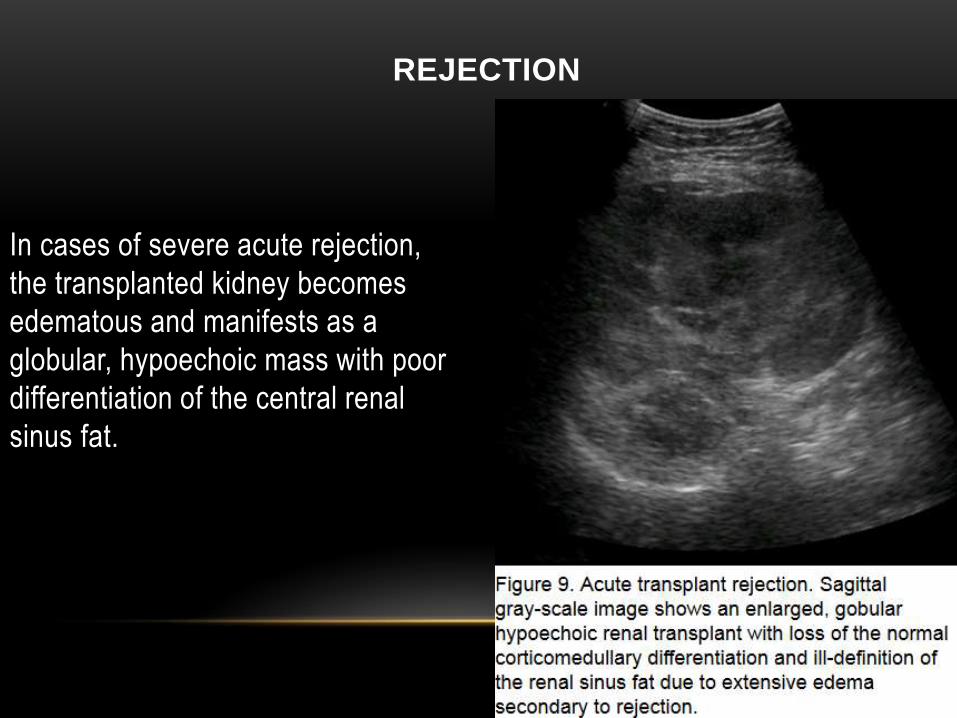
REJECTION
In cases of severe acute rejection,
the transplanted kidney becomes
edematous and manifests as a
globular, hypoechoic mass with poor
differentiation of the central renal
sinus fat.

The edema leads to increased
vascluar resistance and elevation
of the resistive index.
However, the finding of increased
resistive index is a non-specific
finding which can also be seen in
the setting of infection, acute
tubular necrosis, perioperative
ischemia, hydronephrosis and
extrinsic compression


Infarct of a renal graft.
©2005 by Radiological Society of North America
Power Doppler US image demonstrates segmental loss of perfusion in the transplanted kidney (arrows), a finding compatible with infarct.

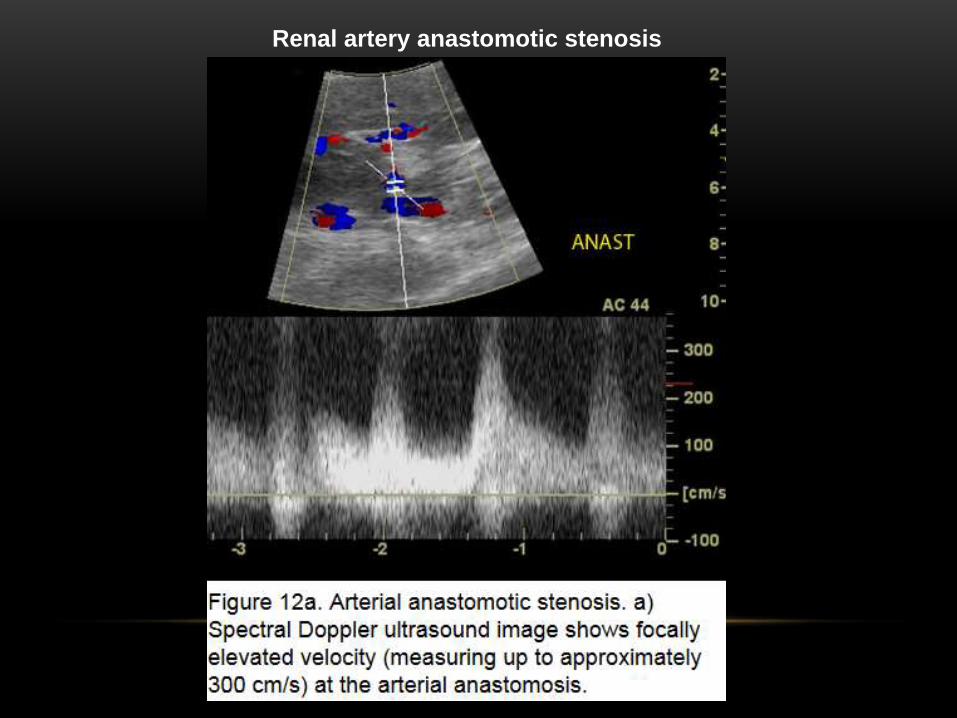
Renal artery anastomotic stenosis

Renal vein anastomotic stenosis
Ultrasound findings of hemodynamically significant venous stenosis
include
• focal narrowing with upstream luminal dilatation,
• focal color aliasing and
• focally increased velocity with 4-fold or greater gradient across the
segment of suspected stenosis.


Venous thrombosis can occur secondary to infection, severe rejection or
technical problems with the anastomosis.
The diagnostic ultrasound findings include absence of flow on Power,
color and spectral Doppler analysis.
Venous thrombosis results in a high-resistance vascular circuit and can
result in subsequent reversal of diastolic flow in the arterial waveform;
however, reversed diastolic flow is a nonspecific finding which can be
seen in severe rejection, severe pyelonephritis, drug toxicity and extrinsic
compression.


Arteriovenous fistula.
Color Doppler US image demonstrates a highly vascular lesion.

Arteriovenous fistula.
Akbar S A et al. Radiographics 2005;25:1335-1356
©2005 by Radiological Society of North America
Duplex Doppler US image of the lower pole segmental artery shows increased
velocity and decreased resistive index.

Arteriovenous fistula.
Akbar S A et al. Radiographics 2005;25:1335-1356
©2005 by Radiological Society of North America
Duplex Doppler US image of the adjacent vein shows arterialization of flow, a finding consistent with arteriovenous fistula.

THANK YOU