Embed Size (px)
Citation preview
© 2010 PharmaNet Development Group, Inc. All rights reserved.
Sample Size in Clinical Trials with Multiple Hypotheses
Alan Davis
Mary Poole
Young Kim
Poster 306968JSM 2010
Experience You Can Trust
© 2010 PharmaNet Development Group, Inc. All rights reserved.
Clinical Trials study a Sample…
Page 2
Generalize to a Population!
Then…
Experience You Can Trust
© 2010 PharmaNet Development Group, Inc. All rights reserved.
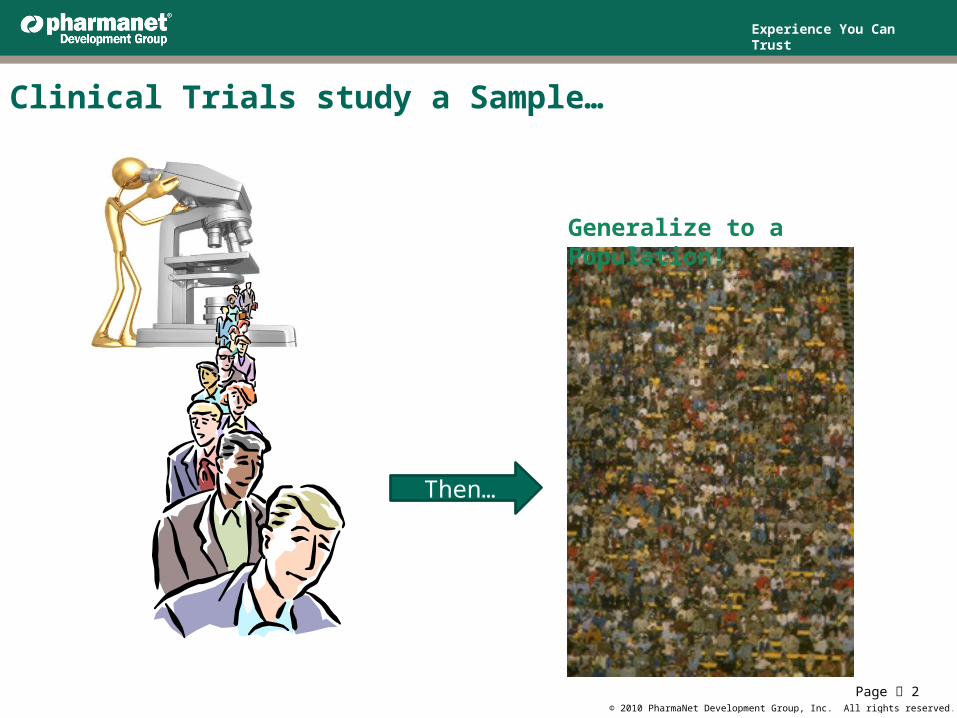
Sample size determined by the objectives for the trial
Some desired objectives for a clinical trial:A safety study requiring specific adverse events being within acceptable limits1.A study requiring several efficacy endpoints to be superior relative to a placebo.A study requiring superiority in efficacy and equivalence in safety1.
A frequent objective: the “Primary Efficacy” analysis:Advantage: No issue with multiple testing.Drawback: no clear evaluation of secondary variables and safety.
1 Acceptable Limits, Superiority, and Equivalence must be defined in terms of formal confidence interval or hypothesis testing procedure.
Page 3
Experience You Can Trust
© 2010 PharmaNet Development Group, Inc. All rights reserved.
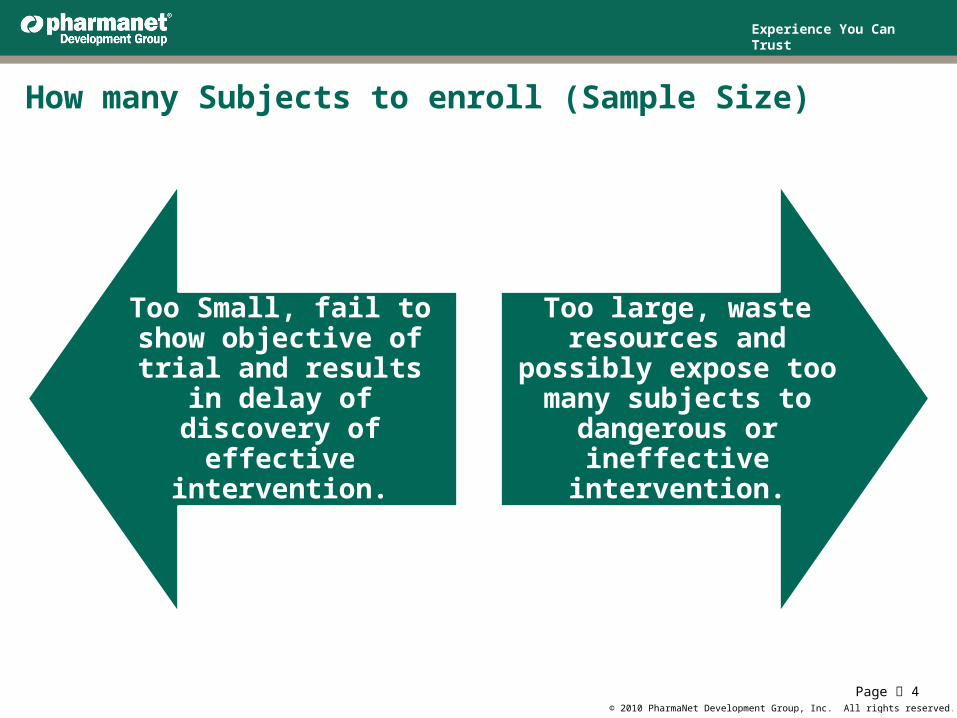
How many Subjects to enroll (Sample Size)
Too Small, fail to show objective of trial and
results in delay of discovery of effective
intervention.
Too large, waste resources and possibly
expose too many subjects to dangerous
or ineffective intervention.
Page 4
Experience You Can Trust
© 2010 PharmaNet Development Group, Inc. All rights reserved.
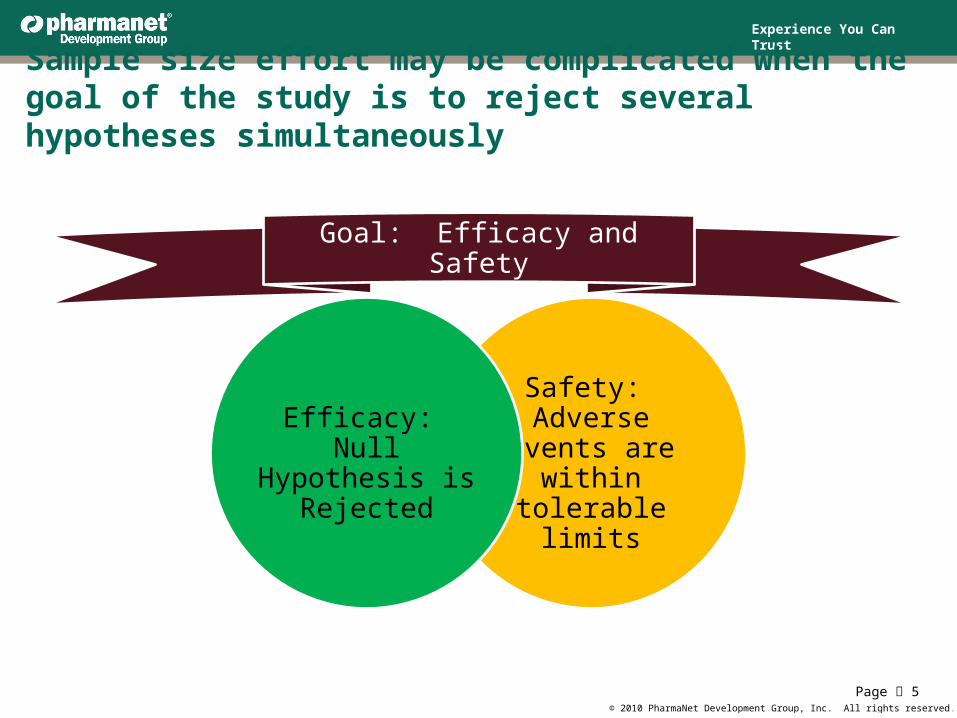
Sample size effort may be complicated when the goal of the study is to reject several hypotheses simultaneously
Goal: Efficacy and Safety
Safety: Adverse Events are within
tolerable limits
Efficacy: Null Hypothesis is
Rejected
Page 5
Experience You Can Trust
© 2010 PharmaNet Development Group, Inc. All rights reserved.
Approaches to Estimating Sample Size
Assemble historic information on relevant outcome statistics: incidence rate, survival time, median or mean and variability.
If unknown from previous studies, select values large enough to be considered clinically important. Example: a 20% reduction in relapse rate.
Determine region of each test resulting in satisfaction of trial (rejection region, region of equivalence).
Power is now the probability that the trial will be a success, ie, all tests will fall into a region which satisfies the trial.
Compute Power by summing conditional probability over region of rejection, or by repeated simulation of trials and observing the proportion that all tests are satisfied.
Page 6
Experience You Can Trust
© 2010 PharmaNet Development Group, Inc. All rights reserved.
Example: A Trial of a topical generic medication
For a topical medication, since medication is not systemically absorbed, bioequivalence of a generic equivalent to an established medication must be inferred from clinical effects rather than systemic uptake and release of active ingredient.
This means that subjects are assigned at random to groups having the following treatment:
Group 1: Receives the test medication, the generic equivalent.Group 2: Receives the standard, or reference medication. Group 3: A placebo control, needed to show the study has the precision necessary
to distinguish between effective and ineffective treatments.
To be successful in establishing bioequivalence, the sponsor of the trial needs to demonstrate that subjects in Group 1 and Group 2 are close together in terms of treatment effect, and both groups show superior treatment effect to subjects in Group 3.
Page 7
Experience You Can Trust
© 2010 PharmaNet Development Group, Inc. All rights reserved.
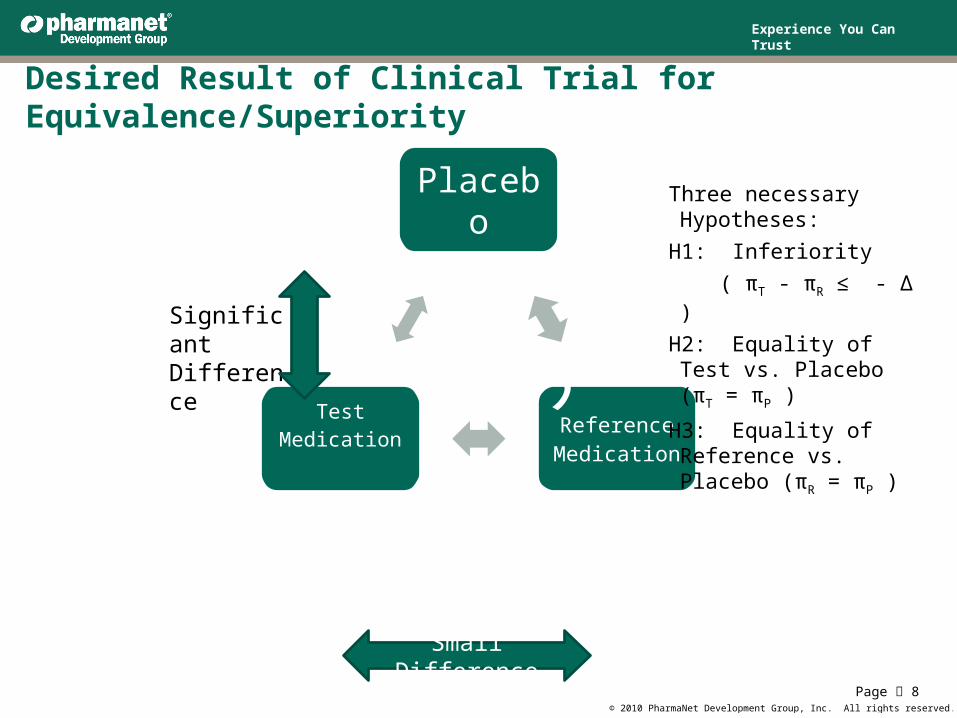
Desired Result of Clinical Trial for Equivalence/Superiority
Page 8
Placebo
H3Reference Medication
H3
Test Medication
H 3
Significant Difference
Small Difference
Three necessary Hypotheses:
H1: Inferiority ( πT - πR ≤ - Δ )
H2: Equality of Test vs. Placebo (πT = πP )
H3: Equality of Reference vs. Placebo (πR = πP )
Experience You Can Trust
© 2010 PharmaNet Development Group, Inc. All rights reserved.
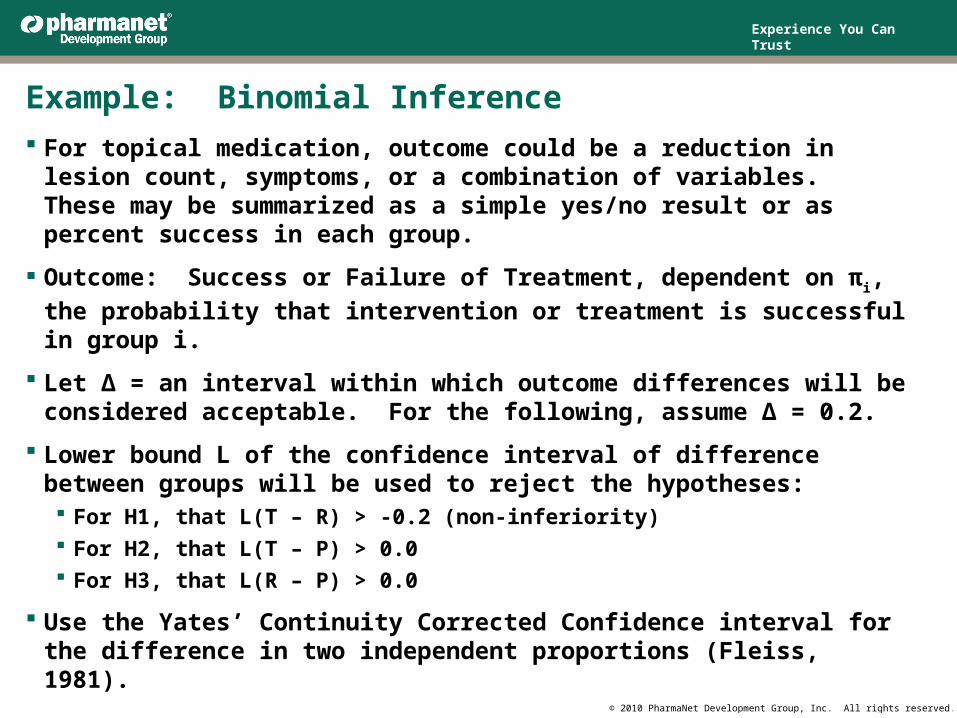
Example: Binomial Inference For topical medication, outcome could be a reduction in lesion count,
symptoms, or a combination of variables. These may be summarized as a simple yes/no result or as percent success in each group.
Outcome: Success or Failure of Treatment, dependent on πi, the probability that intervention or treatment is successful in group i.
Let Δ = an interval within which outcome differences will be considered acceptable. For the following, assume Δ = 0.2.
Lower bound L of the confidence interval of difference between groups will be used to reject the hypotheses: For H1, that L(T – R) > -0.2 (non-inferiority) For H2, that L(T – P) > 0.0 For H3, that L(R – P) > 0.0
Use the Yates’ Continuity Corrected Confidence interval for the difference in two independent proportions (Fleiss, 1981).
Experience You Can Trust
© 2010 PharmaNet Development Group, Inc. All rights reserved.
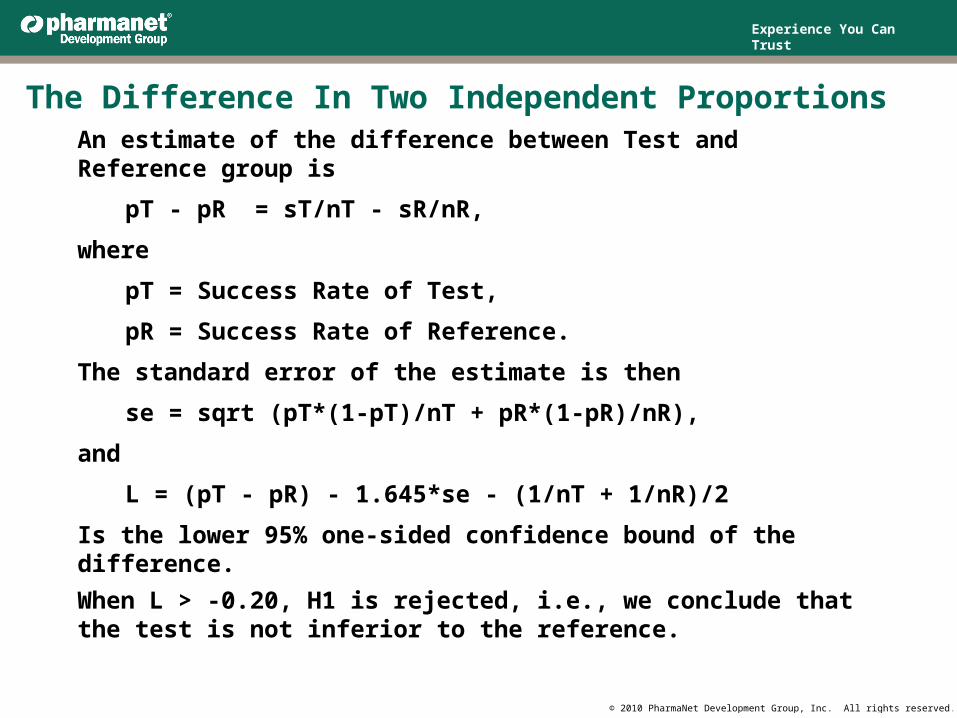
The Difference In Two Independent Proportions
An estimate of the difference between Test and Reference group is pT - pR = sT/nT - sR/nR,
where pT = Success Rate of Test,pR = Success Rate of Reference.
The standard error of the estimate is thense = sqrt (pT*(1-pT)/nT + pR*(1-pR)/nR),
andL = (pT - pR) - 1.645*se - (1/nT + 1/nR)/2
Is the lower 95% one-sided confidence bound of the difference.When L > -0.20, H1 is rejected, i.e., we conclude that the test is not inferior to the reference.
Experience You Can Trust
© 2010 PharmaNet Development Group, Inc. All rights reserved.
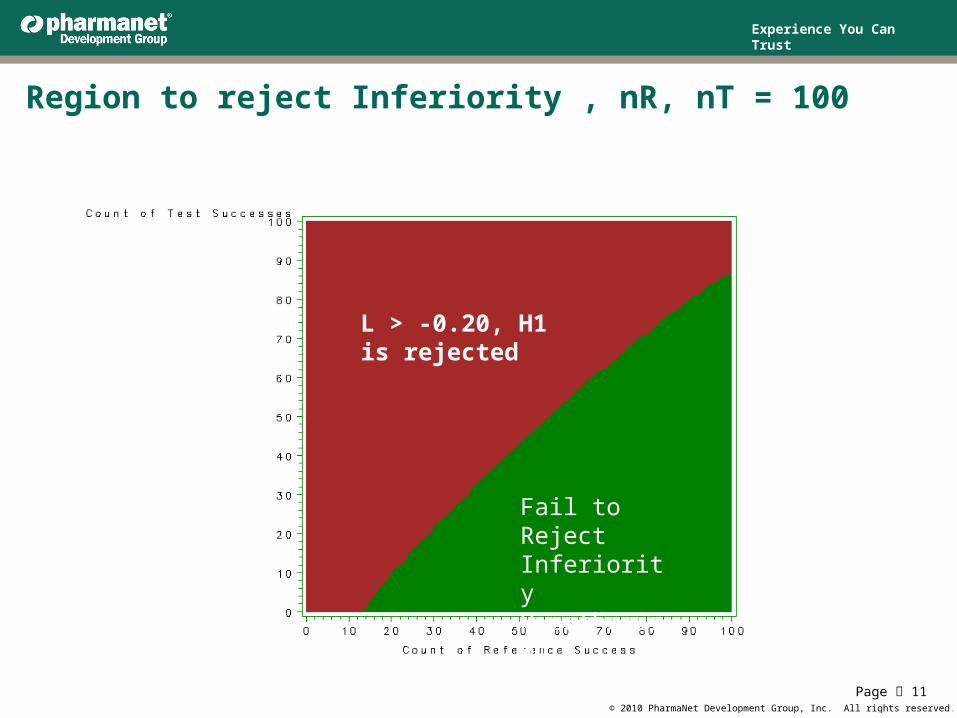
Region to reject Inferiority , nR, nT = 100
Page 11
L > -0.20, H1 is rejected
Fail to Reject Inferiority Hypothesis H1
Experience You Can Trust
© 2010 PharmaNet Development Group, Inc. All rights reserved.
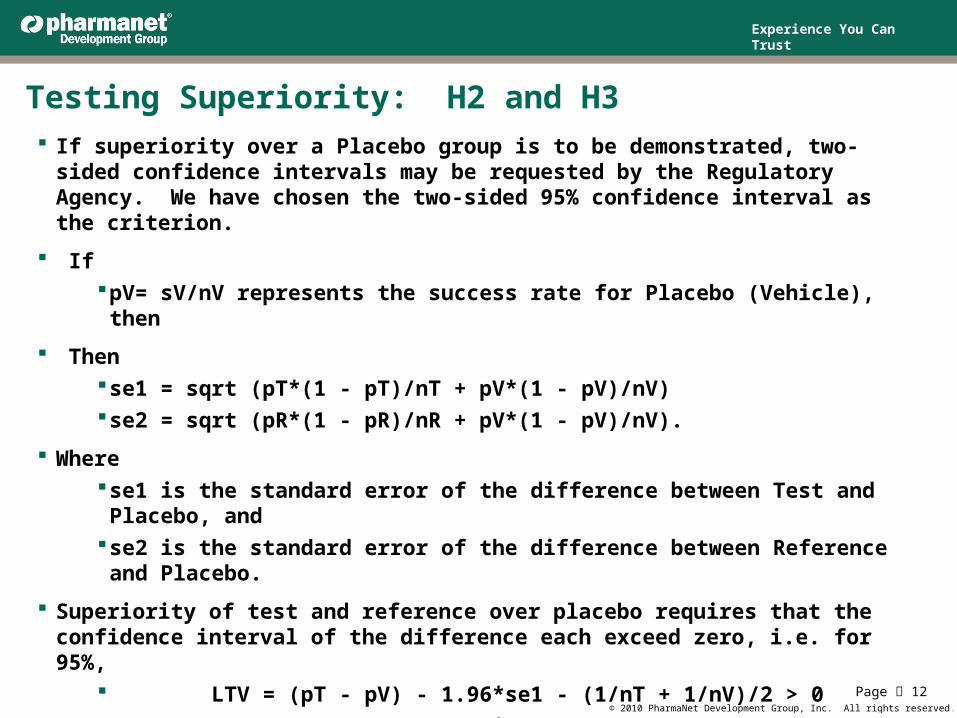
Testing Superiority: H2 and H3 If superiority over a Placebo group is to be demonstrated, two-sided confidence
intervals may be requested by the Regulatory Agency. We have chosen the two-sided 95% confidence interval as the criterion.
IfpV= sV/nV represents the success rate for Placebo (Vehicle), then
Thense1 = sqrt (pT*(1 - pT)/nT + pV*(1 - pV)/nV) se2 = sqrt (pR*(1 - pR)/nR + pV*(1 - pV)/nV).
Where se1 is the standard error of the difference between Test and Placebo, and se2 is the standard error of the difference between Reference and Placebo.
Superiority of test and reference over placebo requires that the confidence interval of the difference each exceed zero, i.e. for 95%,
LTV = (pT - pV) - 1.96*se1 - (1/nT + 1/nV)/2 > 0 LRV = (pR - pV) - 1.96*se2 - (1/nR + 1/nV)/2 > 0.
Page 12
Experience You Can Trust
© 2010 PharmaNet Development Group, Inc. All rights reserved.
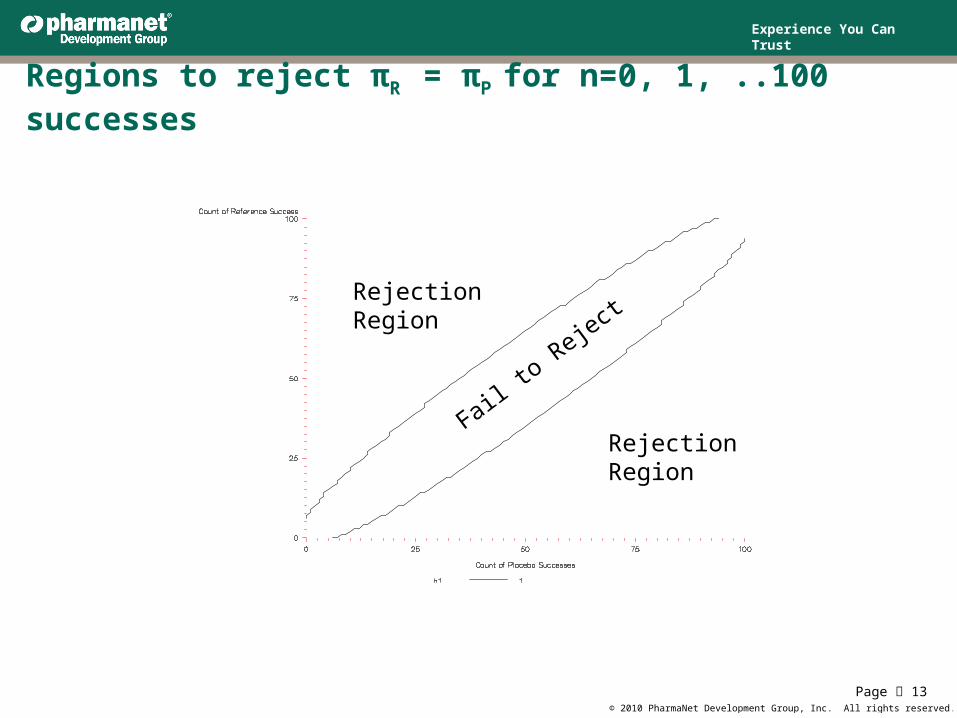
Regions to reject πR = πP for n=0, 1, ..100 successes
Page 13
Rejection Region
Rejection Region
Fail to Reject
Experience You Can Trust
© 2010 PharmaNet Development Group, Inc. All rights reserved.
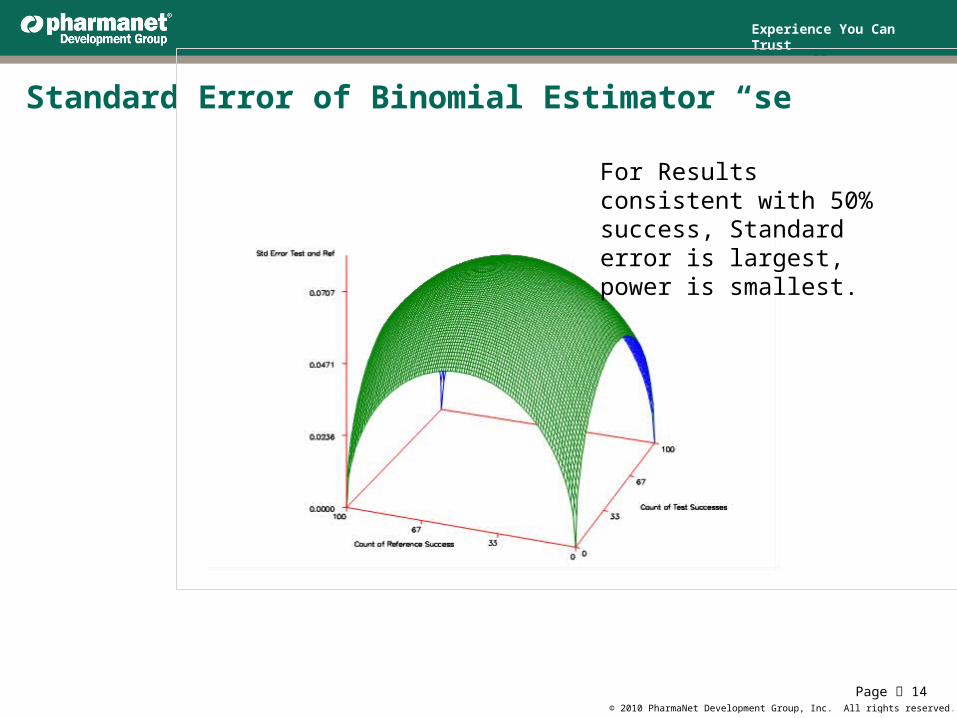
Standard Error of Binomial Estimator “se”
Page 14
For Results consistent with 50% success, Standard error is largest, power is smallest.
Experience You Can Trust
© 2010 PharmaNet Development Group, Inc. All rights reserved.
Simulate Trial Data Results based on πi and Δ
Assume that Test is non-inferior and actually π1 = π2.
Assume Placebo less than Active by Δ or more: π3 ≤ πi – Δ, i =(1,2).
Generate enough trials to accurately determine success rate of trial. Using 2500 trials per set gives a standard deviation of power less or equal to 0.5%.
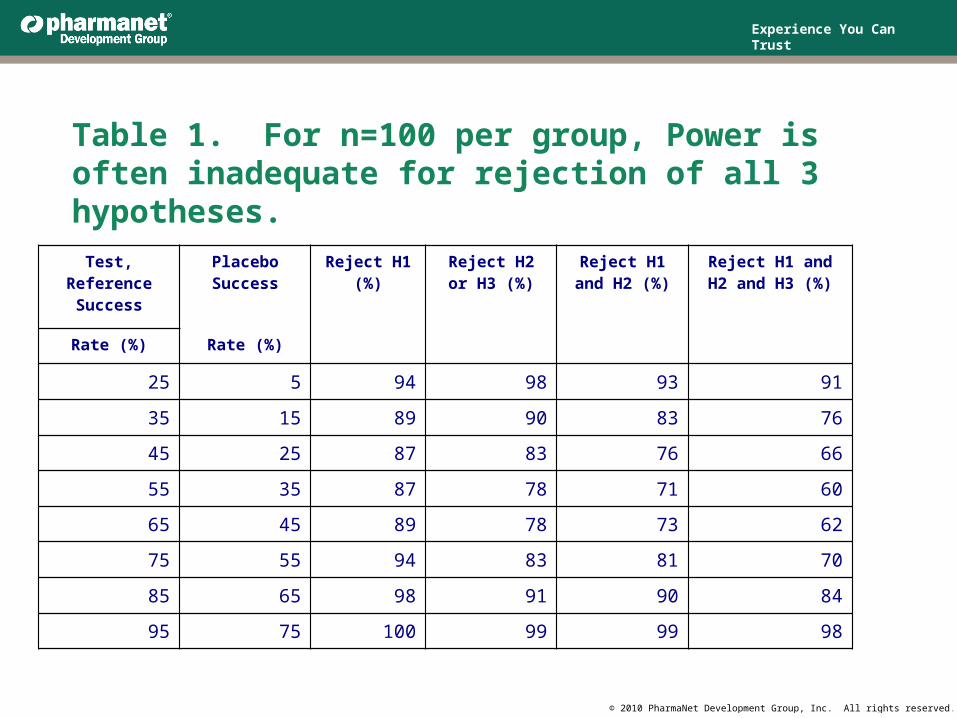
Record percent of trials where H1, H2, and H3 are rejected. Tables 1 and 2 show a range of success in rejecting individual and multiple
hypotheses where Δ = 0.2 and π3 = πi – 0.2, i =(1,2).
For sample size 100, Power is adequate for H1 or H2 when π1 = π2 = .35 and π3 = .15 but not adequate for rejecting all three hypotheses (Table 1 line 2).
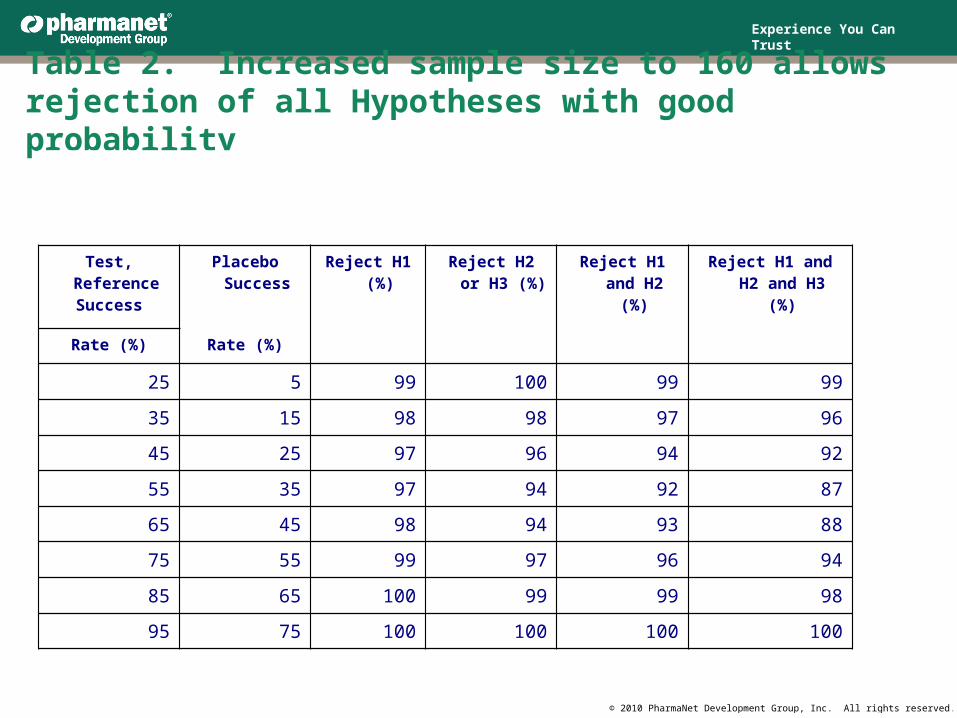
For sample size 160 (Table 2), Power is adequate to reject H1, H2 and H3 even at values around π1 = π2 = .5.
Experience You Can Trust
© 2010 PharmaNet Development Group, Inc. All rights reserved.
Test, ReferenceSuccess
Placebo Success Reject H1 (%)
Reject H2 or H3 (%)
Reject H1 and H2 (%)
Reject H1 andH2 and H3 (%)
Rate (%) Rate (%)
25 5 94 98 93 91
35 15 89 90 83 76
45 25 87 83 76 66
55 35 87 78 71 60
65 45 89 78 73 62
75 55 94 83 81 70
85 65 98 91 90 84
95 75 100 99 99 98
Table 1. For n=100 per group, Power is often inadequate for rejection of all 3 hypotheses.
Experience You Can Trust
© 2010 PharmaNet Development Group, Inc. All rights reserved.
Table 2. Increased sample size to 160 allows rejection of all Hypotheses with good probability
Test, Reference Success
Placebo Success Reject H1 (%)
Reject H2 or H3 (%)
Reject H1 and H2 (%)
Reject H1 and H2 and H3 (%)
Rate (%) Rate (%)
25 5 99 100 99 99
35 15 98 98 97 96
45 25 97 96 94 92
55 35 97 94 92 87
65 45 98 94 93 88
75 55 99 97 96 94
85 65 100 99 99 98
95 75 100 100 100 100
Experience You Can Trust
© 2010 PharmaNet Development Group, Inc. All rights reserved.
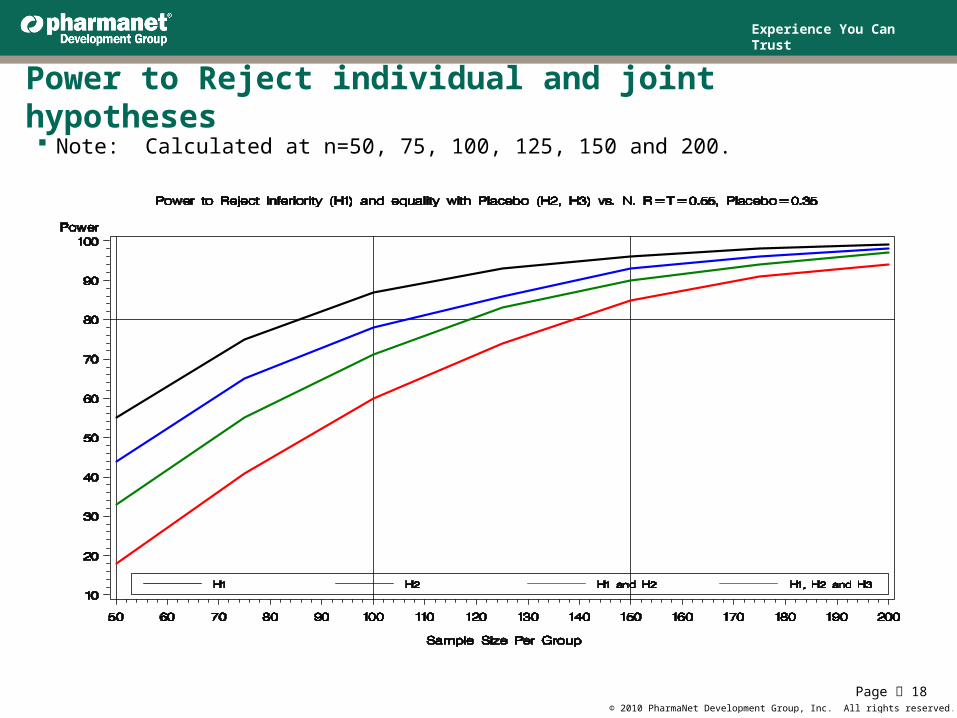
Power to Reject individual and joint hypotheses Note: Calculated at n=50, 75, 100, 125, 150 and 200.
Page 18
Experience You Can Trust
© 2010 PharmaNet Development Group, Inc. All rights reserved.
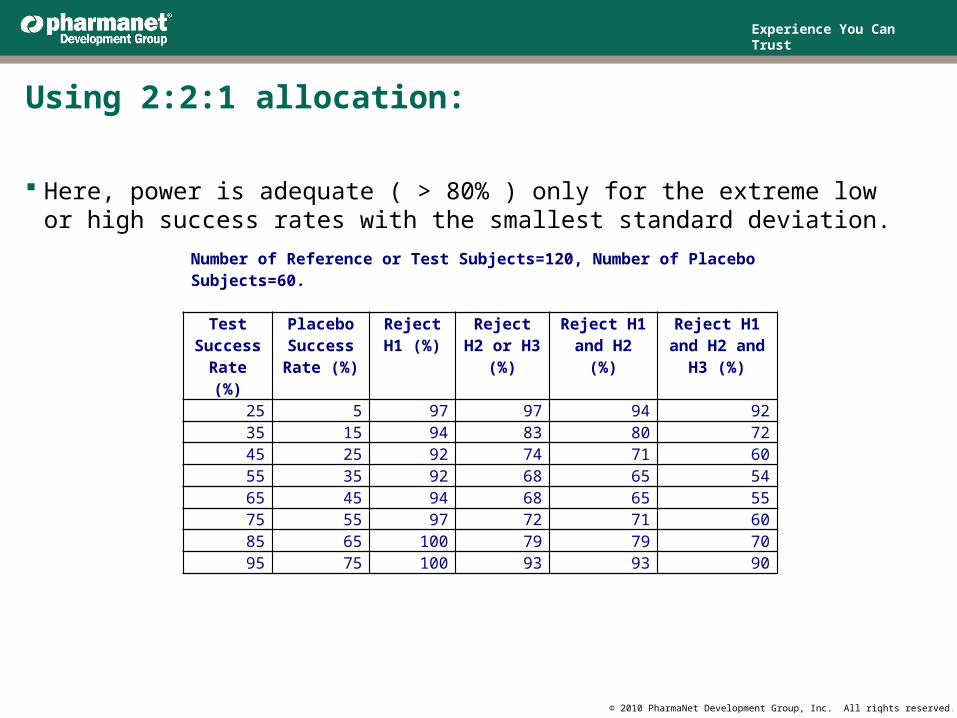
Using 2:2:1 allocation:
Here, power is adequate ( > 80% ) only for the extreme low or high success rates with the smallest standard deviation.
Number of Reference or Test Subjects=120, Number of Placebo Subjects=60.
Test Success
Rate (%)
Placebo Success
Rate (%)
Reject H1 (%)
Reject H2 or H3 (%)
Reject H1 and H2 (%)
Reject H1 and H2 and H3 (%)
25 5 97 97 94 9235 15 94 83 80 7245 25 92 74 71 6055 35 92 68 65 5465 45 94 68 65 5575 55 97 72 71 6085 65 100 79 79 7095 75 100 93 93 90
Experience You Can Trust
© 2010 PharmaNet Development Group, Inc. All rights reserved.
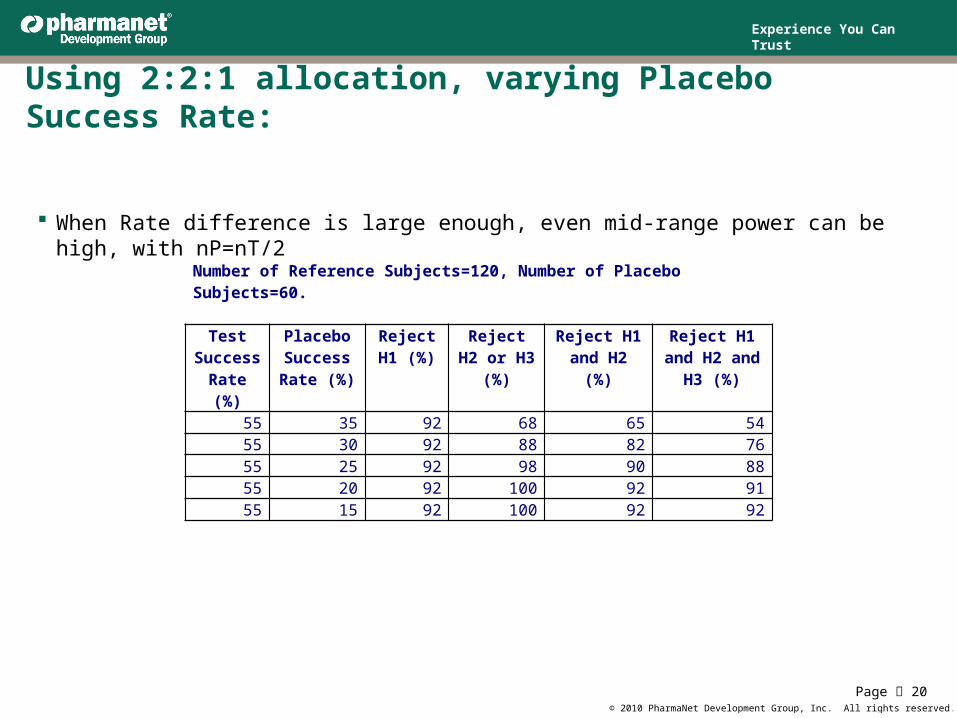
Using 2:2:1 allocation, varying Placebo Success Rate:
When Rate difference is large enough, even mid-range power can be high, with nP=nT/2
Page 20
Number of Reference Subjects=120, Number of Placebo Subjects=60.
Test Success
Rate (%)
Placebo Success
Rate (%)
Reject H1 (%)
Reject H2 or H3 (%)
Reject H1 and H2 (%)
Reject H1 and H2 and H3
(%)55 35 92 68 65 5455 30 92 88 82 7655 25 92 98 90 8855 20 92 100 92 9155 15 92 100 92 92
Experience You Can Trust
© 2010 PharmaNet Development Group, Inc. All rights reserved.
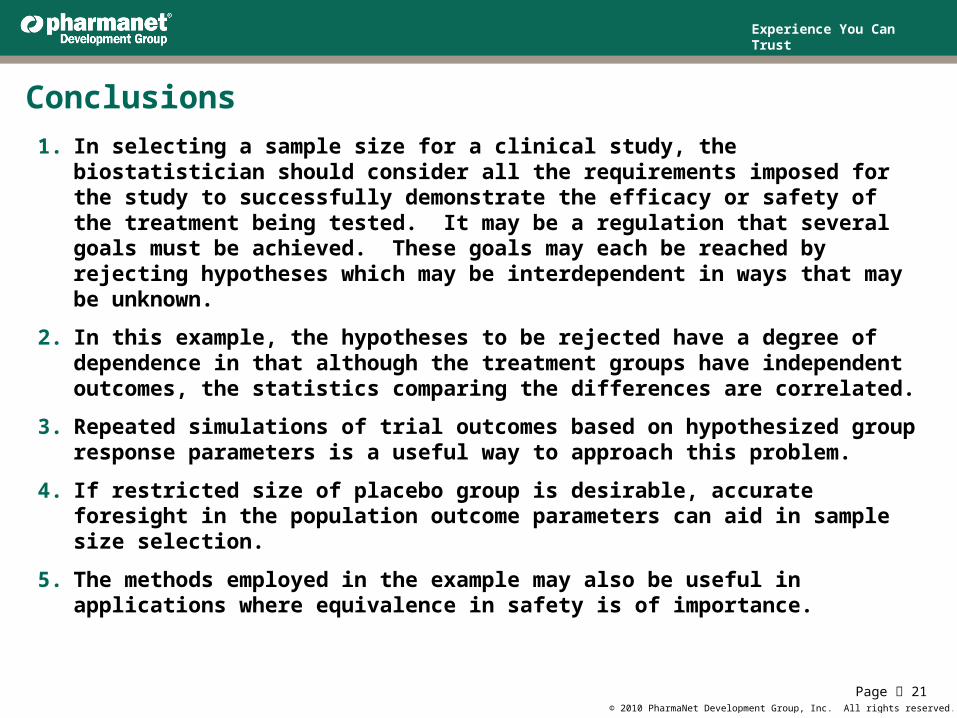
Conclusions1. In selecting a sample size for a clinical study, the biostatistician should consider all
the requirements imposed for the study to successfully demonstrate the efficacy or safety of the treatment being tested. It may be a regulation that several goals must be achieved. These goals may each be reached by rejecting hypotheses which may be interdependent in ways that may be unknown.
2. In this example, the hypotheses to be rejected have a degree of dependence in that although the treatment groups have independent outcomes, the statistics comparing the differences are correlated.
3. Repeated simulations of trial outcomes based on hypothesized group response parameters is a useful way to approach this problem.
4. If restricted size of placebo group is desirable, accurate foresight in the population outcome parameters can aid in sample size selection.
5. The methods employed in the example may also be useful in applications where equivalence in safety is of importance.
Page 21
Experience You Can Trust
© 2010 PharmaNet Development Group, Inc. All rights reserved.
Acknowledgments and Contact information
The authors would like to thank PharmaNet Development, Incorporated, for providing the materials and experiences that inspire this presentation.
PharmaNet Development Group, Inc.1000 CentreGreen WaySuite 300Cary, NC 27513
Page 22
Alan Davis:[email protected] Poole:[email protected] Kim:[email protected]
Experience You Can Trust
© 2010 PharmaNet Development Group, Inc. All rights reserved.
References: Fleiss, Joseph L., page 23, Statistical Methods for Rates and Proportions, 1981,
John Wiley & Sons.
Food and Drug Administration Reference P04-021, “Mupirocin Calcium Cream 0.2%)”.
International Conference on Harmonisation (2000). Guidance E10: choice of control group and related issues in clinical trials, http://www.ifpma.org/ich1.html
European Medicines Agency, “Guideline on the Choice of the Non-Inferiority Margin”, 2005.
“Non-inferiority trials: the ‘at least as good as’ criterion”, L. L. Laster and M.F. Johnson, Statistics in Medicine 2003: 22:187-200
Jacob Cohen, Statistical Power Analysis in the Behavioral Sciences, 1988, Lawrence Erlbaum Associates.
SAS Institute, Inc. (1990) SAS/GRAPH and SAS/STAT Software: Reference, Cary, NC: SAS Institute, Inc.


![Non-inferiority Trials Hypotheses and Analyses 2004 Chen.pdf · Control Trials. Encyclopedia of Biopharmaceutical Statistics: Second Edition. [2] Mark Rothmann, Ning Li, Gang Chen,](https://img.pdfslide.net/doc/110x75/60205ce870913614931fb43d/non-inferiority-trials-hypotheses-and-analyses-2004-chenpdf-control-trials-encyclopedia.jpg)