Embed Size (px)
Citation preview
SOCIAL STRATIFICATION
PRESENTED BY DR SABA MANSOOR
GUIDED BY DR HEMANT KUMAR

23/10/2015

33/10/2015

CONTENTS
1) Introduction
2) Definition
3) History
4) System of stratification.
5) Theories of class and stratification.
6) Indicators of socioeconomic position.
7) Socioeconomic status scale.
8) Impact of Socioeconomic status on health.
9) Conclusion
3/10/2015 4

Social Stratification
Social stratification is a term used in
the social sciences to describe the
relative social position of persons in a
given social group, category,geographical region or other social unit.
53/10/2015

SOCIAL STRATIFICATIONIt derives from the Latin strātum (plural strata;
parallel, horizontal layers) referring to a given
society’s categorization of its people into rankings
of socioeconomic tiers based on factors like
wealth, income, social status, occupation and
power
3/10/2015 6

Social Stratification
Stratification is the
division of society into
classes that have
unequal amounts of
wealth, power, and
prestige. In a stratified
society, inequality is part
of the social structure
and passes from onegeneration to the next.
- Max Weber 73/10/2015

Social Stratification
A system by which
a society ranks
categories of
people in a
hierarchy based on
their access to
scarce resources.
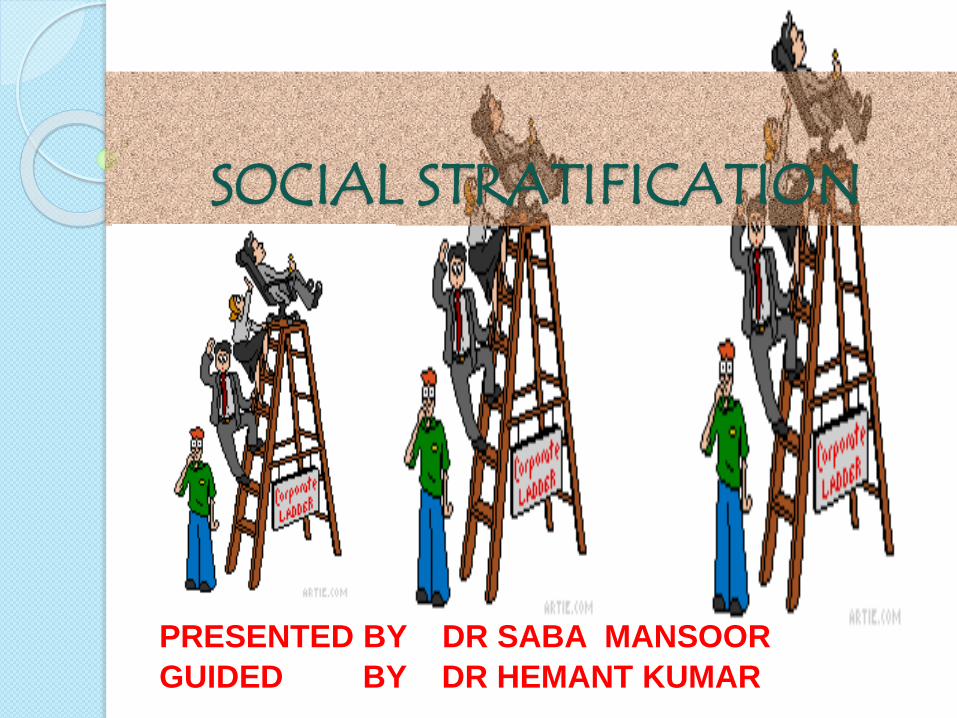
Definition
Arrangement of any
social group or
society into hierarchy
of positions that are
unequal with regard
to power, property,
social evaluation and
psychic gratification .
Melvin M.
Tumin,
3/10/2015 9

HISTORY
103/10/2015

Social Stratification: Ancient
Times
Most ancient societies could be
divided into two large groups:
The “haves” and the “have-nots.”
The “haves,” of course, were the upperclasses, generally consisting of rulers,nobles, and priests.
The “have-nots” was made up mostly ofmerchants, artisans, and peasants.
In every ancient civilization, there was alarge slave class at the bottom of the socialstructure
113/10/2015

ANCIENT EGYPT
In ancient Egypt there were four social
classes. At the top was the royal family, along
with a large number of nobles and priests.
Next class was of professional soldiers,
Middle class comprised of merchants, artisans,
and scribes .
Lastly the peasants, who were mostly farmers.
And at the bottom, of course, were the slaves,
many of whom had been brought to Egypt as prisoners of war.
123/10/2015

CHINA
China had nothing resembling a caste system. At
the top, below the ruler, was a class of great feudal lords who governed the land in his name.
Next came a class of knightly gentry, or
landowners, who served at court and fought in the armies of the feudal lords.
At the bottom were the peasants on whose labor everyone relied.
Merchants and artisans, like slaves, were not
recognized as belonging to any class.
133/10/2015

INDIA
In early India, the society was
divided into three classes consisting of the
rich and powerful, a middle class of merchants
and farmers, and a lower class of workers and slave.
Around 1500 BC Aryans moved into northern
India from central Asia. They came into India
as , nomadic tribes led by warrior chieftains.
Over time, they settled down as rulers over the
native Dravidians and formed tribal
kingdoms. This lasted till Maurya Empire till320 BC
143/10/2015

India ...They gave re-birth to Urban
Civilisation and class and caste
system. There were some 3,000 castes,
divided into four classes.
The first class consisted of Brahmans,
or priests, followed in order by the
nobles and warriors (Kshatriyas), the
merchants, farmers, and traders
(Vaishyas), and the Shudras.
153/10/2015

Contd...
At the very bottom of
Indian society was a
group not belonging to
any caste. They were
known as the
untouchables and
performed jobs
considered polluting,
such as that of
butchers or street
sweepers163/10/2015

Global
stratification
173/10/2015

Global stratification
Is social stratification on a global
scale. Where social stratification
draws attention to inequalities
between smaller groups of people,
global stratification draws attentionto inequalities among all the
countries.
183/10/2015

THREE-WORLD MODEL
For a long time, Americans used three
categories to stratify nations: first-, second-
, and third-world.
The First World included the U.S. and
other capitalist nations . Communistnations made up the Second World.Third
World was everyone else. So the
categories were originally based on political
ideology.
193/10/2015

Global Stratification ......
Global stratification categories today are high-, middle-, and low-income countries.
HIGH-INCOME COUNTRIES
Approximately 25% of the nations in the
world, hold most of the world's wealth. Three
examples are the United States, the United
Kingdom, and Japan
203/10/2015

Contd...
MIDDLE-INCOME COUNTRIES - the largest
proportion of the world's nations - about 42% -falls into the middle-income category have
average income and a standard of living .
India, Egypt, and Mexico are examples of
middle-income countries.
LOW INCOME COUNTRIES : This is third
category is which constitute people living with
limited resorces e.g.Bangladesh,Pakistan,and
Afghanistan etc..
213/10/2015

1. Property– associated with education, income and occupation
SOCIAL STRATIFICATION is based on Three major premises
2. POWER – ability of one party to affect the behavior of another party
3. PRESTIGE – the distinction or reputation and how people are subjectively evaluated by others
3/10/2015 22

PROPERTY (WEALTH)
3/10/2015 23Forbes

LIST OF COUNTRIES BY DISTRIBUTION OF WEALTH.
3/10/2015 24

List of countries by distribution of
wealth
25
1. United States 25.4%
2. JAPAN 09.86%
3. CHINA 08.77%
4. U.K. 04.715. GERMANY 04.65%
6. ITALY 04.34
7. INDIA 04.14%
8. FRANCE 03.49%
9. RUSSIA 01.51%http://en.wikipedia.org/wiki/List_of_countries_by_wealth_
3/10/2015

List of countries by GDP (nominal)2013Rank Country/Region GDP (Millions of US$)
World 72,689,734
1 United States 16,768,100
2 China 9,181,204
3 Japan 4,898,532
4 Germany 3,730,261
5 France 2,806,432
6 United Kingdom 2,678,455
7 Brazil 2,243,854
8 Italy 2,149,485
9 Russia 2,096,774
10 India 1,937,797
26
http://en.wikipedia.org/wiki/List_of_countries_by_GDP_%28nominal%29
3/10/2015

Richest Countries in the World in year 2014
RANK COUNTRY
Current International
Dollar (GDP based on
PPP per capita YEAR
2014)
1 Qatar 1,45,894.18
2 Luxembourg 90,332.89
3 Singapore 78,761.92
4 Brunei Darussalam 73,823.13
5 Kuwait 70,785.46
6 Norway 64,363.14
7 United Arab Emirates 63,180.83
8 Switzerland 53,976.60
9 United States 53,000.97
10 Hong Kong SAR 52,984.06
SOURCE World Economic Outlook Database, October 2014273/10/2015

Lowest Per capita180 Korea, North 583
181 Mozambique 579
— Zanzibar 565
182 Guinea 532
183 Gambia, The 512
184 Guinea-Bissau 510
185 Eritrea 507
186 Central African Republic 483
187 Madagascar 447
188 Niger 395
189 Liberia 356
190 Malawi 355
191 Ethiopia 354
192 Congo, Democratic Republic of the 286
193 Burundi 229
28http://en.wikipedia.org/wiki/List_of_countries_by_GDP_%28nominal%29_per_capita
142 India 1,509
3/10/2015

Richest Men in the World. Bill Gates
Net Worth: $76 BSource of wealth: Microsoft
2. Carlos Slim Helu & familyNet Worth: $72 BSource of wealth: telecom
3. Amancio OrtegaNet Worth: $64 BSource of wealth: retail
Warren BuffettNet Worth: $58.2 BSource of wealth: Berkshire Hathaway
5. Larry EllisonNet Worth: $48 BSource of wealth: Oracle
6. Charles KochNet Worth: $40 BSource of wealth: diversified
6. David KochNet Worth: $40 BSource of wealth: diversified
40. Mukesh AmbaniNet Worth: $18.6 BSource of wealth: petrochemicals, oil & gas
29
61. Azim Premji
Net Worth: $15.3 B
Source of wealth: software
122. Hinduja Brothers
Net Worth: $10 B
Source of wealth: diversified
418 Anil Ambani
$ 4B #19 in India
Source Of Wealth-diversified
3/10/2015

PRESTIGE
Defence Minister AK Antony is
the poorest minister, with
personal assets worth Rs 1.8
lakh.
The Nobel Prize in Physiology or
Medicine 2010 was awarded to Robert
G. Edwards "for the development of in
vitro fertilization".
Meira Kumari, the first woman Speaker of
Lok Sabha on 3 June 20093/10/2015 30

POWER
3/10/2015 31Coercion
Authority

FOUR BASIC PRINCIPLES OF
SOCIAL STRATIFICATION:
1. It is a characteristic of
society, not simply a
reflection of individual
differences.
2. It persists over
generations.
3. It is universal but variable.
4. It involves not just
inequality but beliefs.3/10/2015 32

MAJOR SYSTEMS OF STRATIFICATION
Historically, four basic system of stratification
can be distinguished:
1. slavery,
2. caste,
3. Estates &
4. class.
Slavery is an extreme form of inequality, in
which certain people are owned as property
by others.
3/10/2015 33

SLAVERY SYSTEM
Reasons?
1) Birth
2) Consequence of
committing a crime
3) Military defeat
4) Indebtedness
5) Capture and sale
3/10/2015 34

Slavery..
According to the British Anti-Slavery
Society, "Although there is no longer
any state which recognizes any claim by
a person to a right of property over
another, there are an estimated 27
million people throughout the world,
mainly children, in conditions of slavery.”
3/10/2015 35

CASTE
• A caste system is a social system in
which ones social status is given for
life.
• Caste system is a closed system. A
person is born into a caste and
remains there for life.
3/10/2015 36

Contd...…
India made it illegal to
discriminate on the basis of caste in 1949.
Caste system remains strong in Indiathough the situation is changing .
Caste also specifies the rituals peopleperform i.e.marriages etc.
The caste associations may establish
banks, schools, colleges, rest houses and
hospitals in the name and use in the fieldof politics.
3/10/2015 37

383/10/2015

ESTATES
Were part of European feudalism, but
also existed in many other traditional
civilisations.
3/10/2015 39
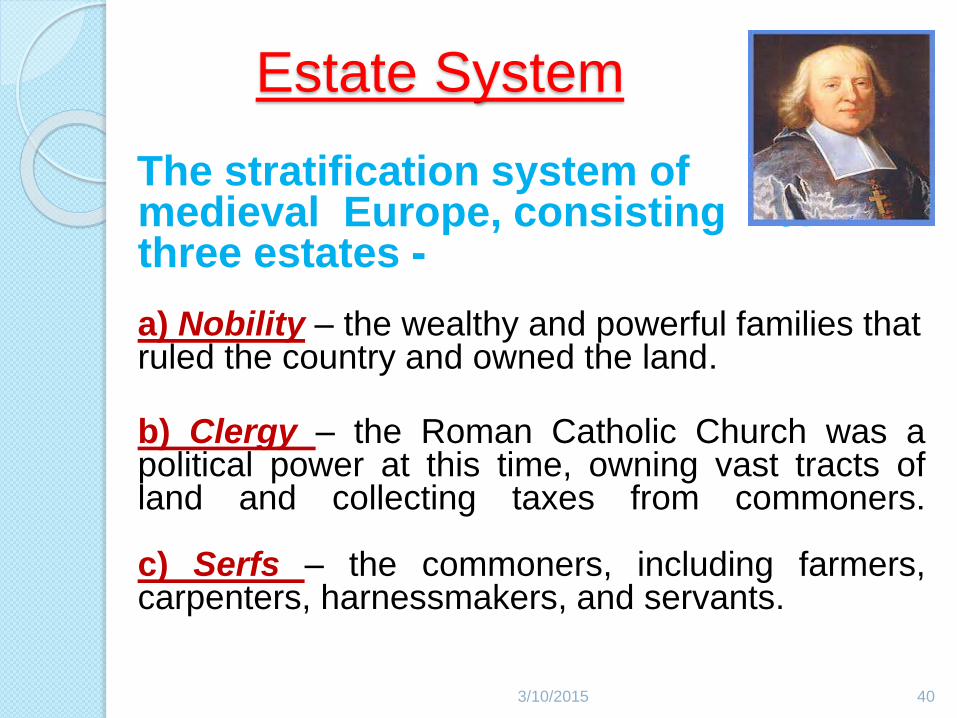
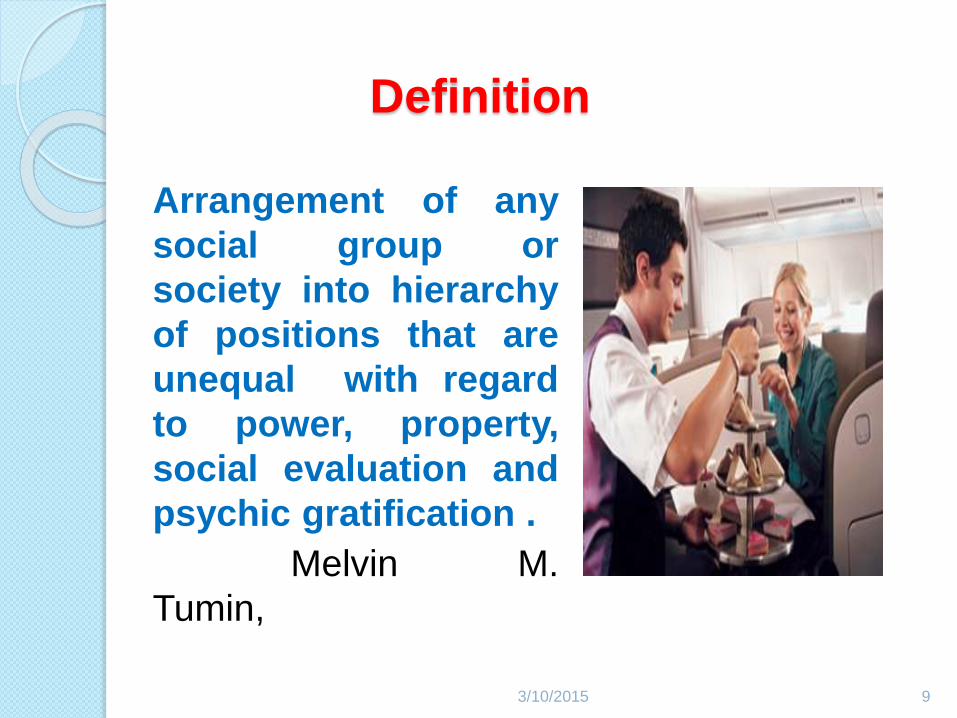
Estate System
The stratification system of medieval Europe, consisting of three estates -
a) Nobility – the wealthy and powerful families that ruled the country and owned the land.
b) Clergy – the Roman Catholic Church was apolitical power at this time, owning vast tracts ofland and collecting taxes from commoners.
c) Serfs – the commoners, including farmers,carpenters, harnessmakers, and servants.
403/10/2015

CLASS SYSTEM
3/10/2015 41
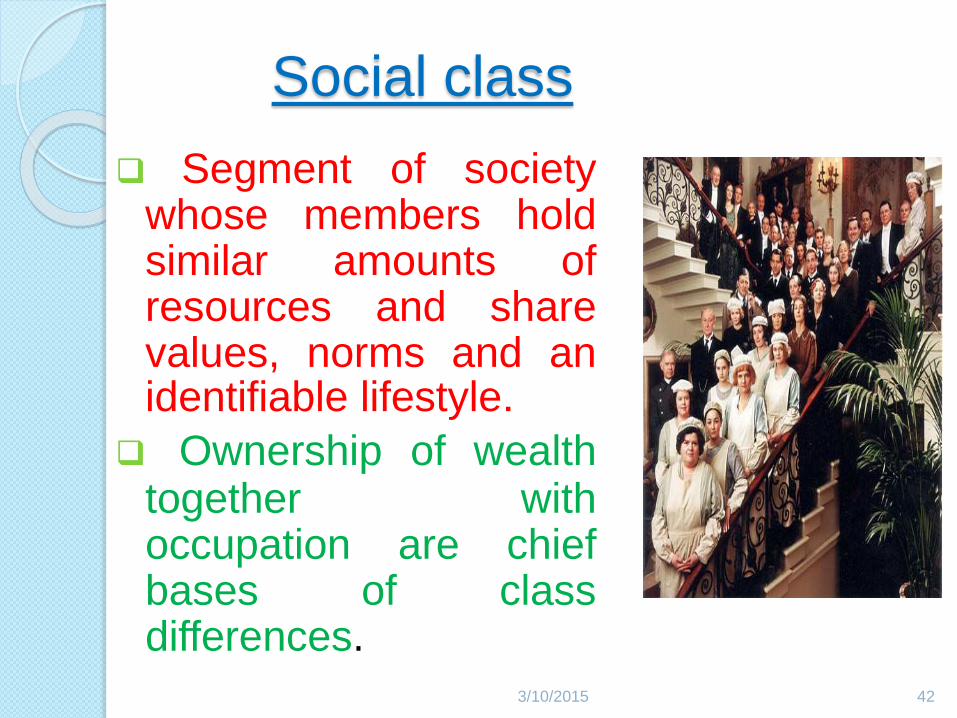
Social class
Segment of societywhose members holdsimilar amounts ofresources and sharevalues, norms and anidentifiable lifestyle.
Ownership of wealthtogether withoccupation are chiefbases of classdifferences.
423/10/2015
Classes differ from earlier forms of
stratification in four main respects
1. Class system are fluid.
2. Class positions are in some part achieved.
3. Class is economically based.
4. Class system are large scale and
impersonal
3/10/2015 43

RACE – biological attribution of
a group of people
transmitted from one
generation to another
OTHER BASES OF SOCIAL
STRATIFICATION
ETHNICITY – a distinctive
social identity based on
unique cultural traits
- Majority Cultural Groups
-Minority Groups/Cultural
Communities3/10/2015 44

GENDER – based on the personal
traits and social positions
that members of a society
attach to being male or female
AGE/AGING - can be examine according to 3
processes that affect people as they grow older
3 Processes
Biological
Psychological
Social3/10/2015 45

DISENGAGEMENT
THEORY – states that
older adults withdraw from
personal relationships,
society and from their
common social roles
ACTIVITY THEORY –
proposes that successful
aging occurs when older
adults stay active and
maintain social
interactions
SOCIAL GERONTOLOGY
3/10/2015 46

Is the movement between or
within social classes. Its of
two Types
• Horizontal mobility refers
to movement within a social
class or stratum.
• Vertical mobility refers to
the movement between
social classes or strata.
SOCIAL MOBILITY
3/10/2015 47

Contd…
• There are two kinds
of vertical mobility:
• Intragenerational
mobility (within a
person’s lifetime)
• Intergenerational
mobility (several
generations of one
family)
483/10/2015

• Individual effort
• Technological change
• Change in merchandising
patterns
• Increase in population’s
general educational level
Causes of
Upward Mobility
SOCIAL MOBILITY
• Personal factors such as
illness, divorce, or
retirement
• Technological change
altering the demand for
labor
• Overall economic health
Causes of
Downward Mobility
3/10/2015 49

SOCIAL MOBILITY -????
Slavery System - possible
Caste System - impossible
Estate System - low but possible
Class System - possible and frequently
occurring
3/10/2015 50

THEORIES OF
SOCIAL
STRATIFICATION
513/10/2015

For both the social categories Marx
used the word “ class” which is
defined in terms of the ownership
and non ownership of the means of
production.
Thus, class is a social group whose
members share a similar
relationship to the means of
production.
543/10/2015

Contd..
• Marx believes that those who own the means of production also exercises political and legal power-Ruling class.
• Service class- it has to abide by thelaws that the ruling class creates toprotect its interest.
• Marx says that the ideas prevalent ina given society at a given point of timeare in fact ideas of dominant class.
3/10/2015 55

According to Marx, the last stage of
class divided society would be
capitalism, where conflict would
take place between ruling and
service class.
Which would culminate in a society
where there would be no classes.
This society is called the communist
society.
3/10/2015 56

Communism FAILED!
This was because of lack of help from
most people and increase in greed.
(5 May 1818 – 14 March 1883) was a German philosopher,
sociologist , economic historian, journalist, and revolutionary socialist
who developed the socio-political theory of Marxism573/10/2015

MAX WEBERS THEORY
Weber believes that besidesclass, there are two other
forms namely status and
power.
The individuals skills determine
his class, which is dependentupon the market. People who
have no ownership of property but
have skills that are much needed
by the market have good chance
to survive. 3/10/2015 58

INDICATORS OF
SOCIO-ECONOMIC
POSITION
603/10/2015

1. EDUCATION
• Education can be measured as a
continuous variable or categorical
variable.
• Strong determinant of future
employment and income.
• The knowledge and skills attained
through education may affect a
person’s cognitive functioning.
3/10/2015 61

Contd...
Strengths
Education is comparatively easy to
measure in self administered
questionnaires.
Limitations
The meaning of educational level varies
for different birth Cohorts.
Education outside the country of
residence.
3/10/2015 62

2. INCOME
• Most directly measures the material
resources component.The
mechanisms through which income
could affect health are:
• Buying access to better quality
material
• Allowing access to services, which
may improve health directly.
• Fostering self esteem and social
standing. 3/10/2015 63
limitations...
Personal income is a sensitive issue
and people may be reluctant to provide
such information.
Do not share all of their income with the
rest of the household.
income is variable daily, weekly, or
seasonally.
3/10/2015 64

OCCUPATION
Occupation is strongly related to
income
Easier access to better health care,
access to education, and residential
facilities.
Occupation may also reflect specific
toxic environmental or work task
exposures such as physical demands
3/10/2015 65

Limitations........
Cannot be readily assigned to
people who are not currently
employed.
3/10/2015 66

HOUSING CONDITIONS AND AMENITIES
Strength
• They are comparatively easy to collect
• Some indications of specific
mechanisms linking SEP to particular
health outcomes .
3/10/2015 67

Limitations
• These indicators may be specific to
the geographical context where they
were developed and thus be difficult to
compare across studies.
3/10/2015 68

SOCIO-ECONOMIC STATUS SCALE
Several methods or scales have been proposed for classifying different populations by socioeconomic status in India.
1. Rahudkar scale 1960
2. B G prasad 1961
3. Udai Parikh scale 1964
4. Jalota Scale 1970
5. Pareek & Kulshrestha scale 1972
6. Kuppuswamy scale 1976
7. Shrivastava scale 1978.
8. Bharadwaj scale 2001
9. Hollingshed (USA)
3/10/2015 69

SOCIO-ECONOMIC STATUS SCALE (RURAL)
By Udai Pareek (1964)
This scale has nine parameters which
assess the socio-economic status of the
individual:-1. Caste
2. Occupation
3. Education
4. Social participation
5. Land
6. House
7. Farm powers
8. Material possession and
9. Family703/10/2015

Udai Pareek SES Scale(Rural)
1. Caste :Schedule Caste -1, Lower caste -2 ,Artisan Caste -3 ,Agriculture – 4,
Prestige Caste -5,Dominant Caste -6
2. Occupation: Labor=1, Caste occupation=2, Business=3, inde-pendent
profession=4, cultivation=5, Service=6 .
3. Education: Illiterate=0, Can read only=1, Can read and write=2, Primary=3, Middle=4, High school=5, Graduate=6 .
4. Social Participation: Mem-ber of one organization=1, Member of more than one organization=2, Office holder=3, Wider public leader=6
5. Land: 0= no land, 1= < 1 acre, 2= 1-5 acres, 3= 5-10 acres, 4= 10-15 acres, 5= 15-20 acres, 6= >20 acres
6. House: No home=0, Hut=1, Katcha house=2, Mixed house=3, Puccahouse=4, Mansion=6
7. Farm power: 1= no drought animal, 2= 1-2 drought animals, 4= 3-4 drought animals or =1 prestige animal, 6= 5-6 drought animals or tractor
8. Material Possession: Bullock-cart=1, Cycle=1, Radio=1, Chairs=1, improved agricultural implements=2, Mobile Phone=4, Television= 3, Refrigerators=8
9. Family: Type: Single=1, Joint=2, Extended= 3, Size: Up to 5=2, Distinctive features=2
713/10/2015

Score
The reliability of the scale was found
to be very high(r = 0.93).
Total score Social class
Above 43 Upper Class (I)
33-42 Upper Middle Class (II)
24-32 Middle Class (III)
13-23 Lower Middle Class (IV)
Below 13 Lower Class (V)
723/10/2015

The Hollingshead Four Factor SES
Scale
The Hollingshead Four Factor Index of
Socioeconomic Status is a survey designed
to measure social status of an individual
based on four domains:
a) Marital status,
b) Retired/employed status,
c) Educational attainment,
d) Occupational prestige.
733/10/2015

3/10/2015 74
Classification for 2013 Socio Economic
Status: Class BG Prasad’s Classification of
1961 Modified BG Prasad’s Classification
for 2013
1961 Jan 2015 I Rs 100 and above Rs> 5797
II Rs 50-99 Rs>2898-5797
III Rs 30-49 Rs 1932-2577
IV Rs 15-29 Rs 869-1546
V Below Rs 15 Below Rs 869
They have been calculated as: New income
value = 2.38 × (old value × 4.63 × 4.93). All-India Average CPIfor Industrial Workers in
Jan 2015= 254

Contd..
Strength
• Applicable to both rural and urban area.
• Can be modified according to current
CPI.
Easy to measure.
Limitation
• Single indicator.
• Reluctance by the people to reveal.
• Impractical today & has lower validity
due to great variations in CPI.3/10/2015 75

KUPPUSWAMY REVISED SCALE 2012
3/10/2015 76
(A) Education Score1 Professional or Honors
4
2 Graduate or Post Graduate 3
3 High school or Intermediate or Diploma
2
4 Illiterate or Primary school 1
(B) Occupation Score1 Legislators, Senior Offi cials, and Managers 13
2 Professionals 11
3 Technicians and Associate Professionals
94 Clerks 7
5 Service Workers /Shop/Market Sales Workers 66 Skilled Agricultural and Fishery Workers
5
7 Craft and Related Trades Workers 4
8 Plant and Machine Operators and Assemblers 3
9 Unskilled worker 2

3/10/2015 77
(C) Monthly family income Jan 2015 (INR)
7. ≥ 373386. >18669 – 37338
5. >14360 – 18669
4. >9573 – 14360
3. >5657 – 9573
2. >1895 – 5657
1. ≤ 1895
Total Score Socioeconomic class
26–29 Upper (I)
16–25 Upper Middle (II)
11–15 Middle/Lower middle (III)
5–10 Lower/Upper lower (IV)
<5 Lower (V)
Current income groups = Original family income groups of Kuppuswamy
(1976) X current consumer price index X 0.0735 (multiplication factor)
2000 X 254 X 0.0735

Kuppuswamy classification….
Strengths
• Multiple indicators.
Limitations
• Only urban population.
• Highest level of income which is shown by Kuppuswamy is also inconsistent across various economic groups in the present time.
• Educational and occupational factors not revised.
3/10/2015 78

THE WEALTH INDEX
The NFHS-3 wealth index is based on
the following 33 assets and housing
characteristics and is a composite measure of a household's cumulative living standard.
The wealth index is calculated using easy-to-
collect data on a household's ownership of
selected assets, such as televisions and
bicycles; materials used for housing
construction; and types of water access and
sanitation facilities.
793/10/2015

Contd....
• Uses information on 33 household assets and housing characteristics, such as ownership of consumer items, type of dwelling, source of water, and availability of electricity etc..
Combines this information into a singlewealth index, using a scientific method ofassigning weights to individual components
The household population is divided into fiveequal groups of 20% each (quintiles) at thenational level from 1 (lowest, poorest) to 5(highest, wealthiest)
3/10/2015 80

Contd....STRENGTH• Multiple indicators. The wealth index is
particularly valuable in countries that lackreliable data on income andexpenditures, which are the traditionalindicators used to measure householdeconomic status.
Limitations• Income not included as indicators.• Not revised after 1964.• So not applicable to current time.
3/10/2015 81

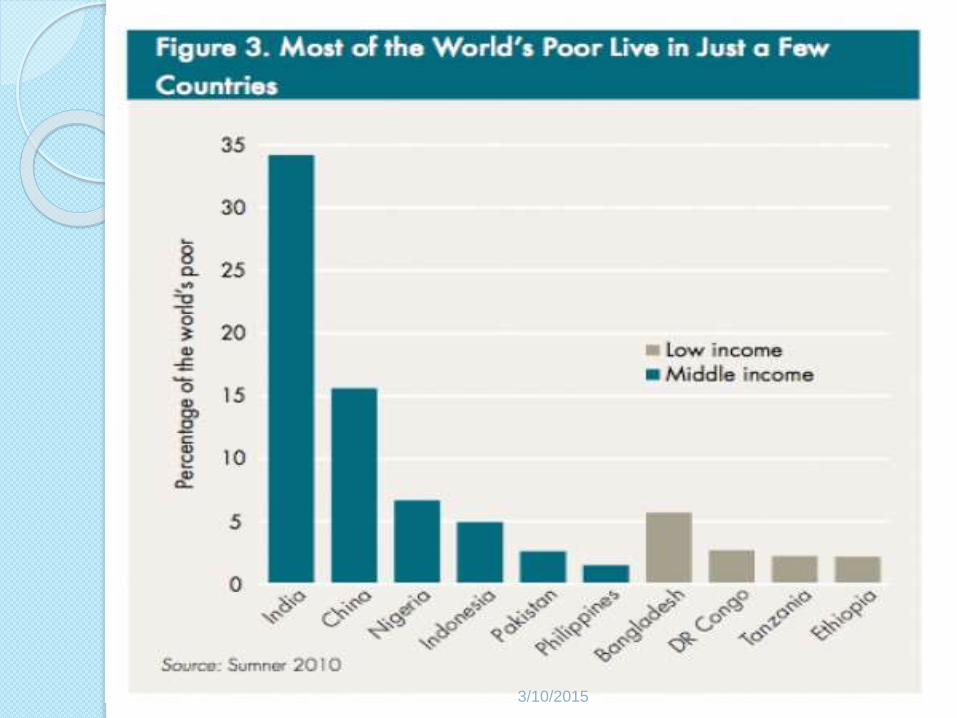
POVERTY IN INDIA
823/10/2015

POVERTY IN INDIA
India has two things in abundance:
People and Poverty! We can also call it PRC – poverty rich country!
There are poor everywhere – one-third
of world’s poor live here. Add to this the
poor of Pakistan and Bangladesh and
you can discover almost half of global poverty only in this region of South Asia
833/10/2015

NEW POVERTY LINE : JULY 2014 Rs 32 in villages, Rs 47 in cities Those
spending over Rs 32 a day in rural areas
and Rs 47 in towns and cities should not be
considered poor, an expert panel headed by
former RBI governor C Rangarajan.
60% of the poor still reside in the states of
Bihar, Jharkhand, Odisha, Madhya Pradesh,
Chattisgarh, Uttar Pradesh and
Uttarakhand.
843/10/2015

REPORT BY RANGARAJAN
COMMITTEE
The latest report by Rangarajan committee
has added almost 100 million more peopleto the list of poor
The Rangarajan report has added 93.7
million more to the list of the poor
assessed last year as per the Suresh
Tendulkar committee formula. Now the
total number of poor has reached 363
million from 269 million in 2011-12.
853/10/2015

No. of Rural
poor
No. of urban
poorTotal
Percent of
poor
Rangarajan
Committee260.5 million 102.5 million 363 million 29.5
Tendulkar
committee216.5 million 52.8 million 269 million 21.9%
Difference 44 million 49.7 million 93.7 million
863/10/2015

Contd...
The methods also included on
certain normative levels of adequate
nourishment, clothing, house rent,
conveyance, education and also behavioral
determination of non-food expenses.
It also considered average requirements of
calories, protein and fats based on ICMR
norms differentiated by age and gender.
873/10/2015
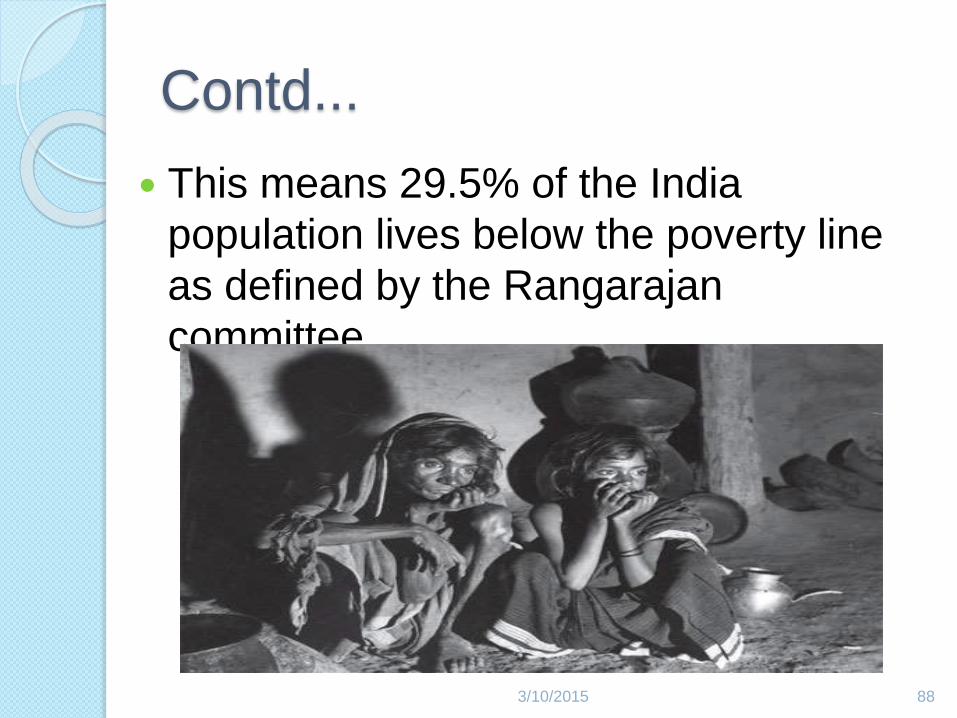
Contd...
This means 29.5% of the India
population lives below the poverty line
as defined by the Rangarajan
committee
883/10/2015

BPL
International Criteria
Less than $1.25 per person per day of
purchasing power.
3/10/2015 89

90
http://www.livemint.com/Politics/1QvbdGnGySHo7WRq
1NBFNL/Poverty-rate-down-to-22-Plan-panel.html3/10/2015
913/10/2015
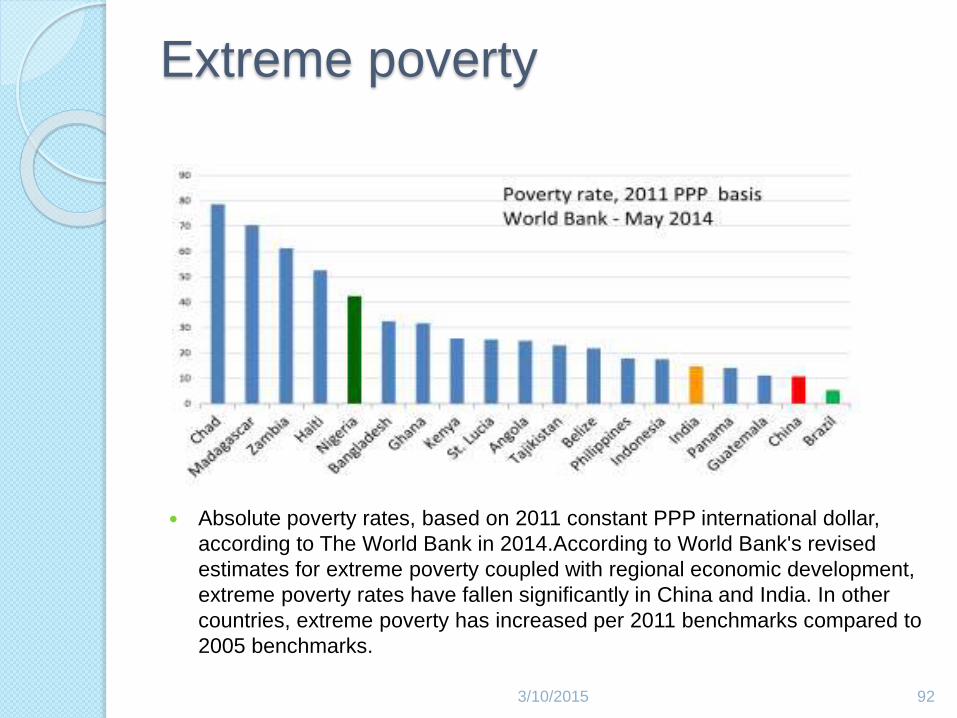
Extreme poverty
Absolute poverty rates, based on 2011 constant PPP international dollar,
according to The World Bank in 2014.According to World Bank's revised
estimates for extreme poverty coupled with regional economic development,
extreme poverty rates have fallen significantly in China and India. In other
countries, extreme poverty has increased per 2011 benchmarks compared to
2005 benchmarks.
923/10/2015

93http://www.un.org/millenniumgoals/bkgd.shtml
3/10/2015

SOCIO-ECONOMIC CONDITIONS
AND HEALTH
Poverty and poor health worldwide
are inextricably linked. The causes of
poor health for millions globally are
rooted in poor socio- economicconditions.
Poverty is both a cause and a
consequence of poor health.
943/10/2015

Contd..
Poverty increases the chances of
poor health. Poor health in turntraps communities in poverty.
Infectious and neglected tropical
diseases kill and weaken millions
of the poorest and most vulnerable
people each year
953/10/2015

MAIN EFFECTS OF POVERTYMalnutrition is the most common effect of
poverty is malnutrition.This is especiallyseen in children of poor families. Peopleliving in poverty rarely have access to highlynutritious foods. 2. Health
Health. One of the most severe effects ofpoverty are the health effects that arealmost always present. Diseases are verycommon in people living in poverty becausethey lack the resources to maintain ahealthy living environment.
963/10/2015

Education.Education is largely affected by
poverty. Many people living in poverty are
unable to attend school from a very early
age.
Economy.Among the effects of poverty
includes its impact on the economy of the
country. Mainly, the number of people living
in poverty influences employment rates
heavily. Without an education, people are unlikely to find a paying job.
973/10/2015

Social effects. Many people living in
poverty are homeless, which puts them on
the streets. There is also a connection
between poverty and crime.
When people are unemployed and
homeless and have nothing and no
money to buy necessities, they may be
forced to turn to theft in order to survive.
983/10/2015
Socio-Economic status of
India
National Family Health Survey
(NFHS-3) - 2005-06
Key Findings
993/10/2015

Distribution of Households by Wealth
Index and Caste
50
2818
10
24
25
22
14
13
21
23
17
8
17
21
24
510
16
36
ST SC OBC Other
Lowest Second Middle Fourth Highest
3/10/2015 101

Education and body weight.
3/10/2015 103

3/10/2015 104

3/10/2015 105

3/10/2015 106

3/10/2015 107

UTILIZATION OF HEALTH SERVICES NFHS 3
Wealthier households were less likely to
use the public health sector than the
households in the lower quintiles of wealth
index.
Among households that do not use govt.
health facilities, the main reasons given for
not doing so are poor quality of care( 58%),
lack of nearby facility(47%) and long
waiting times(25%).
3/10/2015 108

BENEFITS TO BPL
CARD HOLDERS
1093/10/2015

ANTYODAYA ANNA YOJANA” (AAY)
To make TPDS more focused towards the
poorest of the poor category of the
population, AAY “was launched inDecember 2014 to provide wheat and
Rice @ Rs. 2 & 3 per kg (Total 35Kg).
The States/UTs are required to bear the
distribution cost, including margin todealers.
1103/10/2015

AAY - GUIDELINES
Landless agriculture labourers, marginal
farmers, rural artisans/craftsmen, such
as potters, tanners, weavers,
blacksmiths, carpenters, slum dwellers
and persons earning their livelihood on
daily basis in the informal sector like porters, coolies, rickshaw pullers in both
rural and urban areas.
1113/10/2015

Households headed by widows or
terminally ill persons/disabled
persons/persons aged 60 years ormore with no societal support
All primitive tribal households.
Eligible BPL, families of HIV positive
persons in the AAY list of on priority.
1123/10/2015

Karnataka
1. Green cards and yellow are
cards issued to BPL families who
are living in rural areas and urban slums
2. Antyodaya Anna Yojana (AAY) cards are
issued to the poorest of the poor families
who are living in rural area and urban slums.
3. Saffron cards are issued to APL families
living in rural areas and photo cards are
issued to APL families living in urban areas.
1153/10/2015

Contd...
3. For BPL card holders, government provide
1 kg sugar per member
35 kg Rice
5 litres kerosene OIL per member
10 litres kerosene oil for 2 to 3 members
15 litres kerosene oil for more than 3 members
3 litres kerosene oil for a single gas connection holder
1163/10/2015

OTHER BENEFITS TO BPL CARD
HOLDERS ..........1. The Citizen can with draw 1000/- rupees
credit for a year, where he has to pay the MONEY back to the government with the minimum interest rate. If there are late payments made, all the benefits will be withdrawn and you cannot further use the card.
2. BPL card holders can utilize the following schemes:> Housing> Employment> Small Value Individual Scheme
1173/10/2015

1183/10/2015

CONCLUSION
Although many societies worldwide have
made great strides toward more equality
between The “haves” and the “have-nots
in terms of the standard of living and life
chances.
Still there are large gaps between the
wealthiest and the poorest within a nation
and between the wealthiest and poorest
nations of the world.
3/10/2015 119

Contd....
A January 2014 Oxfam report indicates
that the 85 wealthiest individuals in the
world have a combined wealth equal
to that of the bottom 50% of the
world's population, or about 3.5 billion
people.
1203/10/2015

Scarce and unequally distributed
resources are the main stratifying factors
and are responsible for huge sufferings for
those “have nots”
Poverty is not an accident like slavery and
apartheid ; it is man-made and can only
be removed by the actions of human
beings.
3/10/2015 121

“
1223/10/2015

1233/10/2015
REFERENCES
1. WHO.Poverty.http://www.who.int/topics/poverty/en/
2. Park k. Preventive and social medicine. 22nd edition.
2013.3. Community Medicine with Recent Advances by
Suryakantha, A.H. 3rd edition.2014.4. Lal S. Textbook of community Medicine. 3nd
edition(Revised) ; 2014.
5. B.G. PRASAD’S SOCIO-ECONOMIC STATUSSCALE – REVISION FOR 2014. The Scientific
Journal for Theory and Practice of Socio-economicDevelopment 2014, 3(6): 351-354 .
6. KUPPUSWAMY’S SOCIO-ECONOMIC STATUS
SCALE – A REVISION OF ECONOMIC PARAMETERFOR 2012.
3/10/2015 124

7. Bruna G. Indicators of socioeconomic position. J Epidemiol
Community Health 2006;60:7–12
8. Agarwal AK. Social classification: The Need to Update in
the present Scenario. IJCM; Jan –Mar; vol 33: Number 1.
9. NFHS- 3 Key findings. Ministry of Health and Familywelfare. GOI; 2005-06. Grusky, David B. (2011). "Theories
of Stratification and Inequality". In Ritzer, George and J.
Michael Ryan (eds.). The Concise Encyclopedia ofSociology. Wiley-Blackwell. pp. 622–624.
10. http://www.yourarticlelibrary.com/society/short-essay-on-indian-social-stratification-system-376-words/4092/.
11. http://study.com/academy/lesson/global-stratification-definition-differences-in-income-levels-and-poverty.html.
12. Wikipedia, the free encyclopedia. Socioeconomic status.
http:// en. wikipedia. org/wiki/ Socioeconomic _status.
1253/10/2015

13. O.P. Aggarwal, S.K. Bhasin, A.K. Sharma, P. Chhabra, K.Aggarwal, .P. Rajoura. A New Instrument (Scale) for
Measuring the Socioeconomic Status of a Family:Preliminary Study. Indian Journal of Community Medicine.Vol. 30, No. 4 (2005-10 - 2005-12).
14. Wikipedia, the free encyclopedia.Social stratification.http://en. wikipedia. org/wiki/Social_stratification.
15. Inequalities in Health in India: the methodological
construction of indices and measures. / Davey Smith, G;Gordon, D; Kelly, M; Nandy, S; Subramanian, SV. UK
Department for International Development, 2008.Research
output: Book/Report.16. NancyE.AdlerandKatherine Newman. Inequality in
education, income, and occupation exacerbates the gapsbetween the health “haves” and “have-nots.” ©2009 HOPE–
ThePeople-to-People Health Foundation, Inc.
1263/10/2015
17. Wikipedia, the free encyclopedia. List of countries by
distribution of wealth. http://en. wikipedia. org/ wiki
/List of countries by distribution of wealth.18. http://tec-sep.blogspot.in/2013/03/social-stratification.
html.19. Wikipedia, the free encyclopedia List of countries by
income equality. http://en. Wikipedia.org/wiki/ List of
countries by income equality.20. http://www.theguardian.com/business/2015/jan/19/glo
bal-wealth-oxfam-inequality-davos-economic-summit-switzerland
21. Giddens A. Sociology. 6th edition; 2011.22. Adler NE & Newman K. 2007. Socioeconomic Dispari
ties In Health: Pathways and Policies. Health Affairs,21(2):6076.
1273/10/2015

1283/10/2015