Embed Size (px)
DESCRIPTION
Citation preview
109© 2013 David G. Wild. Published by Elsevier Ltd. All rights reserved.http://dx.doi.org/10.1016/B978-0-08-097037-0.00008-7
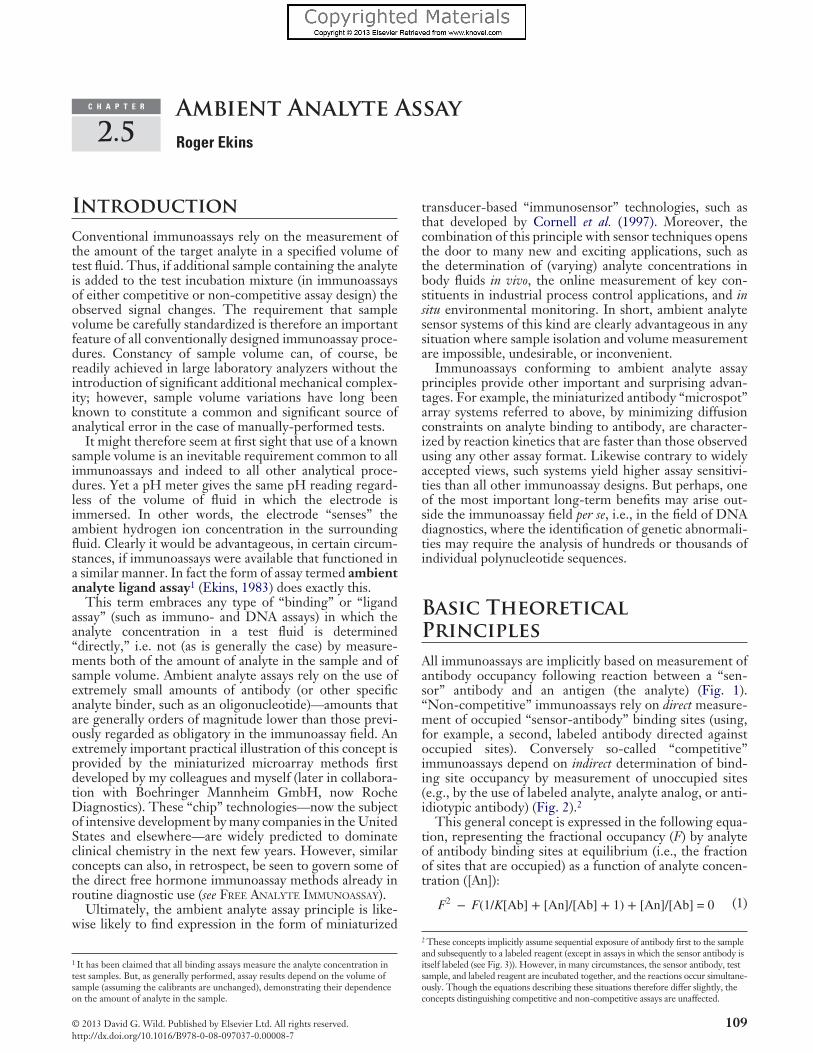
IntroductionConventional immunoassays rely on the measurement of the amount of the target analyte in a specified volume of test fluid. Thus, if additional sample containing the analyte is added to the test incubation mixture (in immunoassays of either competitive or non-competitive assay design) the observed signal changes. The requirement that sample volume be carefully standardized is therefore an important feature of all conventionally designed immunoassay proce-dures. Constancy of sample volume can, of course, be readily achieved in large laboratory analyzers without the introduction of significant additional mechanical complex-ity; however, sample volume variations have long been known to constitute a common and significant source of analytical error in the case of manually-performed tests.
It might therefore seem at first sight that use of a known sample volume is an inevitable requirement common to all immunoassays and indeed to all other analytical proce-dures. Yet a pH meter gives the same pH reading regard-less of the volume of fluid in which the electrode is immersed. In other words, the electrode “senses” the ambient hydrogen ion concentration in the surrounding fluid. Clearly it would be advantageous, in certain circum-stances, if immunoassays were available that functioned in a similar manner. In fact the form of assay termed ambient analyte ligand assay1 (Ekins, 1983) does exactly this.
This term embraces any type of “binding” or “ligand assay” (such as immuno- and DNA assays) in which the analyte concentration in a test fluid is determined “directly,” i.e. not (as is generally the case) by measure-ments both of the amount of analyte in the sample and of sample volume. Ambient analyte assays rely on the use of extremely small amounts of antibody (or other specific analyte binder, such as an oligonucleotide)—amounts that are generally orders of magnitude lower than those previ-ously regarded as obligatory in the immunoassay field. An extremely important practical illustration of this concept is provided by the miniaturized microarray methods first developed by my colleagues and myself (later in collabora-tion with Boehringer Mannheim GmbH, now Roche Diagnostics). These “chip” technologies—now the subject of intensive development by many companies in the United States and elsewhere—are widely predicted to dominate clinical chemistry in the next few years. However, similar concepts can also, in retrospect, be seen to govern some of the direct free hormone immunoassay methods already in routine diagnostic use (see FREE ANALYTE IMMUNOASSAY).
Ultimately, the ambient analyte assay principle is like-wise likely to find expression in the form of miniaturized
1 It has been claimed that all binding assays measure the analyte concentration in test samples. But, as generally performed, assay results depend on the volume of sample (assuming the calibrants are unchanged), demonstrating their dependence on the amount of analyte in the sample.
transducer-based “immunosensor” technologies, such as that developed by Cornell et al. (1997). Moreover, the combination of this principle with sensor techniques opens the door to many new and exciting applications, such as the determination of (varying) analyte concentrations in body fluids in vivo, the online measurement of key con-stituents in industrial process control applications, and in situ environmental monitoring. In short, ambient analyte sensor systems of this kind are clearly advantageous in any situation where sample isolation and volume measurement are impossible, undesirable, or inconvenient.
Immunoassays conforming to ambient analyte assay principles provide other important and surprising advan-tages. For example, the miniaturized antibody “microspot” array systems referred to above, by minimizing diffusion constraints on analyte binding to antibody, are character-ized by reaction kinetics that are faster than those observed using any other assay format. Likewise contrary to widely accepted views, such systems yield higher assay sensitivi-ties than all other immunoassay designs. But perhaps, one of the most important long-term benefits may arise out-side the immunoassay field per se, i.e., in the field of DNA diagnostics, where the identification of genetic abnormali-ties may require the analysis of hundreds or thousands of individual polynucleotide sequences.
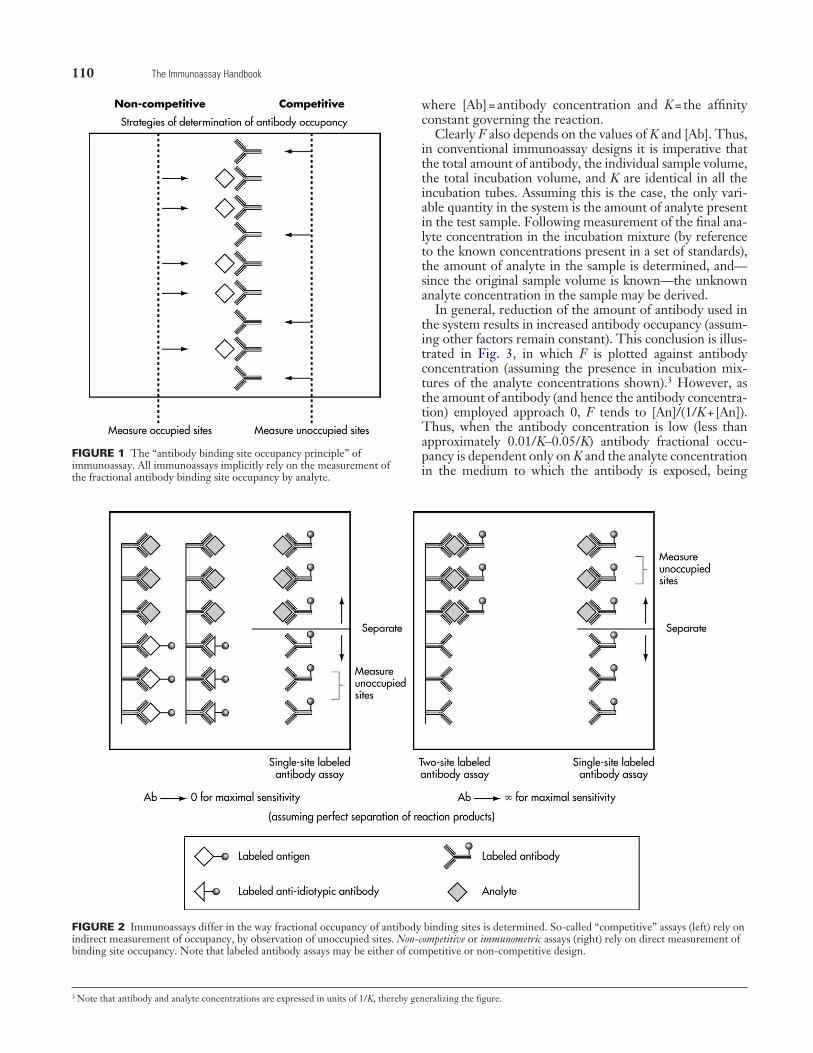
Basic Theoretical PrinciplesAll immunoassays are implicitly based on measurement of antibody occupancy following reaction between a “sen-sor” antibody and an antigen (the analyte) (Fig. 1). “ Non-competitive” immunoassays rely on direct measure-ment of occupied “sensor-antibody” binding sites (using, for example, a second, labeled antibody directed against occupied sites). Conversely so-called “competitive” immunoassays depend on indirect determination of bind-ing site occupancy by measurement of unoccupied sites (e.g., by the use of labeled analyte, analyte analog, or anti-idiotypic antibody) (Fig. 2).2
This general concept is expressed in the following equa-tion, representing the fractional occupancy (F) by analyte of antibody binding sites at equilibrium (i.e., the fraction of sites that are occupied) as a function of analyte concen-tration ([An]):
(1)
2 These concepts implicitly assume sequential exposure of antibody first to the sample and subsequently to a labeled reagent (except in assays in which the sensor antibody is itself labeled (see Fig. 3)). However, in many circumstances, the sensor antibody, test sample, and labeled reagent are incubated together, and the reactions occur simultane-ously. Though the equations describing these situations therefore differ slightly, the concepts distinguishing competitive and non-competitive assays are unaffected.
Ambient Analyte AssayRoger Ekins
C H A P T E R
2.5
110 The Immunoassay Handbook
where [Ab] = antibody concentration and K = the affinity constant governing the reaction.
Clearly F also depends on the values of K and [Ab]. Thus, in conventional immunoassay designs it is imperative that the total amount of antibody, the individual sample volume, the total incubation volume, and K are identical in all the incubation tubes. Assuming this is the case, the only vari-able quantity in the system is the amount of analyte present in the test sample. Following measurement of the final ana-lyte concentration in the incubation mixture (by reference to the known concentrations present in a set of standards), the amount of analyte in the sample is determined, and—since the original sample volume is known—the unknown analyte concentration in the sample may be derived.
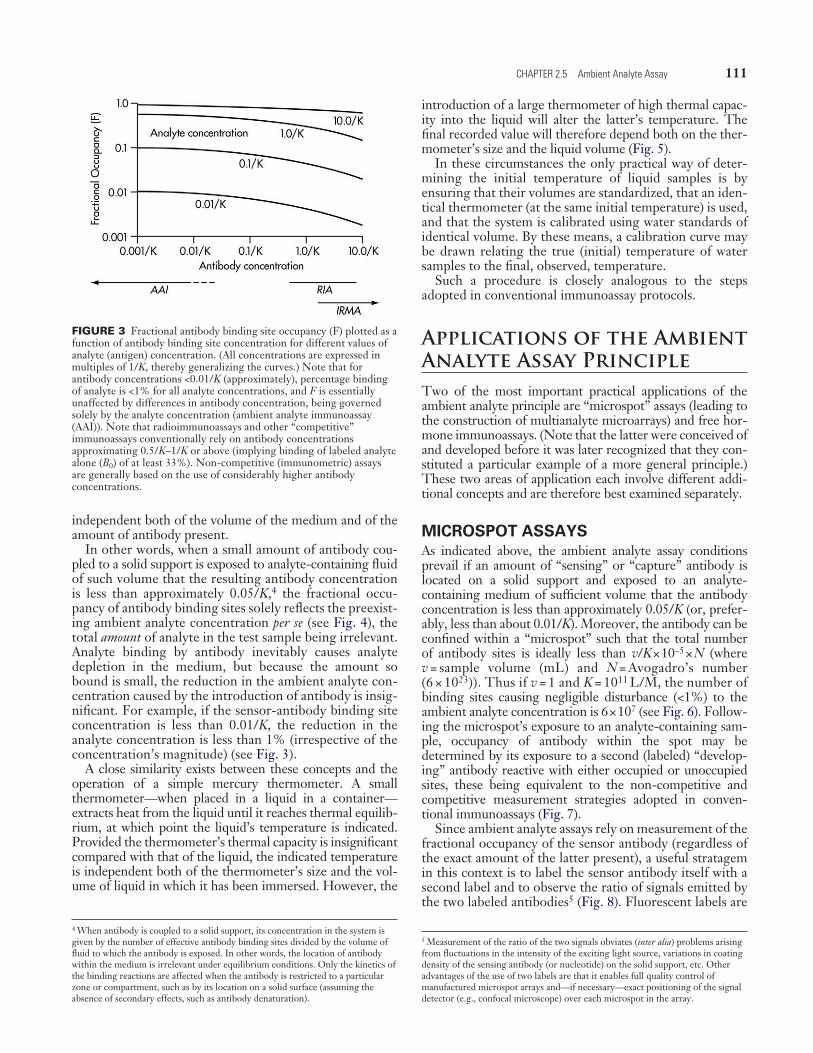
In general, reduction of the amount of antibody used in the system results in increased antibody occupancy (assum-ing other factors remain constant). This conclusion is illus-trated in Fig. 3, in which F is plotted against antibody concentration (assuming the presence in incubation mix-tures of the analyte concentrations shown).3 However, as the amount of antibody (and hence the antibody concentra-tion) employed approach 0, F tends to [An]/(1/K + [An]). Thus, when the antibody concentration is low (less than approximately 0.01/K–0.05/K) antibody fractional occu-pancy is dependent only on K and the analyte concentration in the medium to which the antibody is exposed, being
3 Note that antibody and analyte concentrations are expressed in units of 1/K, thereby generalizing the figure.
FIGURE 1 The “antibody binding site occupancy principle” of immunoassay. All immunoassays implicitly rely on the measurement of the fractional antibody binding site occupancy by analyte.
FIGURE 2 Immunoassays differ in the way fractional occupancy of antibody binding sites is determined. So-called “competitive” assays (left) rely on indirect measurement of occupancy, by observation of unoccupied sites. Non-competitive or immunometric assays (right) rely on direct measurement of binding site occupancy. Note that labeled antibody assays may be either of competitive or non-competitive design.
111CHAPTER 2.5 Ambient Analyte Assay
independent both of the volume of the medium and of the amount of antibody present.
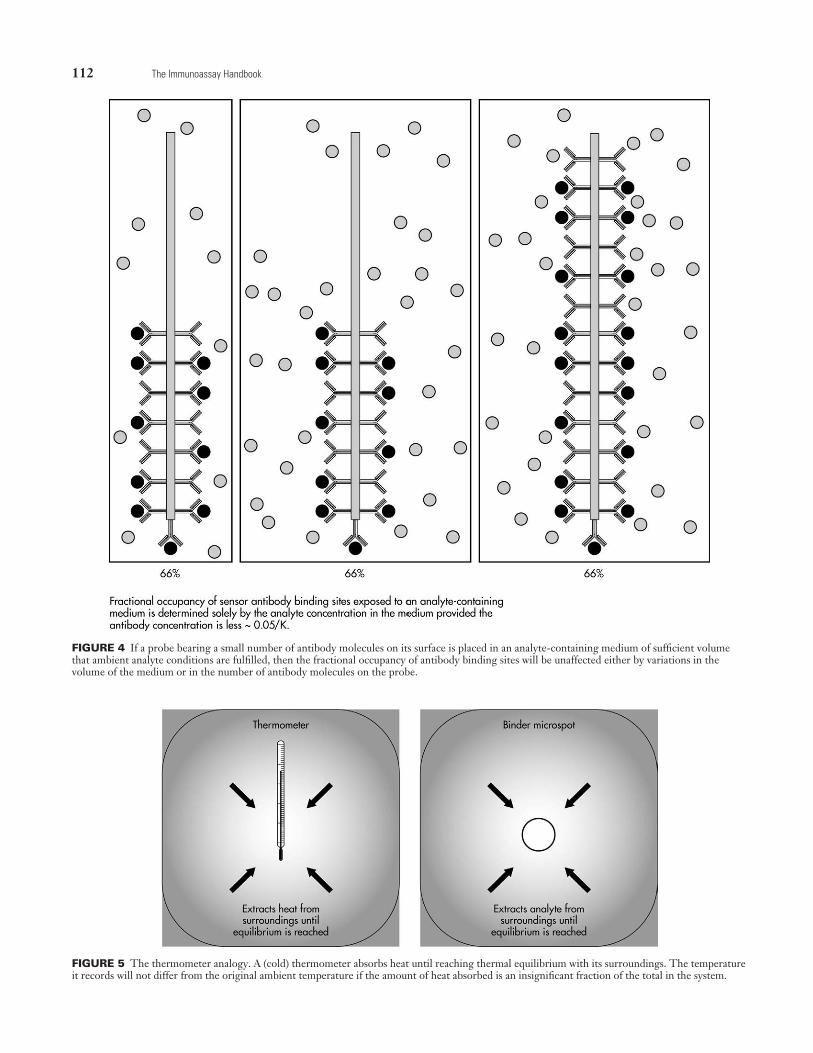
In other words, when a small amount of antibody cou-pled to a solid support is exposed to analyte-containing fluid of such volume that the resulting antibody concentration is less than approximately 0.05/K,4 the fractional occu-pancy of antibody binding sites solely reflects the preexist-ing ambient analyte concentration per se (see Fig. 4), the total amount of analyte in the test sample being irrelevant. Analyte binding by antibody inevitably causes analyte depletion in the medium, but because the amount so bound is small, the reduction in the ambient analyte con-centration caused by the introduction of antibody is insig-nificant. For example, if the sensor-antibody binding site concentration is less than 0.01/K, the reduction in the analyte concentration is less than 1% (irrespective of the concentration’s magnitude) (see Fig. 3).
A close similarity exists between these concepts and the operation of a simple mercury thermometer. A small thermometer—when placed in a liquid in a container—extracts heat from the liquid until it reaches thermal equilib-rium, at which point the liquid’s temperature is indicated. Provided the thermometer’s thermal capacity is insignificant compared with that of the liquid, the indicated temperature is independent both of the thermometer’s size and the vol-ume of liquid in which it has been immersed. However, the
4 When antibody is coupled to a solid support, its concentration in the system is given by the number of effective antibody binding sites divided by the volume of fluid to which the antibody is exposed. In other words, the location of antibody within the medium is irrelevant under equilibrium conditions. Only the kinetics of the binding reactions are affected when the antibody is restricted to a particular zone or compartment, such as by its location on a solid surface (assuming the absence of secondary effects, such as antibody denaturation).
introduction of a large thermometer of high thermal capac-ity into the liquid will alter the latter’s temperature. The final recorded value will therefore depend both on the ther-mometer’s size and the liquid volume (Fig. 5).
In these circumstances the only practical way of deter-mining the initial temperature of liquid samples is by ensuring that their volumes are standardized, that an iden-tical thermometer (at the same initial temperature) is used, and that the system is calibrated using water standards of identical volume. By these means, a calibration curve may be drawn relating the true (initial) temperature of water samples to the final, observed, temperature.
Such a procedure is closely analogous to the steps adopted in conventional immunoassay protocols.
Applications of the Ambient Analyte Assay PrincipleTwo of the most important practical applications of the ambient analyte principle are “microspot” assays (leading to the construction of multianalyte microarrays) and free hor-mone immunoassays. (Note that the latter were conceived of and developed before it was later recognized that they con-stituted a particular example of a more general principle.) These two areas of application each involve different addi-tional concepts and are therefore best examined separately.
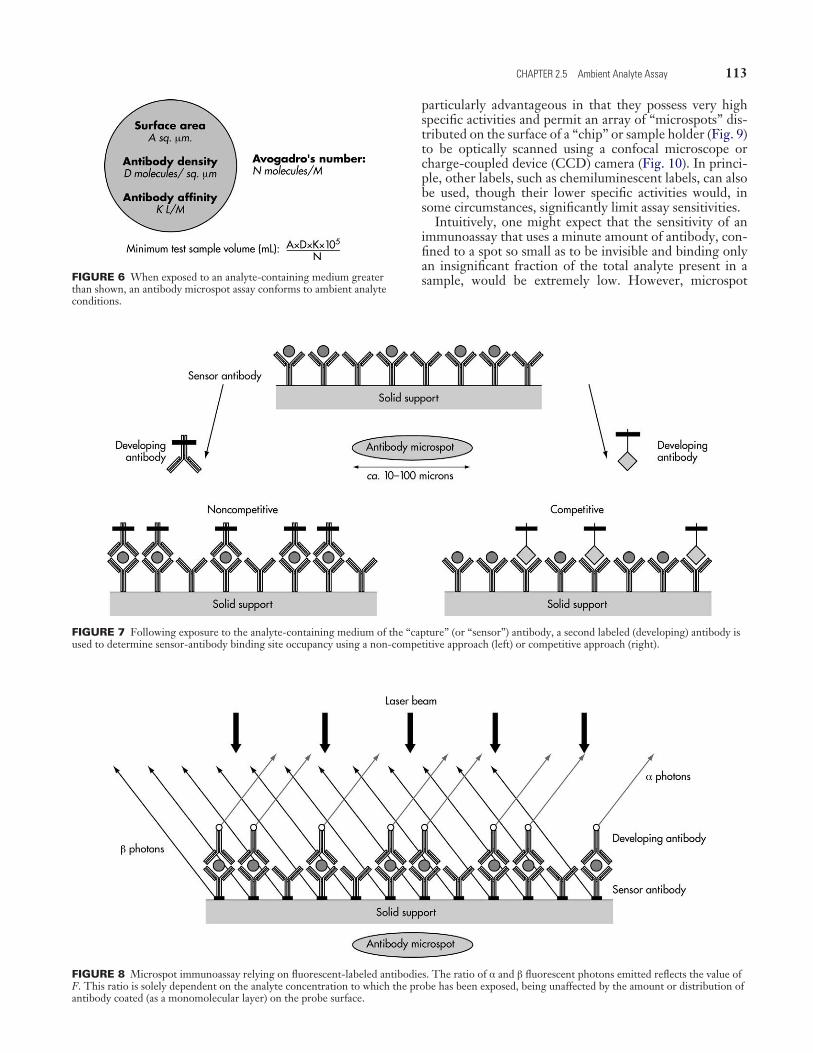
MICROSPOT ASSAYSAs indicated above, the ambient analyte assay conditions prevail if an amount of “sensing” or “capture” antibody is located on a solid support and exposed to an analyte- containing medium of sufficient volume that the antibody concentration is less than approximately 0.05/K (or, prefer-ably, less than about 0.01/K). Moreover, the antibody can be confined within a “microspot” such that the total number of antibody sites is ideally less than v/K × 10−5 × N (where v = sample volume (mL) and N = Avogadro’s number (6 × 10²³)). Thus if v = 1 and K = 1011 L/M, the number of binding sites causing negligible disturbance (<1%) to the ambient analyte concentration is 6 × 10⁷ (see Fig. 6). Follow-ing the microspot’s exposure to an analyte-containing sam-ple, occupancy of antibody within the spot may be determined by its exposure to a second (labeled) “develop-ing” antibody reactive with either occupied or unoccupied sites, these being equivalent to the non-competitive and competitive measurement strategies adopted in conven-tional immunoassays (Fig. 7).
Since ambient analyte assays rely on measurement of the fractional occupancy of the sensor antibody (regardless of the exact amount of the latter present), a useful stratagem in this context is to label the sensor antibody itself with a second label and to observe the ratio of signals emitted by the two labeled antibodies5 (Fig. 8). Fluorescent labels are
5 Measurement of the ratio of the two signals obviates (inter alia) problems arising from fluctuations in the intensity of the exciting light source, variations in coating density of the sensing antibody (or nucleotide) on the solid support, etc. Other advantages of the use of two labels are that it enables full quality control of manufactured microspot arrays and—if necessary—exact positioning of the signal detector (e.g., confocal microscope) over each microspot in the array.
FIGURE 3 Fractional antibody binding site occupancy (F) plotted as a function of antibody binding site concentration for different values of analyte (antigen) concentration. (All concentrations are expressed in multiples of 1/K, thereby generalizing the curves.) Note that for antibody concentrations <0.01/K (approximately), percentage binding of analyte is <1% for all analyte concentrations, and F is essentially unaffected by differences in antibody concentration, being governed solely by the analyte concentration (ambient analyte immunoassay (AAI)). Note that radioimmunoassays and other “competitive” immunoassays conventionally rely on antibody concentrations approximating 0.5/K–1/K or above (implying binding of labeled analyte alone (B0) of at least 33%). Non-competitive (immunometric) assays are generally based on the use of considerably higher antibody concentrations.
112 The Immunoassay Handbook
FIGURE 4 If a probe bearing a small number of antibody molecules on its surface is placed in an analyte-containing medium of sufficient volume that ambient analyte conditions are fulfilled, then the fractional occupancy of antibody binding sites will be unaffected either by variations in the volume of the medium or in the number of antibody molecules on the probe.
FIGURE 5 The thermometer analogy. A (cold) thermometer absorbs heat until reaching thermal equilibrium with its surroundings. The temperature it records will not differ from the original ambient temperature if the amount of heat absorbed is an insignificant fraction of the total in the system.
113CHAPTER 2.5 Ambient Analyte Assay
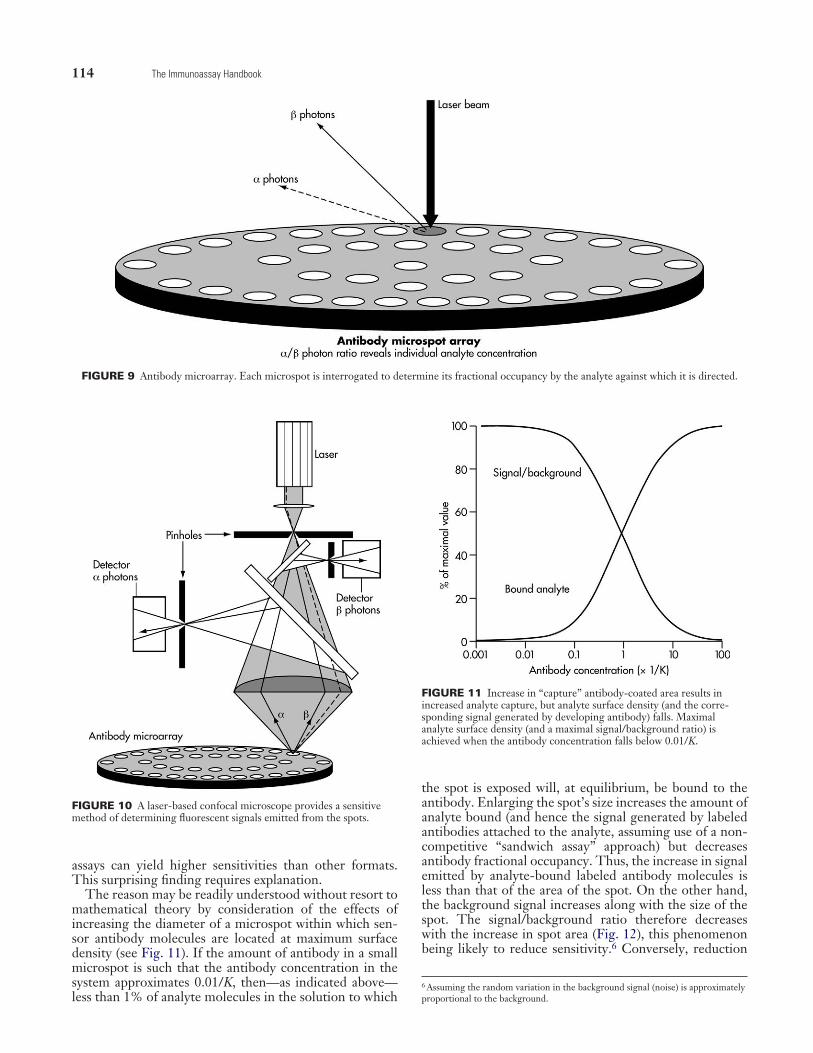
particularly advantageous in that they possess very high specific activities and permit an array of “microspots” dis-tributed on the surface of a “chip” or sample holder (Fig. 9) to be optically scanned using a confocal microscope or charge-coupled device (CCD) camera (Fig. 10). In princi-ple, other labels, such as chemiluminescent labels, can also be used, though their lower specific activities would, in some circumstances, significantly limit assay sensitivities.
Intuitively, one might expect that the sensitivity of an immunoassay that uses a minute amount of antibody, con-fined to a spot so small as to be invisible and binding only an insignificant fraction of the total analyte present in a sample, would be extremely low. However, microspot FIGURE 6 When exposed to an analyte-containing medium greater
than shown, an antibody microspot assay conforms to ambient analyte conditions.
FIGURE 7 Following exposure to the analyte-containing medium of the “capture” (or “sensor”) antibody, a second labeled (developing) antibody is used to determine sensor-antibody binding site occupancy using a non-competitive approach (left) or competitive approach (right).
FIGURE 8 Microspot immunoassay relying on fluorescent-labeled antibodies. The ratio of α and β fluorescent photons emitted reflects the value of F. This ratio is solely dependent on the analyte concentration to which the probe has been exposed, being unaffected by the amount or distribution of antibody coated (as a monomolecular layer) on the probe surface.
114 The Immunoassay Handbook
assays can yield higher sensitivities than other formats. This surprising finding requires explanation.
The reason may be readily understood without resort to mathematical theory by consideration of the effects of increasing the diameter of a microspot within which sen-sor antibody molecules are located at maximum surface den sity (see Fig. 11). If the amount of antibody in a small microspot is such that the antibody concentration in the system approximates 0.01/K, then—as indicated above—less than 1% of analyte molecules in the solution to which
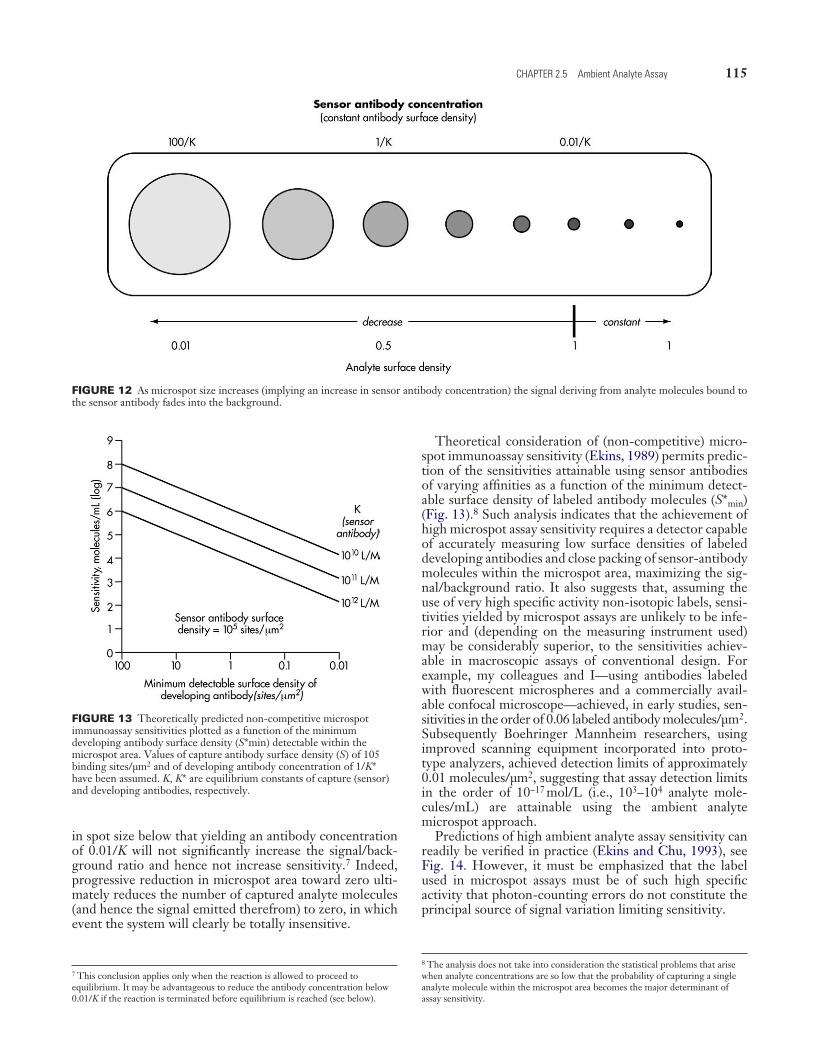
the spot is exposed will, at equilibrium, be bound to the antibody. Enlarging the spot’s size increases the amount of analyte bound (and hence the signal generated by labeled antibodies attached to the analyte, assuming use of a non- competitive “sandwich assay” approach) but decreases antibody fractional occupancy. Thus, the increase in signal emitted by analyte-bound labeled antibody molecules is less than that of the area of the spot. On the other hand, the background signal increases along with the size of the spot. The signal/background ratio therefore decreases with the increase in spot area (Fig. 12), this phenomenon being likely to reduce sensitivity.6 Conversely, reduction
6 Assuming the random variation in the background signal (noise) is approximately proportional to the background.
FIGURE 9 Antibody microarray. Each microspot is interrogated to determine its fractional occupancy by the analyte against which it is directed.
FIGURE 10 A laser-based confocal microscope provides a sensitive method of determining fluorescent signals emitted from the spots.
FIGURE 11 Increase in “capture” antibody-coated area results in increased analyte capture, but analyte surface density (and the corre-sponding signal generated by developing antibody) falls. Maximal analyte surface density (and a maximal signal/background ratio) is achieved when the antibody concentration falls below 0.01/K.
115CHAPTER 2.5 Ambient Analyte Assay
in spot size below that yielding an antibody concentration of 0.01/K will not significantly increase the signal/back-ground ratio and hence not increase sensitivity.7 Indeed, progressive reduction in microspot area toward zero ulti-mately reduces the number of captured analyte molecules (and hence the signal emitted therefrom) to zero, in which event the system will clearly be totally insensitive.
7 This conclusion applies only when the reaction is allowed to proceed to equilibrium. It may be advantageous to reduce the antibody concentration below 0.01/K if the reaction is terminated before equilibrium is reached (see below).
Theoretical consideration of (non-competitive) micro-spot immunoassay sensitivity (Ekins, 1989) permits predic-tion of the sensitivities attainable using sensor antibodies of varying affinities as a function of the minimum detect-able surface density of labeled antibody molecules (S*min) (Fig. 13).8 Such analysis indicates that the achievement of high microspot assay sensitivity requires a detector capable of accurately measuring low surface densities of labeled developing antibodies and close packing of sensor-antibody molecules within the microspot area, maximizing the sig-nal/background ratio. It also suggests that, assuming the use of very high specific activity non-isotopic labels, sensi-tivities yielded by microspot assays are unlikely to be infe-rior and (depending on the measuring instrument used) may be considerably superior, to the sensitivities achiev-able in macroscopic assays of conventional design. For example, my colleagues and I—using antibodies labeled with fluorescent microspheres and a commercially avail-able confocal microscope—achieved, in early studies, sen-sitivities in the order of 0.06 labeled antibody molecules/µm2. Subsequently Boehringer Mannheim researchers, using improved scanning equipment incorporated into proto-type analyzers, achieved detection limits of approximately 0.01 molecules/µm2, suggesting that assay detection limits in the order of 10−17 mol/L (i.e., 103–104 analyte mole-cules/mL) are attainable using the ambient analyte microspot approach.
Predictions of high ambient analyte assay sensitivity can readily be verified in practice (Ekins and Chu, 1993), see Fig. 14. However, it must be emphasized that the label used in microspot assays must be of such high specific activity that photon-counting errors do not constitute the principal source of signal variation limiting sensitivity.
8 The analysis does not take into consideration the statistical problems that arise when analyte concentrations are so low that the probability of capturing a single analyte molecule within the microspot area becomes the major determinant of assay sensitivity.
FIGURE 12 As microspot size increases (implying an increase in sensor antibody concentration) the signal deriving from analyte molecules bound to the sensor antibody fades into the background.
FIGURE 13 Theoretically predicted non-competitive microspot immunoassay sensitivities plotted as a function of the minimum developing antibody surface density (S*min) detectable within the microspot area. Values of capture antibody surface density (S) of 105 binding sites/µm2 and of developing antibody concentration of 1/K* have been assumed. K, K* are equilibrium constants of capture (sensor) and developing antibodies, respectively.
116 The Immunoassay Handbook
These conclusions assume the establishment of thermo-dynamic equilibrium in the system; however, the velocities of binding reactions are reduced with a reduction of con-centrations of one or both of the reactants and the time to reach equilibrium increases. Moreover, it is well known that diffusion constraints on binding reactions reduce reaction velocities when capture antibody molecules are linked to a solid support. Thus, the suggestion that microspot assays are likely to be more rapid than conven-tional assays may likewise be counter intuitive. However, this prediction can again be readily understood by consid-eration of a series of antibody microspots of increasing diameter, each containing sensor antibody molecules at the same surface density. As indicated above, antibody fractional occupancy at equilibrium—and hence analyte surface density—is highest when the microspot area is
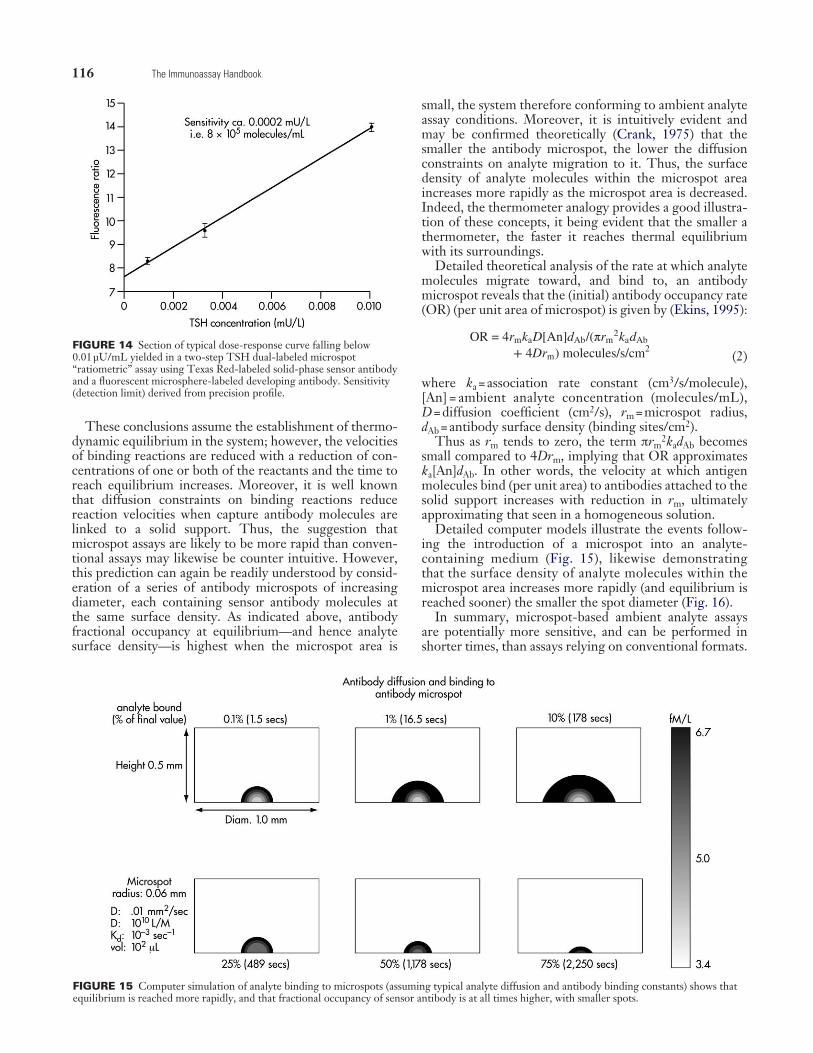
small, the system therefore conforming to ambient analyte assay conditions. Moreover, it is intuitively evident and may be confirmed theoretically (Crank, 1975) that the smaller the antibody microspot, the lower the diffusion constraints on analyte migration to it. Thus, the surface density of analyte molecules within the microspot area increases more rapidly as the microspot area is decreased. Indeed, the thermometer analogy provides a good illustra-tion of these concepts, it being evident that the smaller a thermometer, the faster it reaches thermal equilibrium with its surroundings.
Detailed theoretical analysis of the rate at which analyte molecules migrate toward, and bind to, an antibody microspot reveals that the (initial) antibody occupancy rate (OR) (per unit area of microspot) is given by (Ekins, 1995):
(2)
where ka = association rate constant (cm3/s/molecule), [An] = ambient analyte concentration (molecules/mL), D = diffusion coefficient (cm2/s), rm = microspot radius, dAb = antibody surface density (binding sites/cm2).
Thus as rm tends to zero, the term πrm2kadAb becomes
small compared to 4Drm, implying that OR approximates ka[An]dAb. In other words, the velocity at which antigen molecules bind (per unit area) to antibodies attached to the solid support increases with reduction in rm, ultimately approximating that seen in a homogeneous solution.
Detailed computer models illustrate the events follow-ing the introduction of a microspot into an analyte- containing medium (Fig. 15), likewise demonstrating that the surface density of analyte molecules within the microspot area increases more rapidly (and equilibrium is reached sooner) the smaller the spot diameter (Fig. 16).
In summary, microspot-based ambient analyte assays are potentially more sensitive, and can be performed in shorter times, than assays relying on conventional formats.
FIGURE 15 Computer simulation of analyte binding to microspots (assuming typical analyte diffusion and antibody binding constants) shows that equilibrium is reached more rapidly, and that fractional occupancy of sensor antibody is at all times higher, with smaller spots.
FIGURE 14 Section of typical dose-response curve falling below 0.01 µU/mL yielded in a two-step TSH dual-labeled microspot “ratiometric” assay using Texas Red-labeled solid-phase sensor antibody and a fluorescent microsphere-labeled developing antibody. Sensitivity (detection limit) derived from precision profile.
117CHAPTER 2.5 Ambient Analyte Assay
Practical realization of these potentially important advan-tages nevertheless requires good instrumentation and attention to key determinants of assay sensitivity, such as non-specific binding of labeled reagents to solid supports, minimization of background signals from the supports themselves, etc. Likewise industrial implementation of these ideas, and the development of reliable multianalyte microspot assays, presents considerably greater problems than that of conventional single analyte assay kits. Among these are the development of methods for manufacturing microarrays, for rapid and sensitive scanning of the arrays and for fully automated analyzers incorporating the micro-fluidic and other sample processing systems required to ensure reliability of assay results.
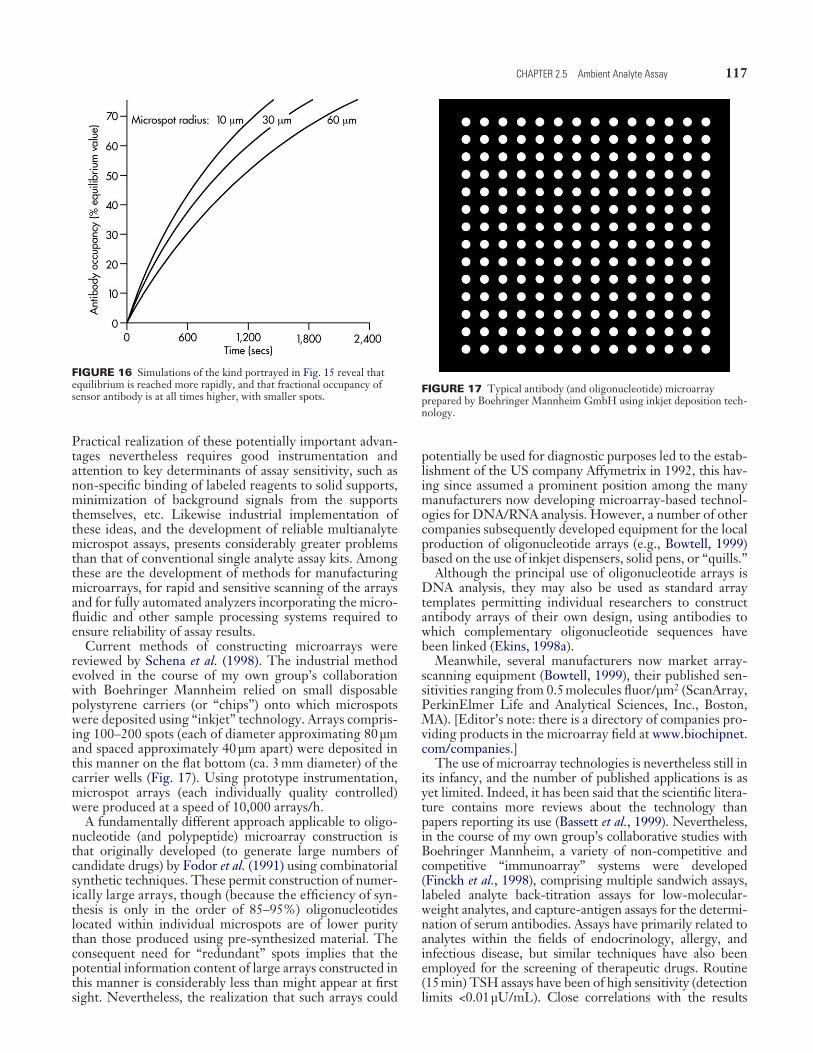
Current methods of constructing microarrays were reviewed by Schena et al. (1998). The industrial method evolved in the course of my own group’s collaboration with Boehringer Mannheim relied on small disposable polystyrene carriers (or “chips”) onto which microspots were deposited using “inkjet” technology. Arrays compris-ing 100–200 spots (each of diameter approximating 80 µm and spaced approximately 40 µm apart) were deposited in this manner on the flat bottom (ca. 3 mm diameter) of the carrier wells (Fig. 17). Using prototype instrumentation, microspot arrays (each individually quality controlled) were produced at a speed of 10,000 arrays/h.
A fundamentally different approach applicable to oligo-nucleotide (and polypeptide) microarray construction is that originally developed (to generate large numbers of candidate drugs) by Fodor et al. (1991) using combinatorial synthetic techniques. These permit construction of numer-ically large arrays, though (because the efficiency of syn-thesis is only in the order of 85–95%) oligonucleotides located within individual microspots are of lower purity than those produced using pre-synthesized material. The consequent need for “redundant” spots implies that the potential information content of large arrays constructed in this manner is considerably less than might appear at first sight. Nevertheless, the realization that such arrays could
potentially be used for diagnostic purposes led to the estab-lishment of the US company Affymetrix in 1992, this hav-ing since assumed a prominent position among the many manufacturers now developing microarray-based technol-ogies for DNA/RNA analysis. However, a number of other companies subsequently developed equipment for the local production of oligonucleotide arrays (e.g., Bowtell, 1999) based on the use of inkjet dispensers, solid pens, or “quills.”
Although the principal use of oligonucleotide arrays is DNA analysis, they may also be used as standard array templates permitting individual researchers to construct antibody arrays of their own design, using antibodies to which complementary oligonucleotide sequences have been linked (Ekins, 1998a).
Meanwhile, several manufacturers now market array-scanning equipment (Bowtell, 1999), their published sen-sitivities ranging from 0.5 molecules fluor/µm2 (ScanArray, PerkinElmer Life and Analytical Sciences, Inc., Boston, MA). [Editor’s note: there is a directory of companies pro-viding products in the microarray field at www.biochipnet.com/companies.]
The use of microarray technologies is nevertheless still in its infancy, and the number of published applications is as yet limited. Indeed, it has been said that the scientific litera-ture contains more reviews about the technology than papers reporting its use (Bassett et al., 1999). Nevertheless, in the course of my own group’s collaborative studies with Boehringer Mannheim, a variety of non-competitive and competitive “immunoarray” systems were developed (Finckh et al., 1998), comprising multiple sandwich assays, labeled analyte back-titration assays for low-molecular-weight analytes, and capture-antigen assays for the determi-nation of serum antibodies. Assays have primarily related to analytes within the fields of endocrinology, allergy, and infectious disease, but similar techniques have also been employed for the screening of therapeutic drugs. Routine (15 min) TSH assays have been of high sensitivity (detection limits <0.01 µU/mL). Close correlations with the results
FIGURE 16 Simulations of the kind portrayed in Fig. 15 reveal that equilibrium is reached more rapidly, and that fractional occupancy of sensor antibody is at all times higher, with smaller spots.
FIGURE 17 Typical antibody (and oligonucleotide) microarray prepared by Boehringer Mannheim GmbH using inkjet deposition tech-nology.
118 The Immunoassay Handbook
obtained with the latest commercially available test kits have been demonstrated for a variety of allergens (e.g., birch, cat epithelia, house dust mite, α-amylase, bee venom, and total IgE), assay precision, and sensitivity being superior. For total IgE, a detection limit of <0.01 IU/mL has been achieved. Microarray-based assays relating to a number of infectious diseases (e.g., HIV, HBsAg, anti-HBC, rubella) have likewise been developed and have been shown to be superior to the latest commercially available methods and instruments.
We also carried out a limited number of studies exem-plifying the technology’s application to DNA analysis (Finckh et al., 1998). For example Mycobacterium tubercu-losis, which is resistant to Rifampicin (an efficient first-line drug), was specifically selected for study because of the technical challenges it poses (e.g., single-point muta-tions, formation of strong intra-strand secondary struc-tures, extremely GC-rich segments) as well as its clinical relevance. Rifampicin inhibits the RNA polymerase by binding to its β-subunit (rpo-β); however, various sin-gle-base transitions clustered in a 27-codon segment of the bacterium gene cause resistance. A study on 80 selected samples from two clinical centers specializing in tuberculosis diagnosis showed a high degree of concor-dance with a reference (culture) method.
In summary, miniaturized microarray-based assays con-stitute a ubiquitous technology, applicable to a wide range of analytes. Their need for small samples, their greater sensitivity, speed and reliability,9 their reduced manufac-turing costs, and the potential savings to clinical laborato-ries arising from the simultaneous determination of many different analytes in a single sample are among the impor-tant advantages that would in any event be likely to lead to their replacement of existing methodologies. But the most compelling factor currently driving microarray develop-ment is the perception of the potential diagnostic impor-tance of the technology in the fields of genomics and—more recently—proteomics. Major pharmaceutical manufactur-ers are among the many that have realized the technology’s implications, anticipating the future development of drugs tailored to individual patients according to their genetic makeup. There is therefore little doubt that the ligand assay field is presently on the brink of a revolution that is likely to totally transform diagnostic medicine, drug devel-opment, and other related areas within the next few years.
FREE (NON-PROTEIN BOUND) HORMONE IMMUNOASSAYSThe direct measurement by immunoassay of the “free” (non-protein bound) concentrations of thyroid and steroid hormones has, in recent years, emerged as a standard diag-nostic procedure in many clinical laboratories, it being widely accepted that the free hormone concentration mea-sured under equilibrium conditions in vitro constitutes the determinant of the hormone’s physiological activity. This concept, termed the “free hormone hypothesis,” derives
9 Note that microarray formats enable microspots to be included that enable detec-tion in test samples of cross-reacting substances whose presence would be unnoticed in conventional assay formats.
primarily from observations that, in subjects in whom serum-binding protein concentrations are “abnormal,” overall hormonal effects correlate closely with the free hormone concentration. Nevertheless, doubts regarding the hypothesis’ validity remain. These have stemmed in part from the lack of explanation for the occurrence of spe-cific binding proteins in mammalian blood and the charac-teristic changes in their concentrations that accompany pregnancy in certain species (see, e.g., Seal and Doe, 1966). Such doubts have been reinforced by uncertainties regard-ing the underlying physicochemical basis of the hypothesis (Ekins et al., 1982; Ekins, 1985a), exemplified by conflict-ing views regarding the rate limitations on hormone efflux from the microcirculation held by thyroidologists (follow-ing Robbins and Rall, 1979) and by steroidologists (e.g., Tait and Burstein, 1964).10
Critics of the hypothesis have suggested that the bound hormone concentration determines hormone delivery to certain tissues, implying that serum-binding proteins ful-fill a specific tissue-targeting role. Changes in binding pro-tein concentrations are thus postulated as redistributing the hormone supply between target organs in the body, albeit the suggested mechanisms underlying this putative phenomenon differ. For example, Keller et al. (1969) visu-alize that certain organs are permeable to bound hormone. In contrast, Pardridge and his co-workers (see, e.g., Pardridge, 1987) suggest that “transient conformational changes about the ligand-binding site within the microcir-culation” cause changes in binding protein structure and hence in hormone-binding affinities, resulting in enhanced hormone dissociation within certain tissues. Meanwhile—relying on an analysis of the kinetics of bound hormone dissociation, intracapillary hormone diffusion, and capil-lary wall permeation—the present author has proposed that bound hormone concentrations influence the mater-nal hormone supply to the fetus in early pregnancy (Ekins, 1985b, 1990), the latter being postulated as of crucial importance to fetal brain development.
Notwithstanding continuing debate attaching to the physiological role (if any) of specific hormone-binding proteins, the determination of serum-free hormone ( particularly free T4) concentrations is of considerable diagnostic importance. Unfortunately, some of the immu-noassay methods developed by kit manufacturers were based on fallacious physicochemical concepts, such meth-ods yielding misleading results in certain clinical situations and creating major controversy regarding the basic princi-ples of free hormone measurement. However, only a brief summary of this topic (reviewed in greater detail elsewhere (Ekins, 1990, 1998b)) can be appropriately presented here.
10 Robbins’ and Rall’s (1979) view is that, as blood flows through target organ capillaries, the intracapillary free hormone concentration is maintained at its in
vitro equilibrium value in the face of hormone loss into tissue by instantaneous hormone dissociation from binding proteins. In contrast, Tait and Burstein (1964) postulated that only hormone initially in the free state is available for tissue uptake, implying a decline in the intracapillary free hormone level as blood transits the target organ, and free hormone molecules are lost into the extravascular compartment. This view is based on the supposition that release of hormone from bound hormone complexes is negligible during capillary transit, and implies, inter
alia, that the rate of blood flow through the target organ constitutes a major determinant of its hormone supply.
119CHAPTER 2.5 Ambient Analyte Assay
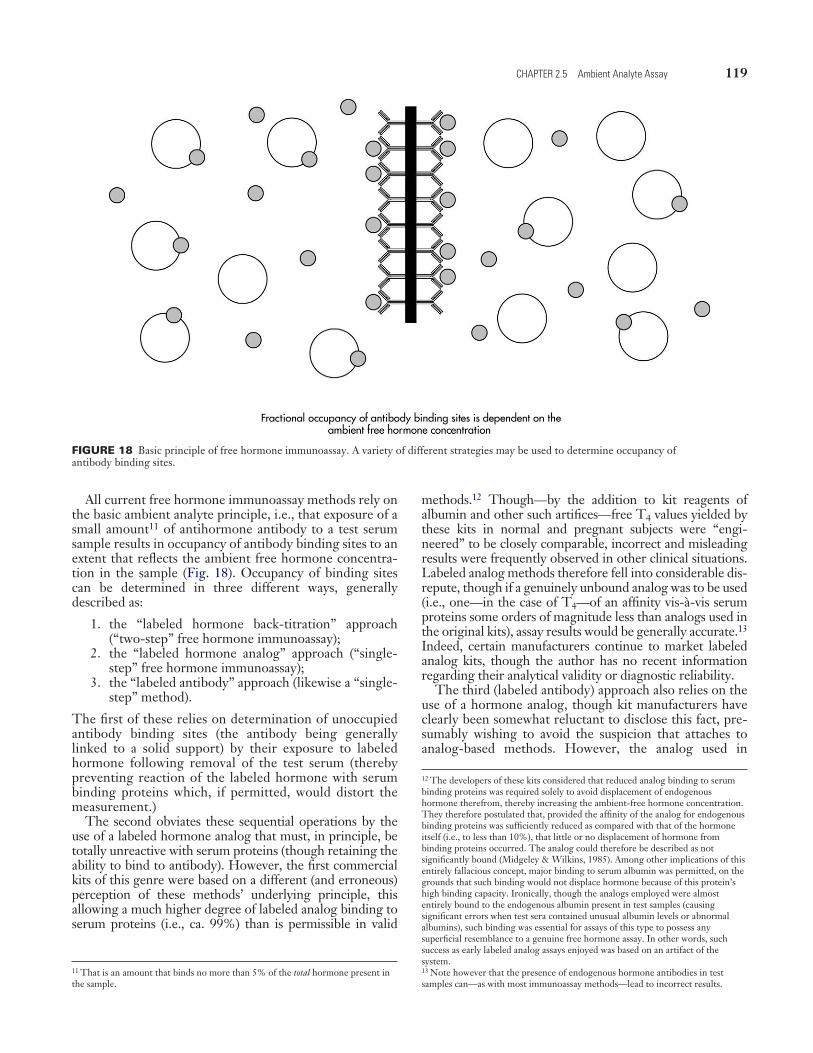
All current free hormone immunoassay methods rely on the basic ambient analyte principle, i.e., that exposure of a small amount11 of antihormone antibody to a test serum sample results in occupancy of antibody binding sites to an extent that reflects the ambient free hormone concentra-tion in the sample (Fig. 18). Occupancy of binding sites can be determined in three different ways, generally described as:
1. the “labeled hormone back-titration” approach (“two-step” free hormone immunoassay);
2. the “labeled hormone analog” approach (“single-step” free hormone immunoassay);
3. the “labeled antibody” approach (likewise a “single-step” method).
The first of these relies on determination of unoccupied antibody binding sites (the antibody being generally linked to a solid support) by their exposure to labeled hormone following removal of the test serum (thereby preventing reaction of the labeled hormone with serum binding proteins which, if permitted, would distort the measurement.)
The second obviates these sequential operations by the use of a labeled hormone analog that must, in principle, be totally unreactive with serum proteins (though retaining the ability to bind to antibody). However, the first commercial kits of this genre were based on a different (and erroneous) perception of these methods’ underlying principle, this allowing a much higher degree of labeled analog binding to serum proteins (i.e., ca. 99%) than is permissible in valid
11 That is an amount that binds no more than 5% of the total hormone present in the sample.
methods.12 Though—by the addition to kit reagents of albumin and other such artifices—free T4 values yielded by these kits in normal and pregnant subjects were “engi-neered” to be closely comparable, incorrect and misleading results were frequently observed in other clinical situations. Labeled analog methods therefore fell into considerable dis-repute, though if a genuinely unbound analog was to be used (i.e., one—in the case of T4—of an affinity vis-à-vis serum proteins some orders of magnitude less than analogs used in the original kits), assay results would be generally accurate.13 Indeed, certain manufacturers continue to market labeled analog kits, though the author has no recent information regarding their analytical validity or diagnostic reliability.
The third (labeled antibody) approach also relies on the use of a hormone analog, though kit manufacturers have clearly been somewhat reluctant to disclose this fact, pre-sumably wishing to avoid the suspicion that attaches to analog-based methods. However, the analog used in
12 The developers of these kits considered that reduced analog binding to serum binding proteins was required solely to avoid displacement of endogenous hormone therefrom, thereby increasing the ambient-free hormone concentration. They therefore postulated that, provided the affinity of the analog for endogenous binding proteins was sufficiently reduced as compared with that of the hormone itself (i.e., to less than 10%), that little or no displacement of hormone from binding proteins occurred. The analog could therefore be described as not significantly bound (Midgeley & Wilkins, 1985). Among other implications of this entirely fallacious concept, major binding to serum albumin was permitted, on the grounds that such binding would not displace hormone because of this protein’s high binding capacity. Ironically, though the analogs employed were almost entirely bound to the endogenous albumin present in test samples (causing significant errors when test sera contained unusual albumin levels or abnormal albumins), such binding was essential for assays of this type to possess any superficial resemblance to a genuine free hormone assay. In other words, such success as early labeled analog assays enjoyed was based on an artifact of the system.13 Note however that the presence of endogenous hormone antibodies in test samples can—as with most immunoassay methods—lead to incorrect results.
FIGURE 18 Basic principle of free hormone immunoassay. A variety of different strategies may be used to determine occupancy of antibody binding sites.
120 The Immunoassay Handbook
labeled antibody techniques is coupled to a solid support, such attachment creating a “macro analog” and evidently contributing to a further major reduction of analog bind-ing to serum proteins. For this and other reasons, labeled antibody-based kits appear to conform more closely to the principles governing valid analog-based free hormone immunoassays and generally yield correct and clinically reliable results.
Though all three methods rely on the basic ambient analyte assay principle, only the two-step method is fully independent of incubation volume, because of the pres-ence within single-step assay systems of another reagent (i.e., analog) whose reactions with antibody are concentra-tion and volume dependent. However, if the incubation vol-ume remains essentially unchanged, variations in the volume of sample added to the incubation mixture are largely irrelevant (provided that ambient analyte assay conditions are fulfilled), since differences in sample dilu-tion have no affect on the ambient free hormone concen-tration in these circumstances.
Free hormone assays differ from those in which the ana-lyte is totally unbound in so far as the reservoir of analyte maintaining near constancy of the ambient (free) analyte concentration in the face of antibody uptake comprises the rapidly-dissociating pool of protein-bound hormone pres-ent in the sample. Thus, the total amount of hormone finally bound to antibody may greatly exceed the amount initially present in the free state. For example, in the case of free thyroxine measurements, up to ca. 5% of the total hormone in the sample may be bound to antibody at the termination of the assay, albeit only ca. 0.2% of the hor-mone in the incubation mixture is free (assuming a final 10-fold dilution of the serum sample by buffer and other assay reagents). The amount of hormone bound to anti-body will nevertheless be proportional to the ambient free hormone concentration in the original sample.
It should be perhaps be noted in this context that—according to Robbins and Rall (1979)—it is precisely this mechanism that operates during the delivery of thyroid hormones to target tissues and cells in vivo. In other words, such cells function as natural ambient analyte concentra-tion detectors.
OTHER APPLICATIONS OF THE PRINCIPLEAs indicated in the introduction of this article, the ambient analyte assay principle is potentially applicable in many situations in which the measurement of sample volume is either impossible or inconvenient, such as the determina-tion of analyte concentrations in vivo. A simple example of such an application was the subject of a study by my col-leagues and myself some years ago, albeit it was abandoned before completion because of the competing demands on our time and resources consequent on the commencement of the collaboration with Boehringer Mannheim on micro-array development.
As is well known, certain hormones, including steroid hormones, are found in saliva, the salivary concentration being claimed to reflect the free concentration present in serum. Salivary steroid assays have therefore attracted con-siderable attention in the past, particularly from partici-pants in the WHO Human Reproduction Program, in the
context of which steroid hormone assays on subjects reluc-tant to provide blood for religious and other reasons is fre-quently a complicating factor.
Nevertheless, the collection of salivary samples also poses logistic problems and is not without an attendant health risk. In principle, these could be obviated by the use of a small plastic probe bearing a small area of antibody at its tip, the probe being sucked by the subject for a specified time interval thereby permitting “sensing” of the ambient salivary steroid concentration. It should be noted in this context that ambient analyte assay conditions are fulfilled if (assuming the presence of 105 molecules of antibody on the microspot surface; the antibody having an affinity con-stant of 1011 L/M) the fluid volume to which the antibody is exposed exceeds ca. 1.7 µL. Thus, the presence of an extremely small amount of saliva suffices to permit mea-surements that are sample volume independent. However, though initial studies using this approach yielded encour-aging results, the study was halted (for the reasons indi-cated earlier) before full validation and reliability tests could be completed.
This example nevertheless illustrates one potential use of what is, in effect, an ambient analyte sensor, albeit not one embodying a transduction system permitting con-tinuous monitoring (by electronic or other means) of changing analyte concentrations.14 Other such uses in medical practice and in other contexts can be readily envisaged.
Summary and ConclusionAmbient analyte assay represents a concept that is not immediately apparent and often provokes initial disbelief. (Indeed, the author was once challenged to prove its valid-ity experimentally by a well-known Nobel Laureate, a challenge which—given the concept’s solid theoretical basis—was not difficult to meet.) In this article, some of its more important implications have been discussed, among which the emergence and widespread use of miniaturized multianalyte chip-based microarray methods (for DNA analysis, for the determination of the products of gene expression (proteomics) and for conventional immunodi-agnostic applications) are likely to have the most signifi-cant and enduring consequences. Indeed, for the various reasons indicated in this article, immunoanalyzers relying on conventionally-formatted binding assays are ultimately likely to be replaced by much smaller instruments based on the use of microarrays, permitting the rapid determination of multiple or single analytes as required. It should be noted in this context that many hormones and other sub-stances comprise heterogeneous mixtures, the only fully satisfactory solution to their assay being the determination of their principal components (Ekins, 1990).
Ambient analyte assay can, in short, be anticipated to revolutionize the entire medical diagnostics field in the future.
14 The slow kinetics of antibody–antigen reactions nevertheless preclude the monitoring of rapidly-changing analyte concentrations notwithstanding the emergence of satisfactory and sensitive transduction systems permitting continuous measurement of antibody occupancy.
121CHAPTER 2.5 Ambient Analyte Assay
EDITOR’S UPDATE FOR FOURTH EDITION: RECENT DEVELOPMENTS (BY DAVID WILD)Parpia and Kelso (2010) independently tested the coun-ter intuitive claims for ambient analyte assay that an immunoassay’s limit of detection can be improved by reducing the amount of capture antibody, and that the results should be insensitive to the volume of sample as well as the amount of capture antibody added. They used flow cytometric analysis to detect the binding between a fluorescent ligand and capture microparticles, since this methodology can directly measure fractional occupancy, the primary response variable in ambient analyte theory.
After experimentally determining that the theoretical requirements for ambient analyte conditions had been achieved, comparisons were carried out between ambient and non-ambient assays in terms of signal strength, limit of detection, and sensitivity to variation in reaction volume and number of particles.
The critical number of binding sites required for an assay to be in the ambient analyte region was estimated to be 0.1 VKd, where V is the reaction volume in liters (L) and Kd is the equilibrium dissociation constant in moles per liter. The parameter b is used to define the point where VKd = 1. Parpia and Kelso created two assays, one in the ambient analyte range with b = 0.047 (surface area 0.000445 cm2) and the other at b = 4.75 (surface area 0.045 cm2).
As predicted by the theory, the ambient analyte assay exhibited a superior signal/noise ratio and this reduced the limit of detection, proving that ambient analyte assays can be ultrasensitive, validating this part of the theory. They demonstrated that when the ambient analyte criteria for binding sites were achieved, the signal level was no dif-ferent between sample volumes of 100 and 200 µL, whereas as the antibody binding site density was reduced, beyond the ambient analyte requirements, the impact of sample volume gradually became apparent. The signal level in the ambient analyte version of the assay was also unaffected by variations in the number of binding sites. They concluded that ambient analyte theory is an excel-lent guide to developing assays with superior performance characteristics.
Hartmann et al. (2009) wrote a review on protein micro-arrays for diagnostic assays that updates the subject since Roger Ekins first authored this chapter. Their excellent summary includes many recent references and several use-ful websites.
References and Further ReadingBassett, D.E., Eisen, B. and Boguski, M.S. Gene expression informatics—it’s all in
your mine. Nature Genet. 21, 51–55 (1999).Bowtell, D.D.L. Options available—from start to finish—for obtaining expression
data by microarray. Nature Genet. 21, 25–32 (1999).Cornell, B.A., Braach-Maksvitis, V.L.B., King, L.G., et al. A biosensor that uses
ion-channel switches. Nature 387, 580–583 (1997).Crank, J. The Mathematics of Diffusion. 2nd edn (Oxford University Press, Oxford, 1975).Ekins, R.P. Measurement of analyte concentration. British Patent No. 8224600 (1983).Ekins, R.P. The free hormone concept. In: Thyroid Hormone Metabolism (ed
Hennemann, G.), 77–106 (Marcel Dekker, New York, 1985).Ekins, R.P. Hypothesis: the roles of serum thyroxine binding proteins and maternal
thyroid hormones in foetal development. Lancet 1, 1129–1132 (1985b).Ekins, R.P. Development of microspot multi-analyte ratiometric immunoassay using
dual fluorescent-labelled antibodies. Analytica Chimica Acta 227, 73–96 (1989).Ekins, R. Measurement of free hormones in blood. Endocr. Rev. 11, 5–46 (1990).Ekins, R. Immunoassay standardization. In: Improvement of Comparability and
Compatibility of Laboratory Assay Results in Life Sciences. 3rd Bergmeyer Conference: Immunoassay Standardization (eds Kallner, A., Magid, E.D., Albert, W.), Scand. J. Clin. Lab. Invest. 51 (Suppl 205) 33–46 (1991).
Ekins, R.P. Ultrasensitive ligand assays. In: Principles of Nuclear Medicine (eds Wagner, H.N., Szabo, Z., Buchanan Murphy, J.W.), 247–266 (W.B. Saunders, Philadelphia, 1995).
Ekins, R.P. Ligand assays: from electrophoresis to miniaturized microarrays. Clin. Chem. 44, 2015–2030 (1998a).
Ekins, R. The science of free hormone measurement. Proc. UK NEQAS Meeting 3, 35–59 (1998b).
Ekins, R. and Chu, F. Multianalyte testing. Clin. Chem. 39, 369–370 (1993).Ekins, R.P., Edwards, P.R. and Newman, B. The role of binding proteins in hor-
mone delivery. In: Free Hormones in Blood (eds Albertini, A. and Ekins, R.), 3–42 (Elsevier Biomedical Press, Amsterdam, 1982).
Finckh, P., Berger, H., Karl, J., et al. Microspot®—an ultrasensitive microarray-based ligand assay system. A practical application of ambient analyte assay theory. Proc. UK NEQAS Meeting 3, 155–165 (1998).
Fodor, S.P.A., Read, J.L., Pirrung, M.C., et al. Light-directed, spatially addressable parallel chemical synthesis. Science 251, 767–773 (1991).
Hartmann, M., Roeraade, J., Stoll, D., Templin, M.F. and Joos, T.O. Protein microarrays for diagnostic assays. Anal. Bioanal. Chem. 393, 1407–1416 (2009).
Keller, N., Richardson, U.I. and Yates, F.E. Protein binding and the biological activity of corticosteroids: in vivo induction of hepatic and pancreatic alanine aminotransferases by corticosteroids in normal and estrogen treated rats. Endocrinology 84, 49–92 (1969).
Midgeley, J.E.M. and Wilkins, T.A. A method for determining the free portions of substances in biological fluids. European Patent No 0026103 (1985).
Pardridge, W.M. Plasma protein-mediated transport of steroid and thyroid hor-mones. Am. J. Physiol. 252, E157–E162 (1987).
Parpia, Z.A. and Kelso, D.M. Empirically optimized flow cytometric immunoassay validates ambient analyte theory. Anal. Biochem. 401, 1–6 (2010).
Robbins, J. and Rall, J.E. Thyroid hormone transport in blood and extravascular fluids. In: Hormones in Blood (eds Gray, C.H. and James, V.H.T.), 575–688 (Academic Press, London, 1979).
Schena, M., Heller, R.A., Theriault, T.P., et al. Microarrays: biotechnology’s dis-covery platform for functional genomics. Trends Biotechnol. 16, 301–306 (1998).
Seal, V.S. and Doe, R.P. Corticosteroid-binding globulin: biochemistry, physiol-ogy and phylogeny. In: Steroid Dynamics (eds Pincus, G., Nadao, T. and Tait, J.F.), 63–90 (Academic Press, New York, 1966).
Sturgeon, C., Stenman, U.-H., Bidart, J.-M., Birken, S., Berger, P., Lequin, R.M., Norman, R.J. and Bristow, A. IFCC Working Group on standardisation of human chorionic gonadotropin measurements: progress report. Proc. UK NEQAS Meeting 3, 134–139 (1998).
Tait, J.F. and Burstein, S. In vivo studies of steroid dynamics in man. In: The Hormones. Vol V (eds Pincus, V., Thimann, K.V. and Astwood, E.B.), 441–557 (Academic Press, New York, 1964).