Embed Size (px)
Citation preview
The Network Effect: Integrative
Systems Approaches to Modeling
Biological Processes
John Quackenbush
AMATA
October 14, 2013
Essentially, all models are wrong,
but some are useful.
– George E. Box
The purpose of models is not to fit the
data but to sharpen the questions.
–Samuel Karlin
Every revolution in science—from
Copernican heliocentric model to the
rise of statistical and quantum
mechanics, from Darwin’s theory of
evolution and natural selection to the
theory of the gene—has been driven
by one and only one thing: access to
data.
–John Quackenbush

Treatment
Options
Quality
Of Life
Genetic
Risk
Early
Detection
Patient
Stratification
Disease
Staging
Outcomes
Natural History of Disease Clinical Care
Environment
+ Lifestyle
Birth Treatment Death
Disease Progression and
Personalized Care
Biomarkers
Networks
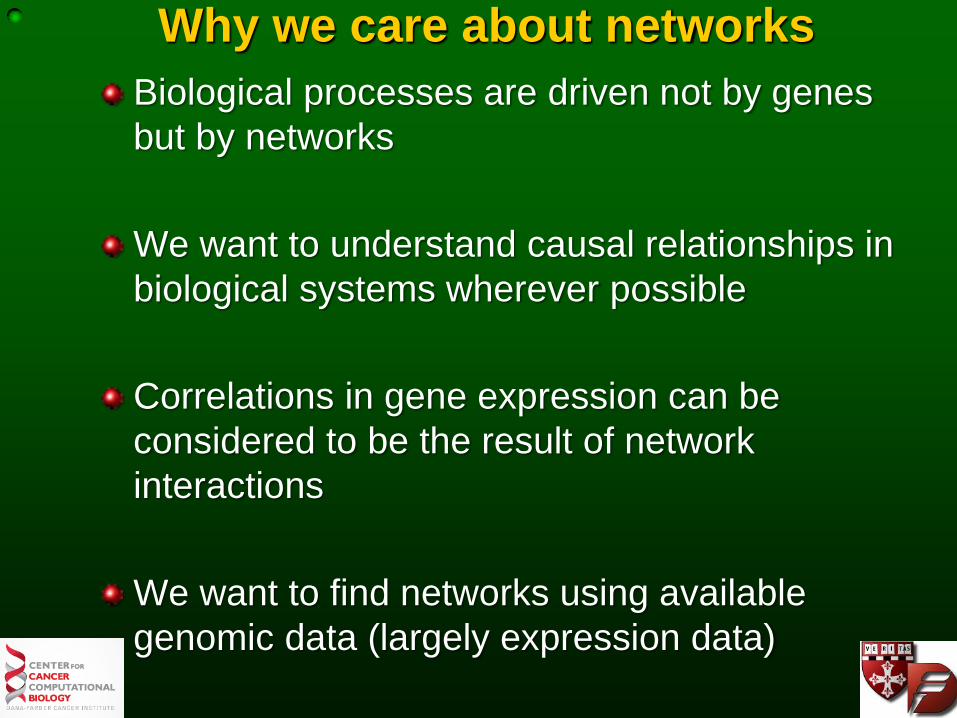
Why we care about networks
Biological processes are driven not by genes
but by networks
We want to understand causal relationships in
biological systems wherever possible
Correlations in gene expression can be
considered to be the result of network
interactions
We want to find networks using available
genomic data (largely expression data)
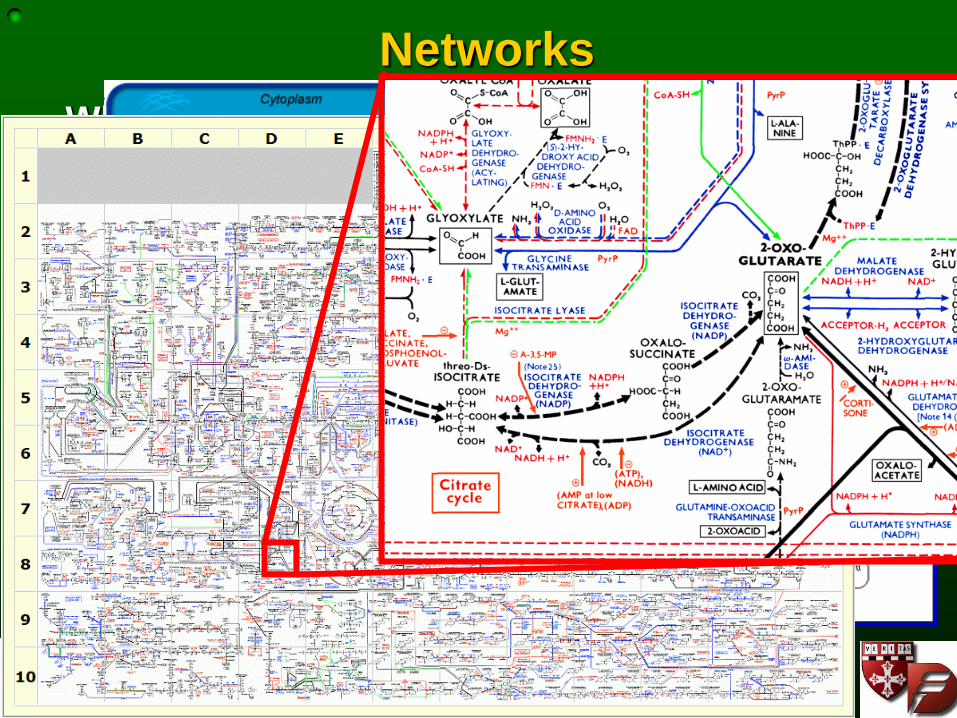
What we are not talking about:
Metabolic pathways – KEGG
Signal transduction pathways – BioCarta
Biochemical Pathways – Roche (Bohringer)
Transcription Factor Networks
etc.
Networks
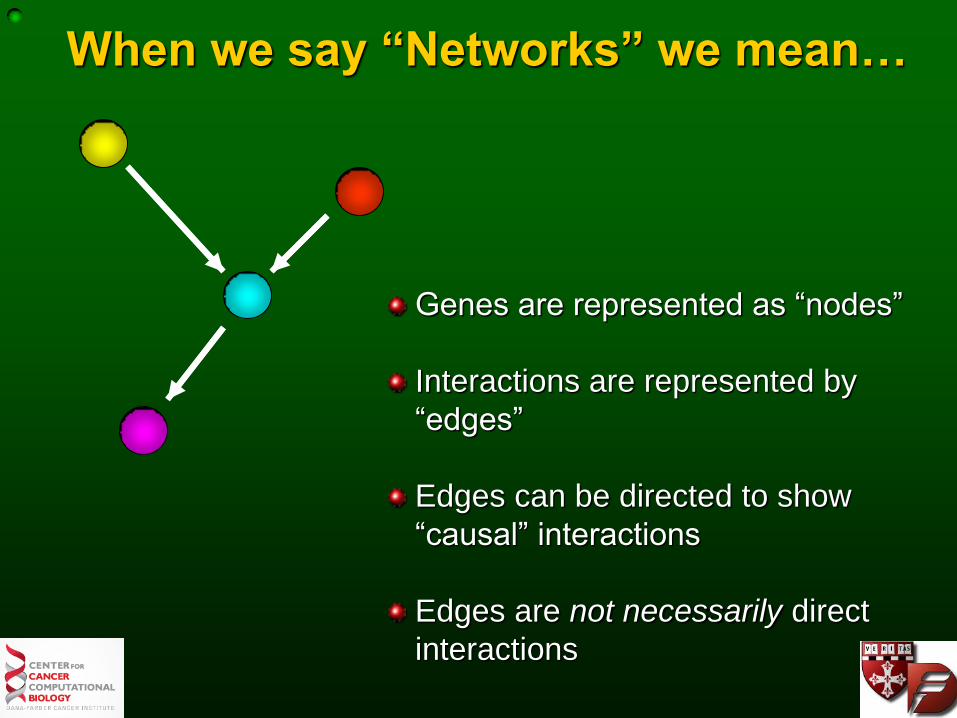
When we say “Networks” we mean…
Genes are represented as “nodes”
Interactions are represented by
“edges”
Edges can be directed to show
“causal” interactions
Edges are not necessarily direct
interactions
Networks as Models
Phenomenology and Models Ultimately, we look to develop a theory that describes the interactions that drive biological systems
The embodiment of the resulting theory should be a model describing the interactions we are seeking to understand
Phenomenology, or phenomenological models, describe a body of knowledge that relates empirical observations of phenomena to each other, in a way which is consistent with fundamental theory, but is not directly derived from theory
The question is not “Is this model right?” Rather, the question is “Is the model useful?”
Subtypes in Ovarian Cancer
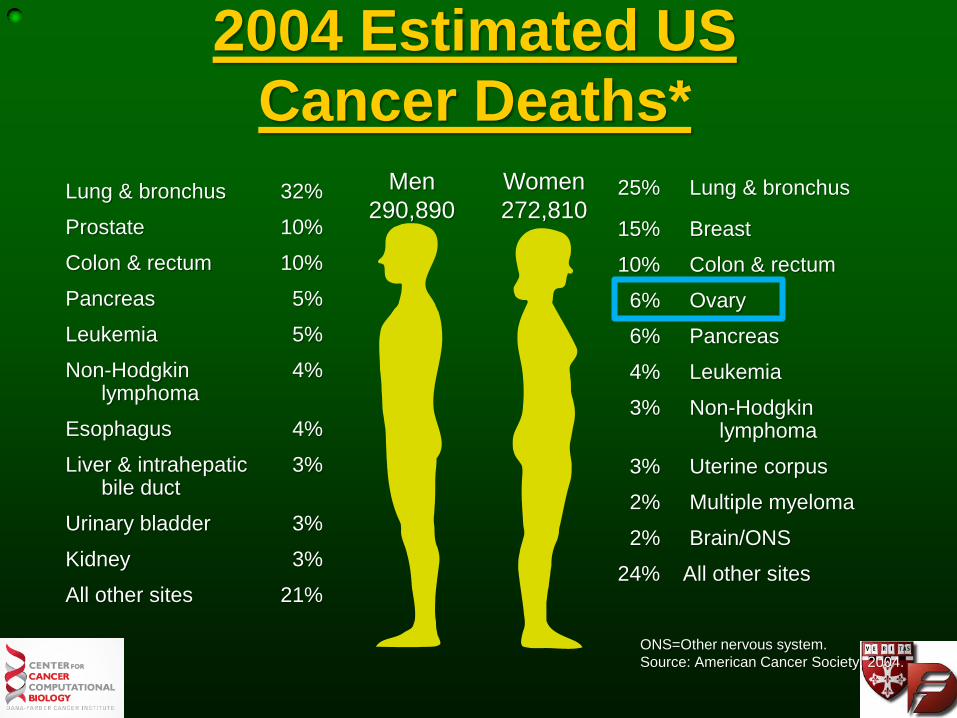
2004 Estimated US
Cancer Deaths*
ONS=Other nervous system.
Source: American Cancer Society, 2004.
Men
290,890
Women
272,810 25% Lung & bronchus
15% Breast
10% Colon & rectum
6% Ovary
6% Pancreas
4% Leukemia
3% Non-Hodgkin lymphoma
3% Uterine corpus
2% Multiple myeloma
2% Brain/ONS
24% All other sites
Lung & bronchus 32%
Prostate 10%
Colon & rectum 10%
Pancreas 5%
Leukemia 5%
Non-Hodgkin 4% lymphoma
Esophagus 4%
Liver & intrahepatic 3% bile duct
Urinary bladder 3%
Kidney 3%
All other sites 21%
A new subtype of ovarian cancer
mRNA/miRNA and DNA were extracted from 132
well-annotated FFPE samples and profiled on arrays
We used a technique called ISIS to find robust bi-partitions in
the data
A major, robust subtype was associated with expression of
angiogenesis genes
We curated all published gene expression data to validate the
split and signature

Identifying modules using ISIS*
Module: Set of genes supporting a bi-partition
*ISIS: Identifying splits of clear separation (von Heydebreck et al., Bioinformatics 2001)
ISIS searches for stratifications of samples into two groups that maximize a DLD score.
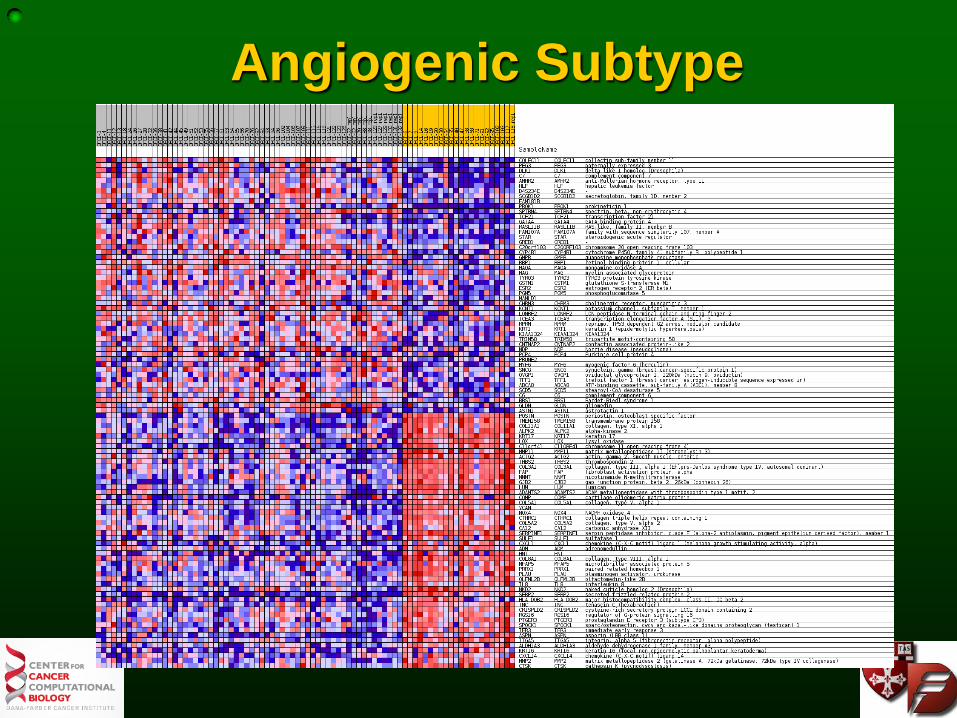
Angiogenic Subtype

Survival and Validation
1606 published
ovarian tumors
1090 high grade,
late stage
serous tumors
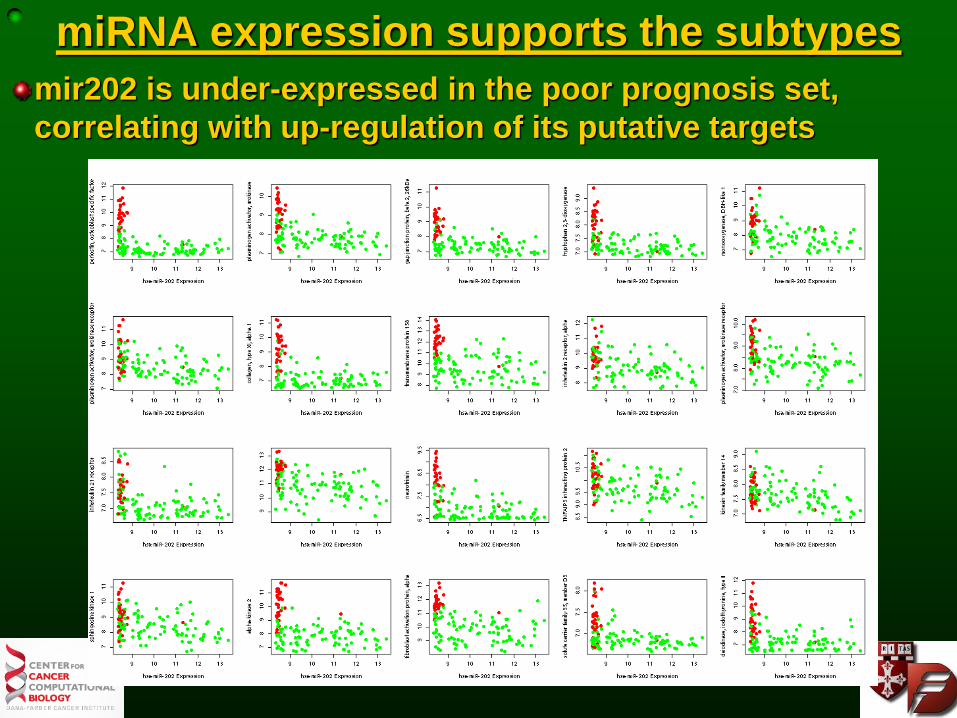
mir202 is under-expressed in the poor prognosis set,
correlating with up-regulation of its putative targets
miRNA expression supports the subtypes

Beyond Bayesian Networks
21
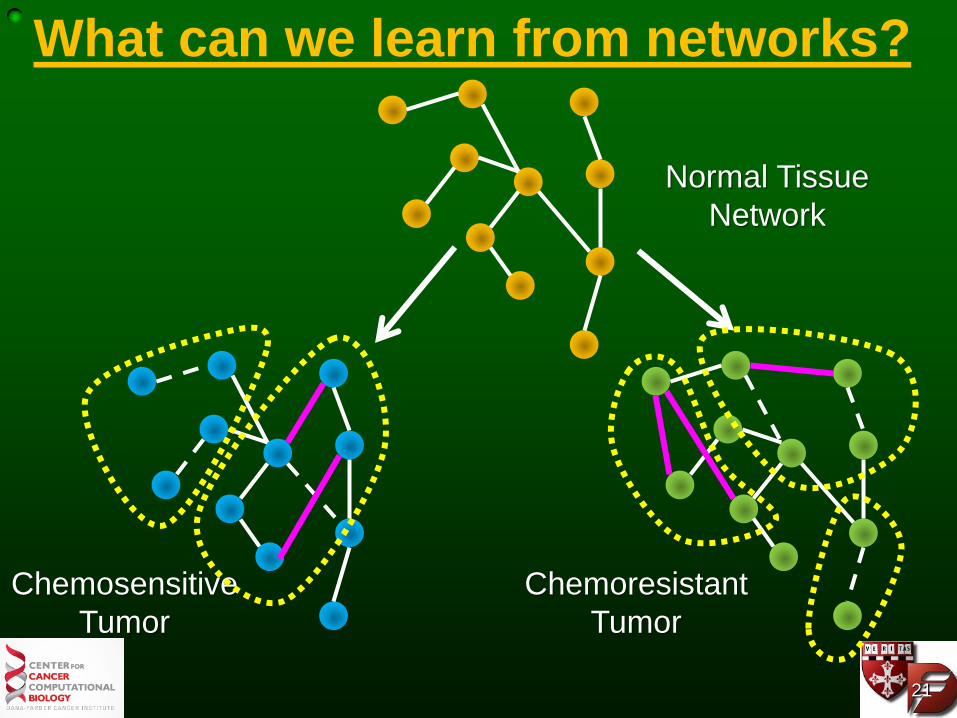
Normal Tissue
Network
Chemosensitive
Tumor
Chemoresistant
Tumor
What can we learn from networks?
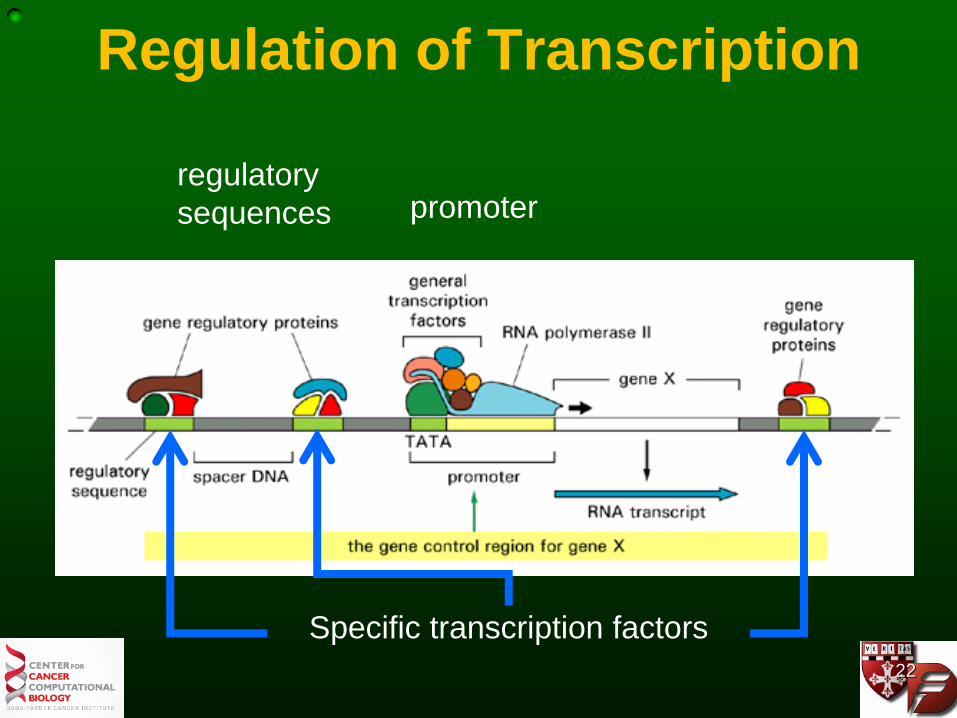
Regulation of Transcription
Specific transcription factors
promoter regulatory
sequences
22

Another Idea: Message Passing
Transcription Factor
Downstream Target
The TF is Responsible for
communicating with its Target
The Target must be Available
to respond to the TF
.
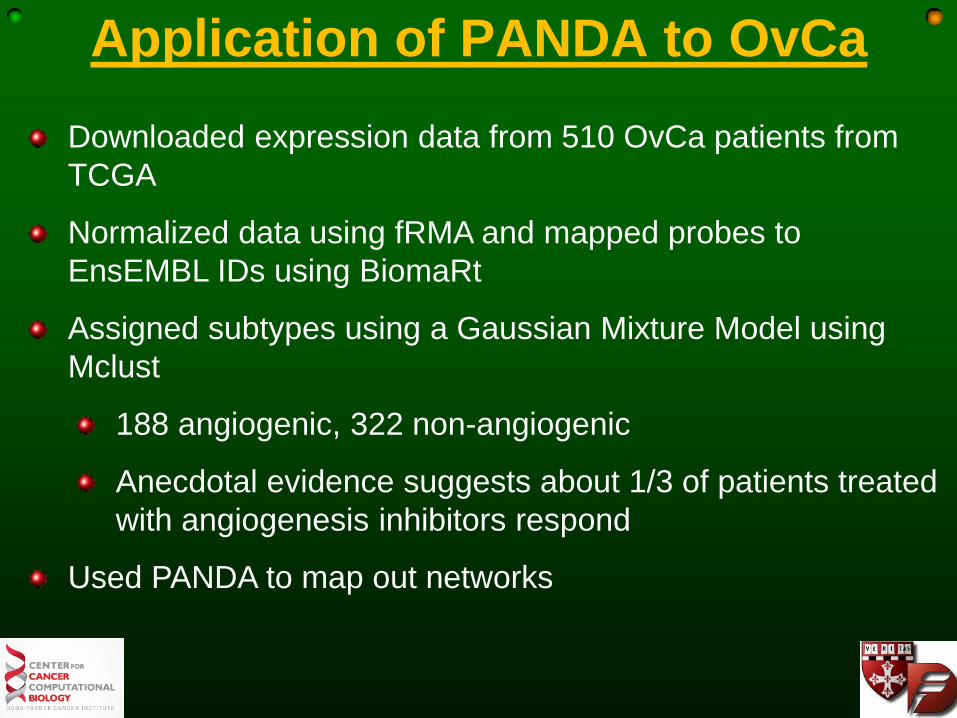
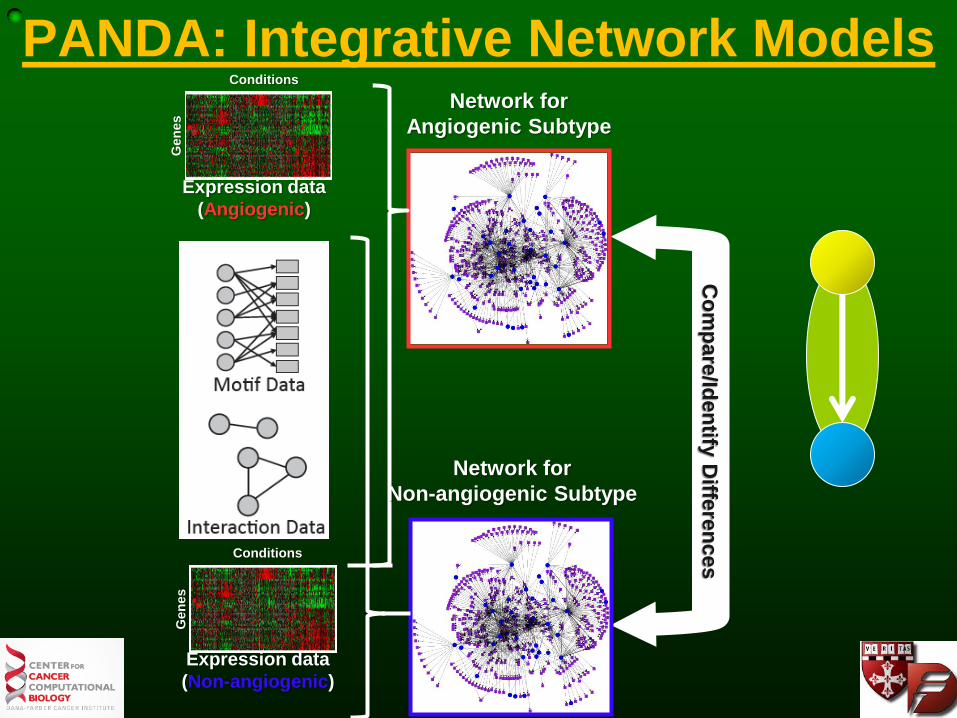
Application of PANDA to OvCa
Downloaded expression data from 510 OvCa patients from
TCGA
Normalized data using fRMA and mapped probes to
EnsEMBL IDs using BiomaRt
Assigned subtypes using a Gaussian Mixture Model using
Mclust
188 angiogenic, 322 non-angiogenic
Anecdotal evidence suggests about 1/3 of patients treated
with angiogenesis inhibitors respond
Used PANDA to map out networks
Gen
es
Conditions
Expression data
(Angiogenic)
Gen
es
Conditions
Expression data
(Non-angiogenic)
Co
mp
are
/Iden
tify D
iffere
nces
Network for
Angiogenic Subtype
Network for
Non-angiogenic Subtype
PANDA: Integrative Network Models
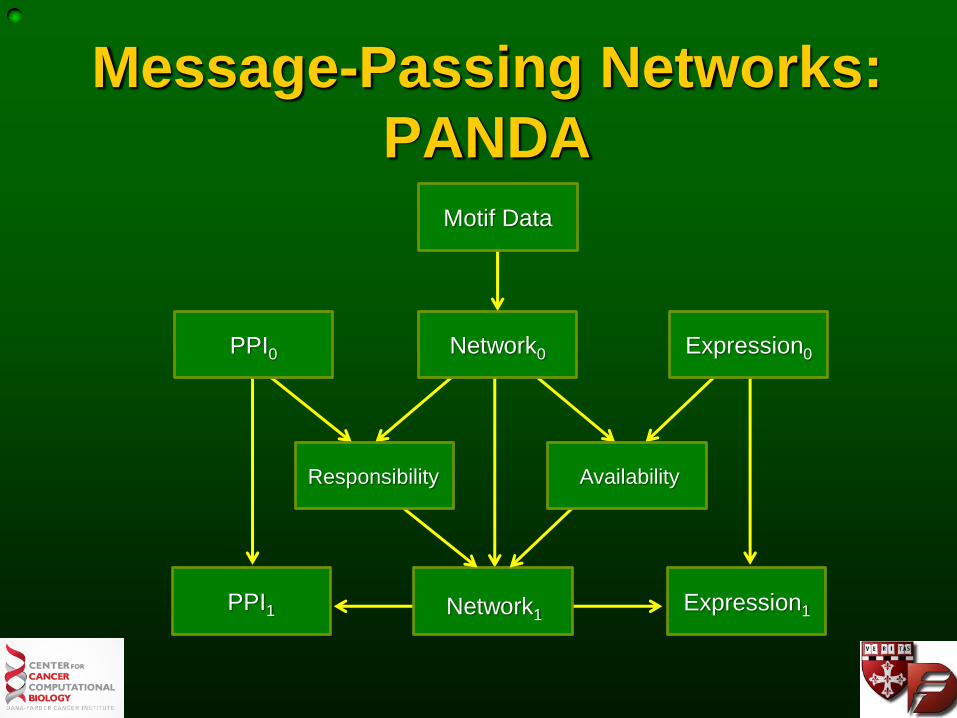
Message-Passing Networks:
PANDA
PPI0 Expression0
Network1
Responsibility Availability
Network0
Motif Data
Expression1 PPI1
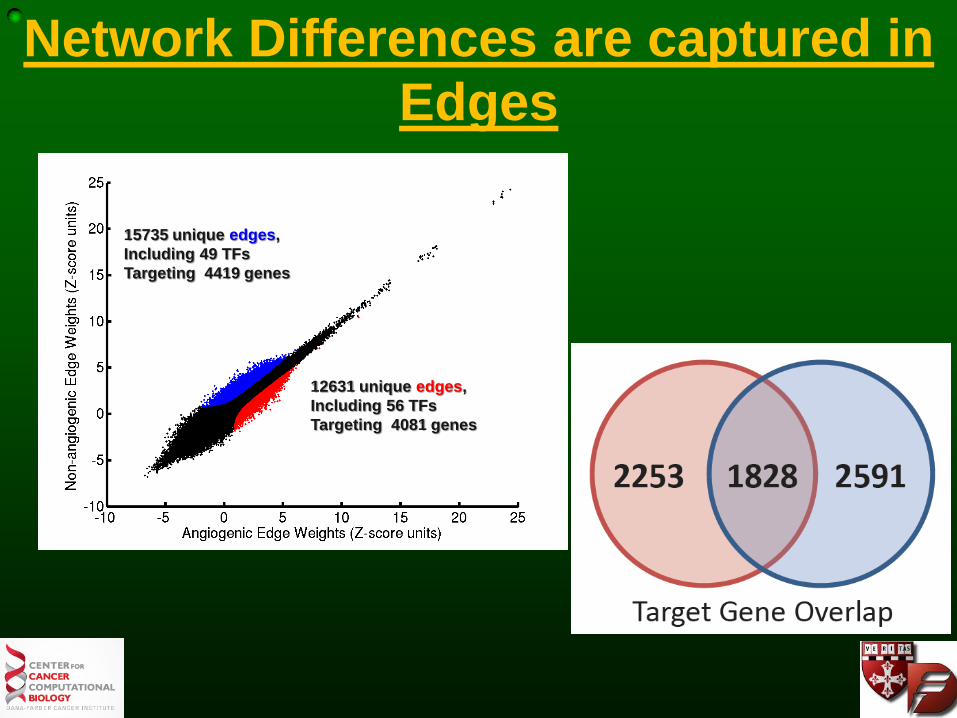
12631 unique edges,
Including 56 TFs
Targeting 4081 genes
15735 unique edges,
Including 49 TFs
Targeting 4419 genes
Network Differences are captured in
Edges
TF differential Expression
Target differential Expression
TF differential Methylation
Target differential Methylation
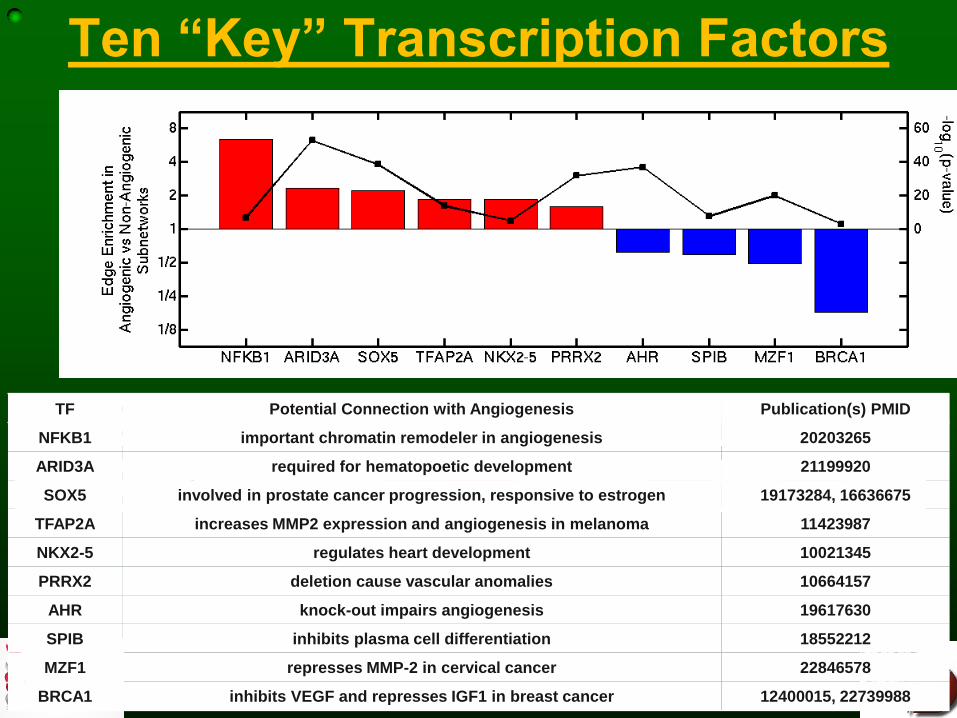
TF Potential Connection with Angiogenesis Publication(s) PMID
NFKB1 important chromatin remodeler in angiogenesis 20203265
ARID3A required for hematopoetic development 21199920
SOX5 involved in prostate cancer progression, responsive to estrogen 19173284, 16636675
TFAP2A increases MMP2 expression and angiogenesis in melanoma 11423987
NKX2-5 regulates heart development 10021345
PRRX2 deletion cause vascular anomalies 10664157
AHR knock-out impairs angiogenesis 19617630
SPIB inhibits plasma cell differentiation 18552212
MZF1 represses MMP-2 in cervical cancer 22846578
BRCA1 inhibits VEGF and represses IGF1 in breast cancer 12400015, 22739988
Ten “Key” Transcription Factors
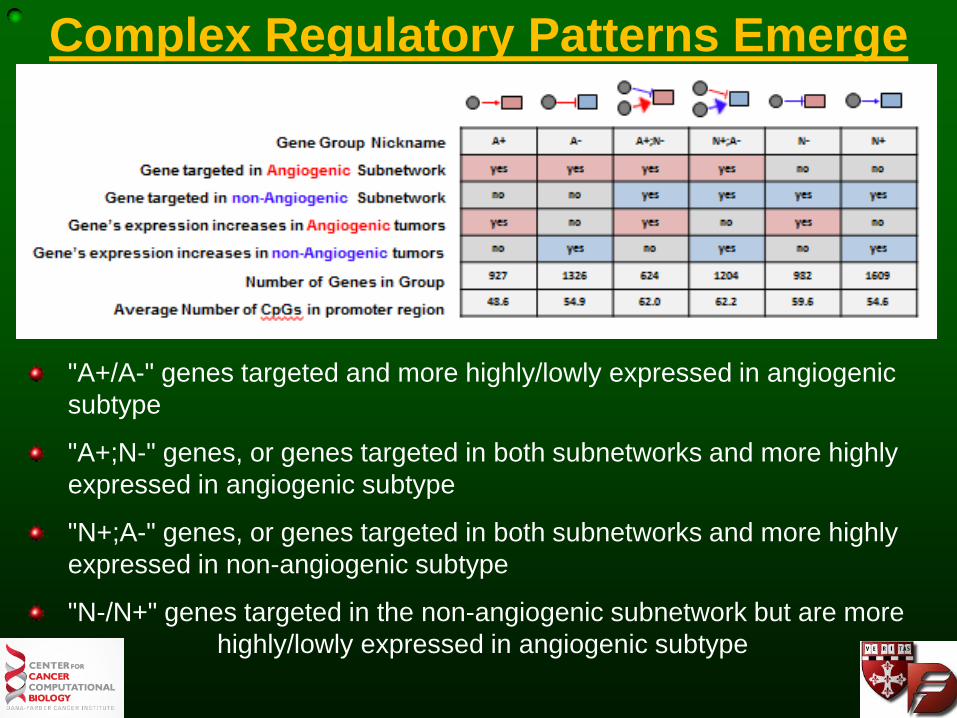
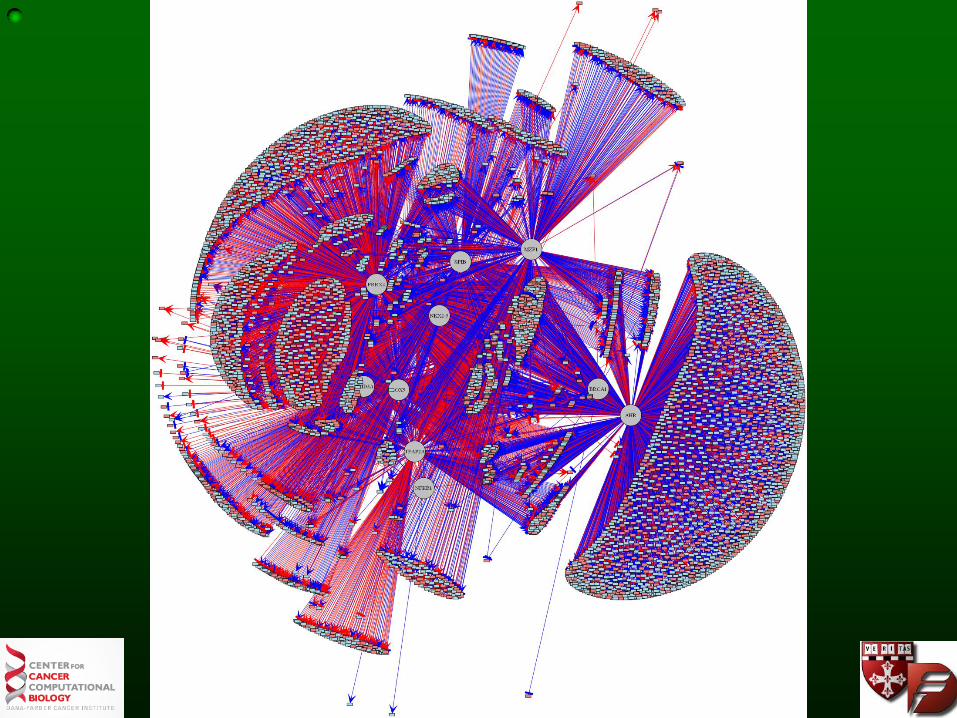
Complex Regulatory Patterns Emerge
"A+/A-" genes targeted and more highly/lowly expressed in angiogenic
subtype
"A+;N-" genes, or genes targeted in both subnetworks and more highly
expressed in angiogenic subtype
"N+;A-" genes, or genes targeted in both subnetworks and more highly
expressed in non-angiogenic subtype
"N-/N+" genes targeted in the non-angiogenic subnetwork but are more
highly/lowly expressed in angiogenic subtype
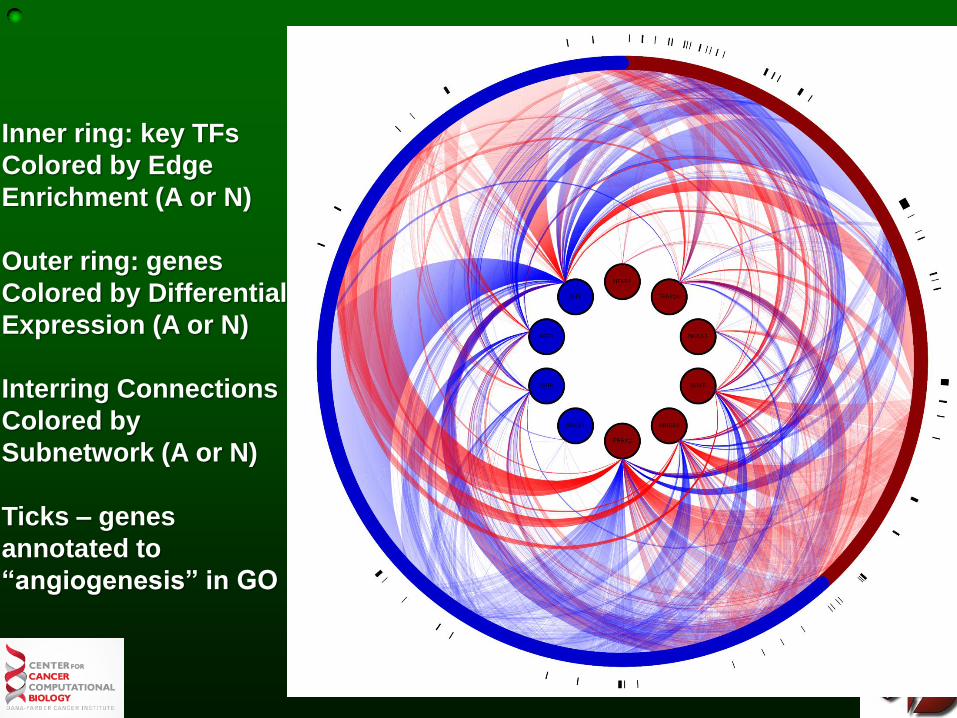
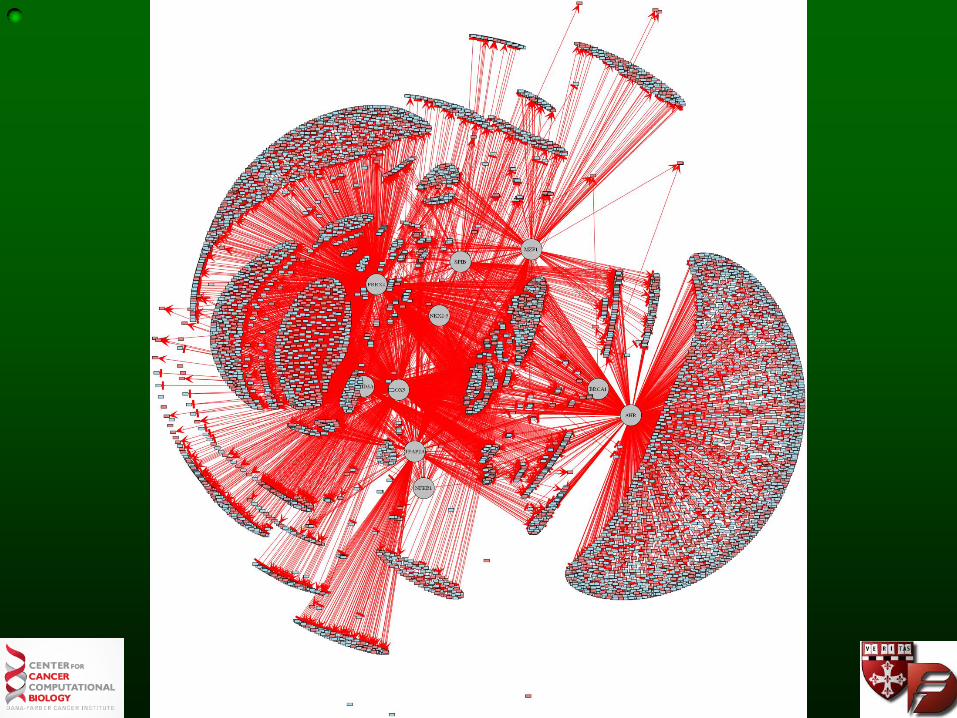
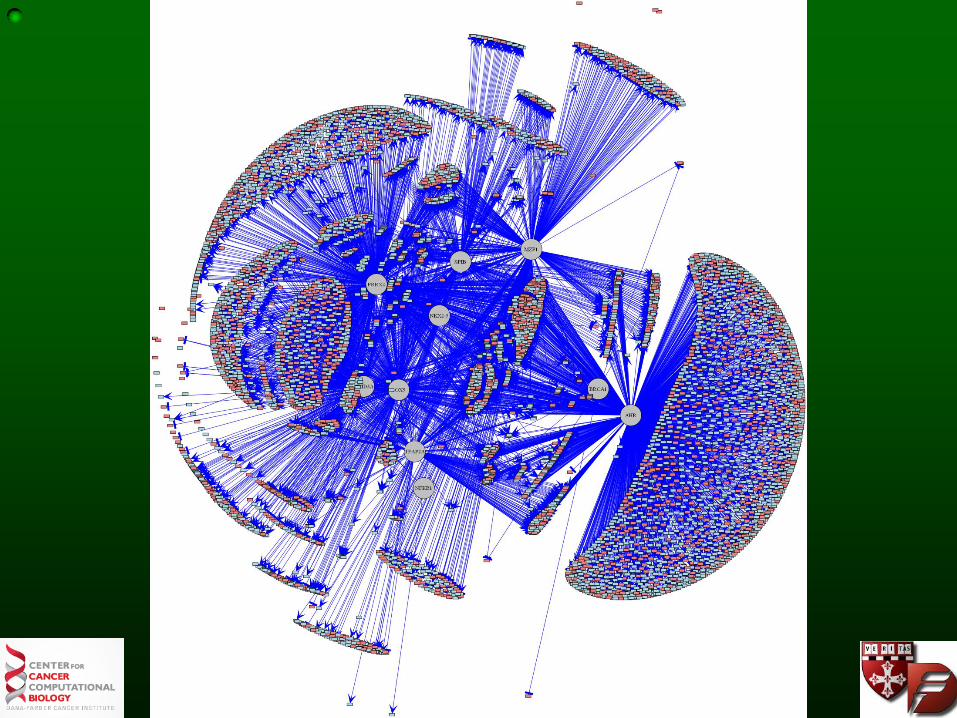
Inner ring: key TFs
Colored by Edge
Enrichment (A or N)
Outer ring: genes
Colored by Differential
Expression (A or N)
Interring Connections
Colored by
Subnetwork (A or N)
Ticks – genes
annotated to
“angiogenesis” in GO
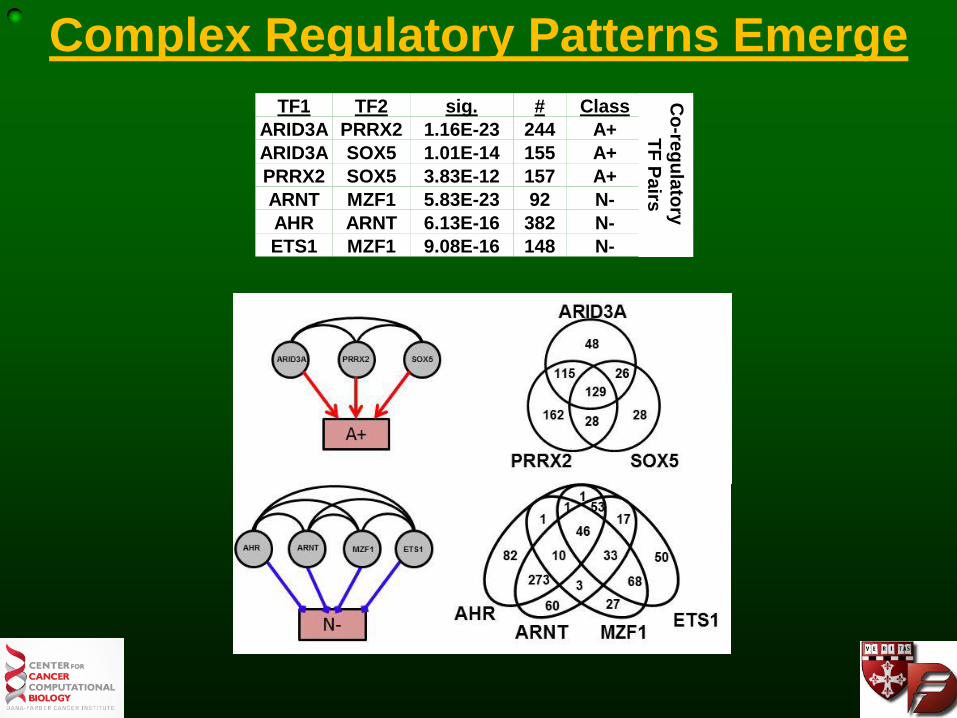
TF1 TF2 sig. # Class
ARID3A PRRX2 1.16E-23 244 A+
ARID3A SOX5 1.01E-14 155 A+
PRRX2 SOX5 3.83E-12 157 A+
ARNT MZF1 5.83E-23 92 N-
AHR ARNT 6.13E-16 382 N-
ETS1 MZF1 9.08E-16 148 N-
Co
-reg
ula
tory
TF
Pa
irs
Complex Regulatory Patterns Emerge

Regulatory Patterns suggest Therapies
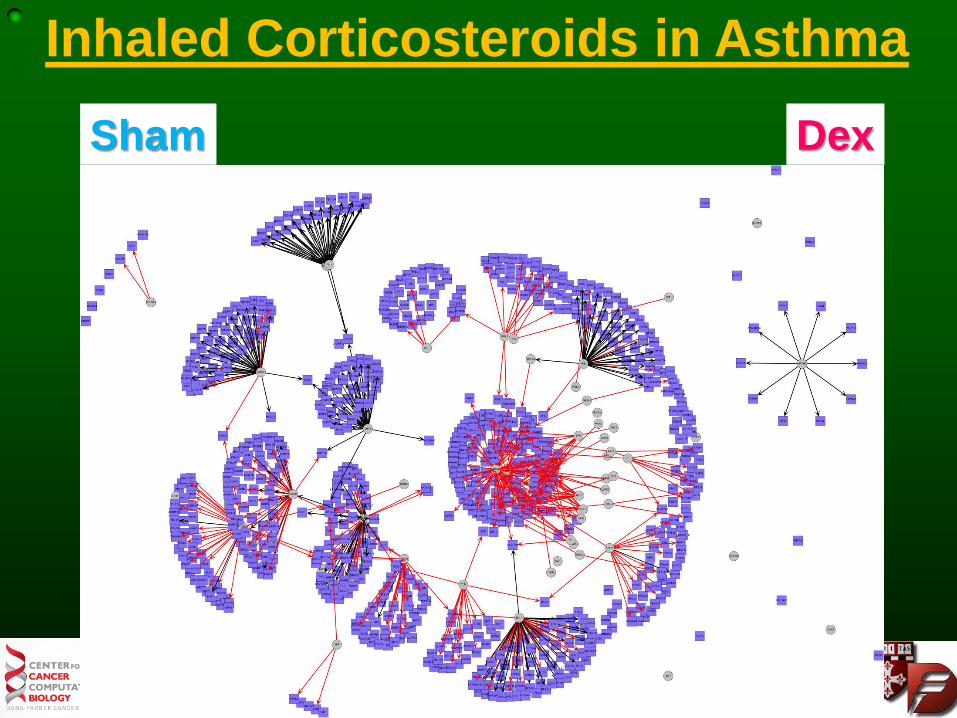
Sham Dex
Inhaled Corticosteroids in Asthma
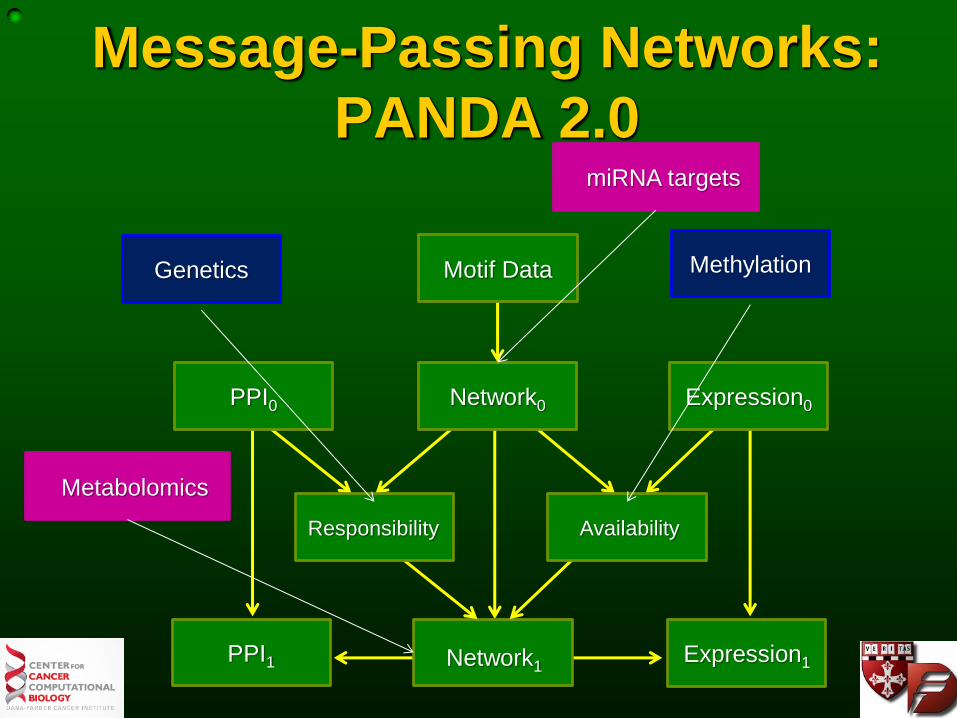
Message-Passing Networks:
PANDA 2.0
PPI0 Expression0
Network1
Responsibility Availability
Network0
Motif Data
Expression1 PPI1
Methylation Genetics
miRNA targets
Metabolomics
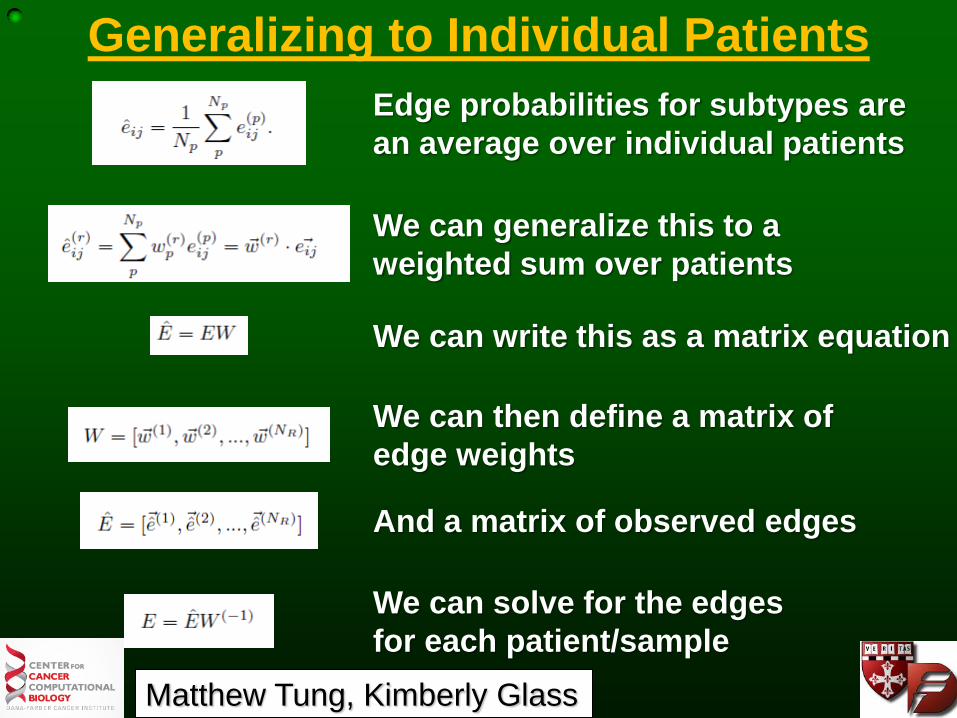
Generalizing to Individual Patients
Edge probabilities for subtypes are
an average over individual patients
We can generalize this to a
weighted sum over patients
We can then define a matrix of
edge weights
And a matrix of observed edges
We can solve for the edges
for each patient/sample
We can write this as a matrix equation
Matthew Tung, Kimberly Glass
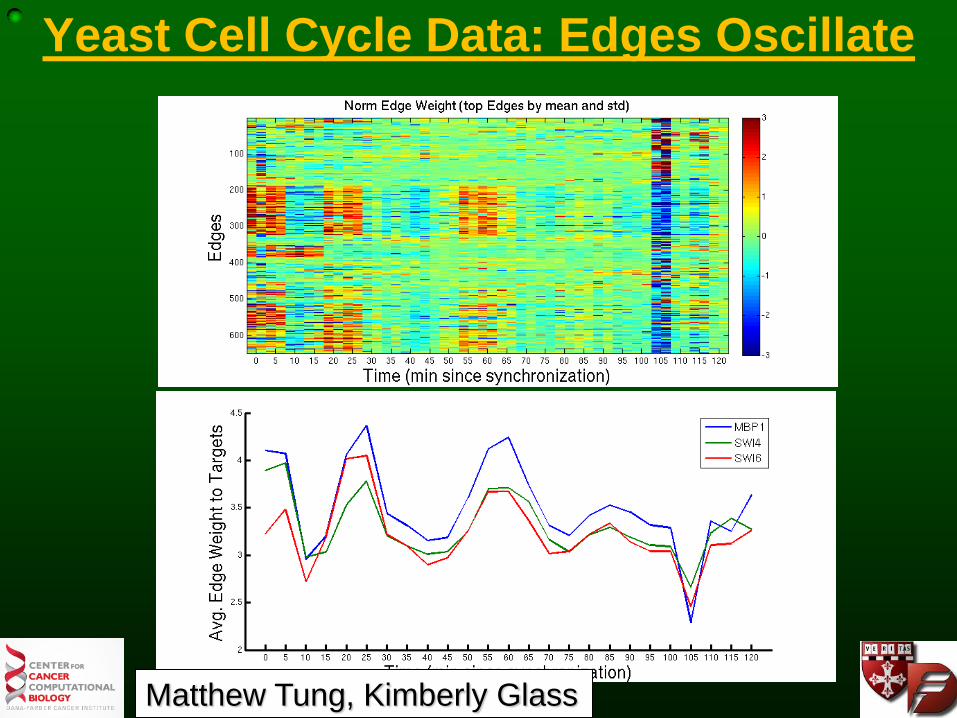
Yeast Cell Cycle Data: Edges Oscillate
Matthew Tung, Kimberly Glass
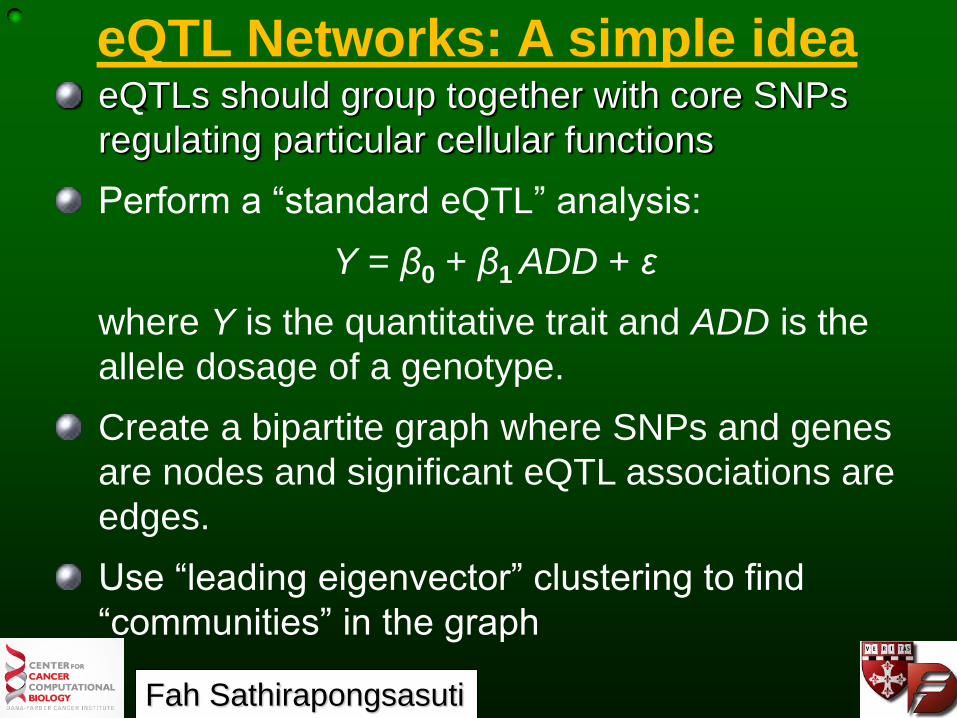
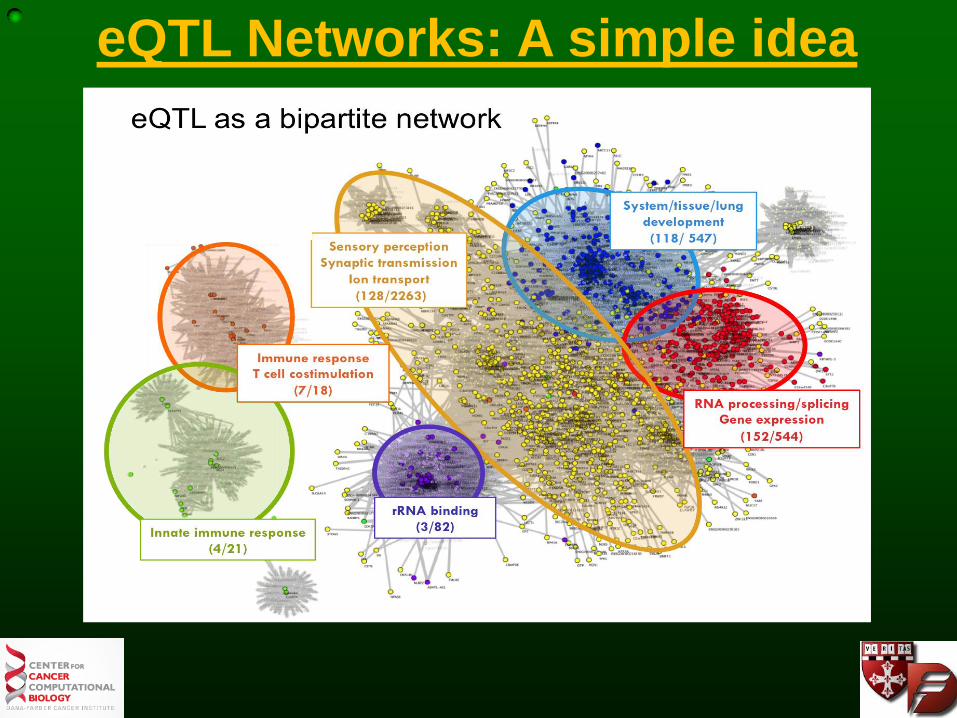
eQTL Networks: A simple idea
Fah Sathirapongsasuti
eQTLs should group together with core SNPs
regulating particular cellular functions
Perform a “standard eQTL” analysis:
Y = β0 + β1 ADD + ε
where Y is the quantitative trait and ADD is the
allele dosage of a genotype.
Create a bipartite graph where SNPs and genes
are nodes and significant eQTL associations are
edges.
Use “leading eigenvector” clustering to find
“communities” in the graph
eQTL Networks: A simple idea
Fah Sathirapongsasuti
Common QTL SNPs regulate common functions
The modularity of a network quantifies the extent to which
vertices cluster into community groups.
Bipartite network clustering was done uaing the leading
eigenvector method (Barber 2007 Physical Rev).
We assessed functional enrichment for each cluster using the
Bioconductor GOStats package which takes into account the
hierarchical structure of GO annotation.
eQTL Networks: A simple idea
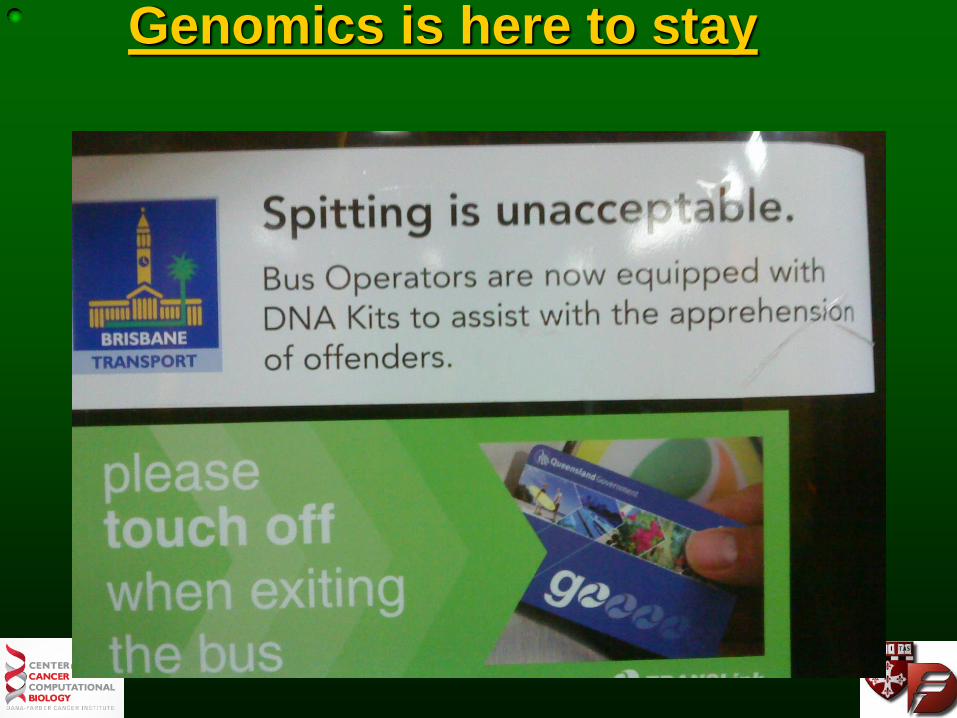
Genomics is here to stay

Before I came here I was confused
about this subject.
After listening to your lecture,
I am still confused but at a higher level.
- Enrico Fermi, (1901-1954)
Gene Expression Team
Fieda Abderazzaq
Stefan Bentink
Aedin Culhane
Benjamin Haibe-Kains
Jessica Mar
Melissa Merritt
Megha Padi
Renee Rubio
University of Queensland
Christine Wells
Lizzy Mason
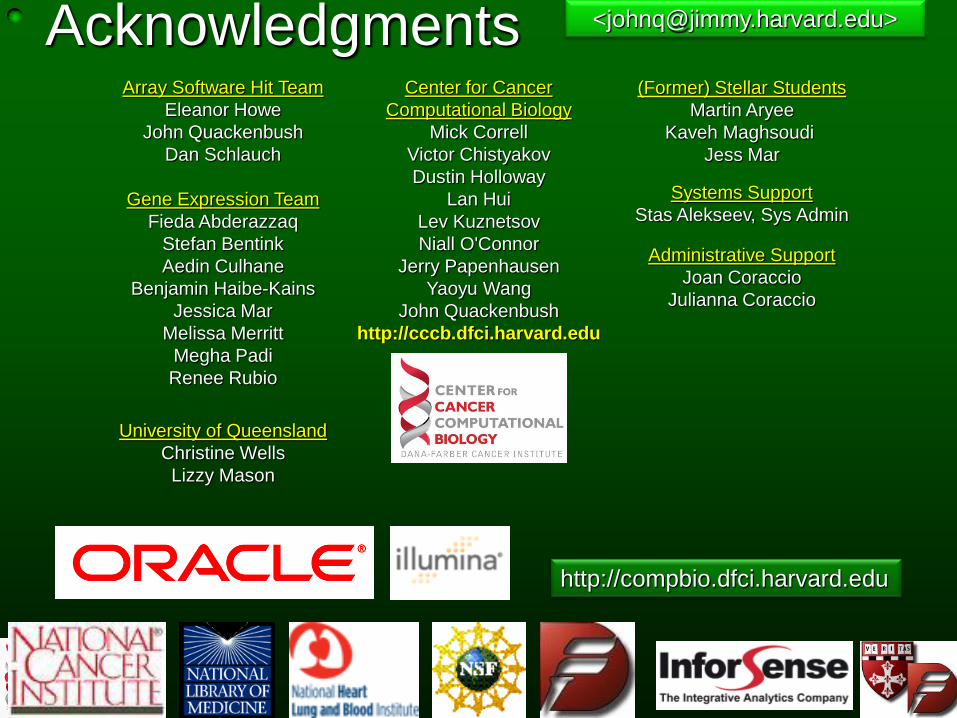
<[email protected]> Acknowledgments
http://compbio.dfci.harvard.edu
(Former) Stellar Students
Martin Aryee
Kaveh Maghsoudi
Jess Mar
Systems Support
Stas Alekseev, Sys Admin
Array Software Hit Team
Eleanor Howe
John Quackenbush
Dan Schlauch
Administrative Support
Joan Coraccio
Julianna Coraccio
Center for Cancer
Computational Biology
Mick Correll
Victor Chistyakov
Dustin Holloway
Lan Hui
Lev Kuznetsov
Niall O'Connor
Jerry Papenhausen
Yaoyu Wang
John Quackenbush
http://cccb.dfci.harvard.edu


![WIBL: Workbench for Integrative Biological Learningvil/wiblpaper.pdf · 2011-06-14 · Current tools for data integration [1] and for the visualization of biological network data](https://img.pdfslide.net/doc/110x75/5f578a0c39c08f054241ba96/wibl-workbench-for-integrative-biological-vilwiblpaperpdf-2011-06-14-current.jpg)