Embed Size (px)
Citation preview

Outbreak R0 Boston, USA (1721) 4.3 Burford (1758) 3.4 Chester (1774) 5.8 Warrington (1773) 4.0-5.3 Paris, France (1766) 4-5 London (1836-1870) ∼ 5 Kosovo (1972) 10.8 Europe (1958-1973) 10-11
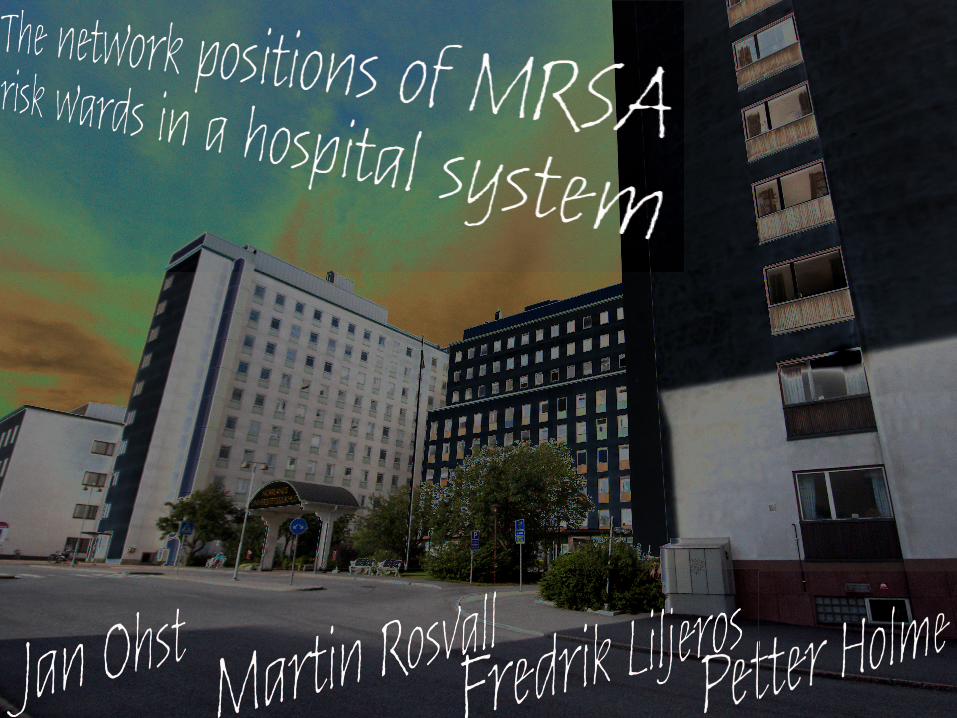
Our dataset - 10 years - 308,102 patients - 8,507 wards - 3,185,710 links - 1,261 positive MRSA cases - 21 strains

0 1000 2000time, t (days)
0123
num
ber o
f nod
es, N
!103
45678

0
1
2
3
0 1000 2000time, t (days)
num
ber o
f link
s, M
!106

–7
–6
–5
–3
0.1
10
10
–410
10
10–2
prob
abilit
y de
nsity
, p(k i
n)
100 1000 2000 3000 4000 5000
in-degree, kin

–1000
–500
0
500
1000
0 1000 2000 3000 4000 5000in-degree, kin
k out
– k in

0
1
2
3
4
5
6
7
8
1 102 103 105104in-degree, k in
–4!10
relat
ive a
vera
ge p
reva
lence,
P

10410310210–6
10–5
10–4
10–3
10–2
10–1
1 1
0.8
0.6
0.4
0.2
0in-degree
fracti
on of
infec
ted w
ards
prev
alenc
e in
infect
ed w
ards
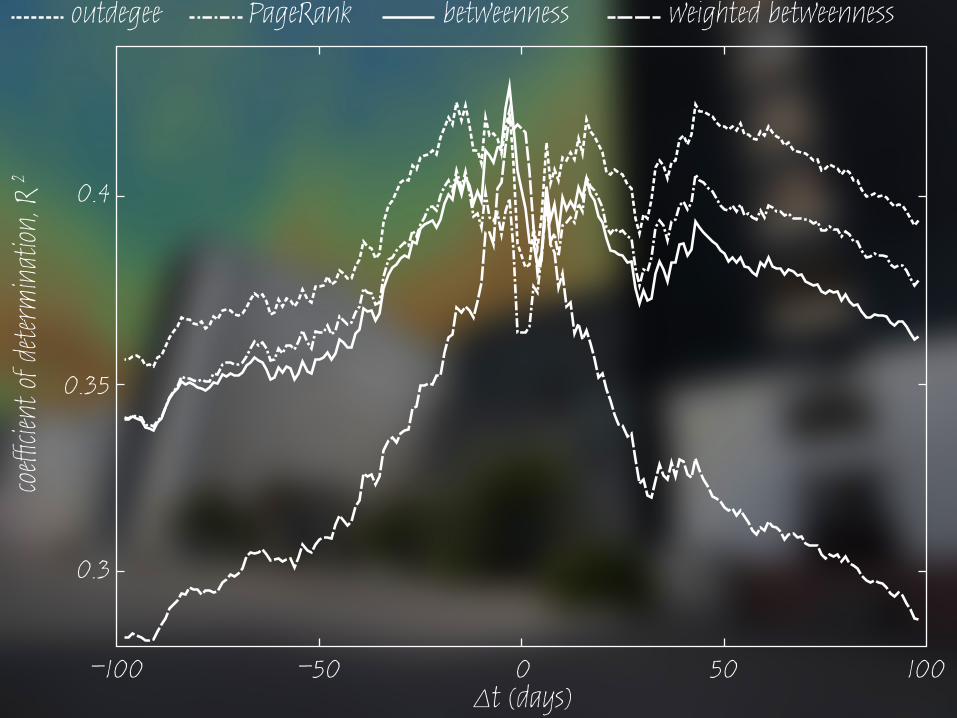
0.3
0.35
0.4
50 100–50 0–100
coef!
cient
of d
eterm
inatio
n, R
2
"t (days)
outdegee PageRank betweenness weighted betweenness

1
10
100
1 10 100
1000
number of infected individuals
time o
f pre
cense
in da
ta (d
ays)

1
10
100
1 10 100
1000
number of infected individuals
time o
f pre
cense
in da
ta (d
ays)

1
10
100
1000
1 10 100number of infected individuals
num
ber o
f inf
ected
war
ds
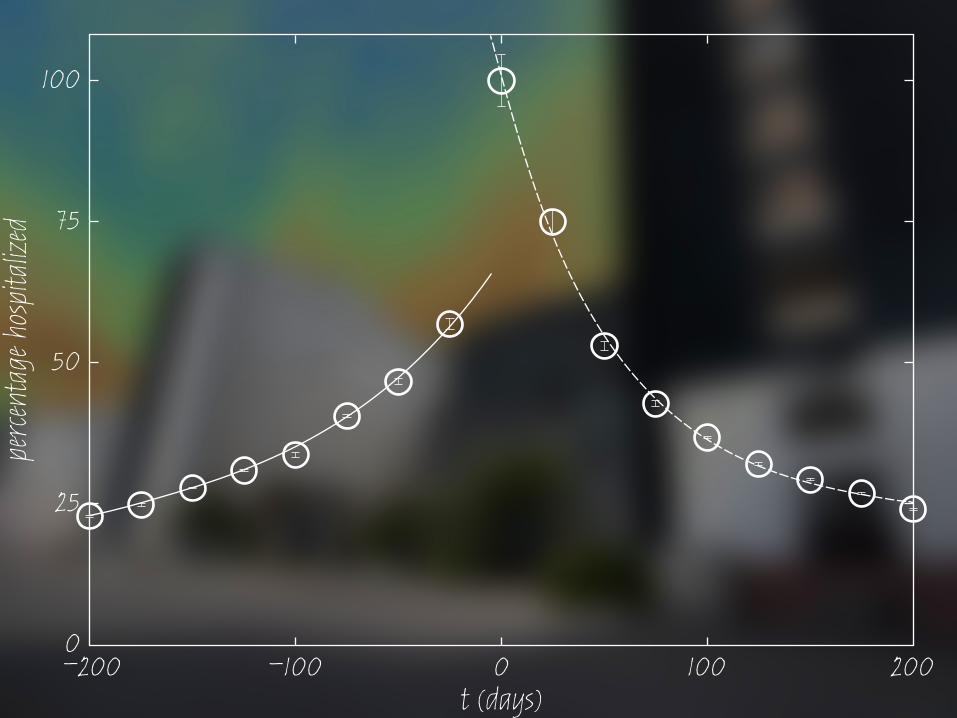
25
50
75
100
–200 –100 100 20000
t (days)
perce
ntag
e hos
pitali
zed

infectedcontrol
950
1000
1050
1100
–200 –100 0 100 200
aver
age o
ut-d
egre
e
t (days)

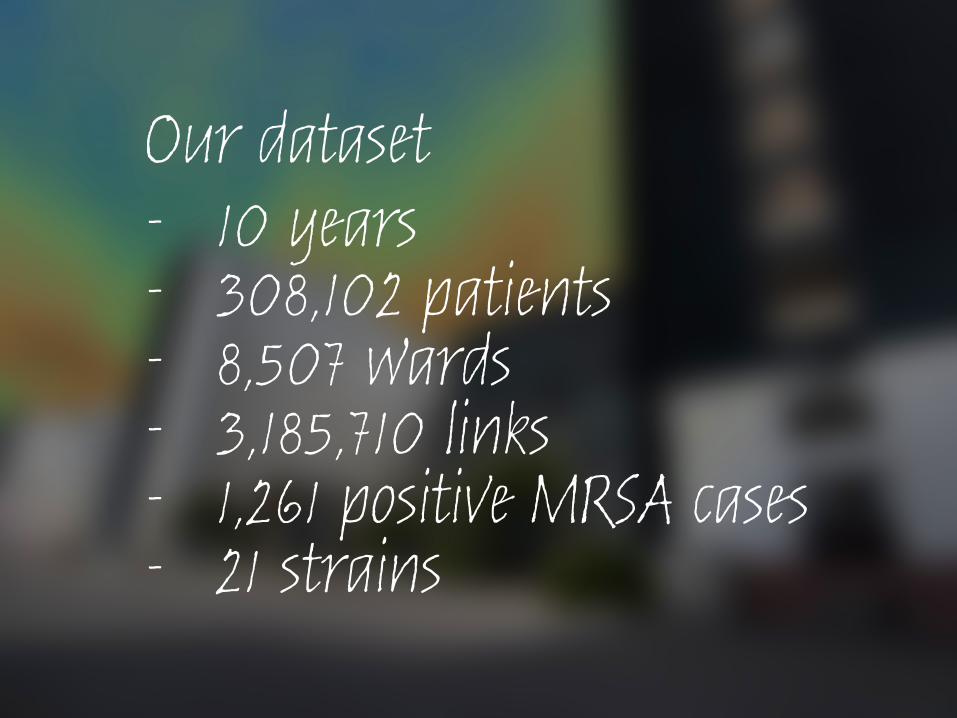
Summary - Even though the hospital system is
hierarchically organized, the ward network is too random to predict risk wards efficiently.
- In-flow better predictor than static measures.
- There is a detectable response—patients move to low-degree wards.


![MRSA in Niedersachsen€¦ · ha-MRSA [2]. 3. Livestock-assoziierte MRSA (la-MRSA) bezeichnen solche MRSA, die auch bei kommerziell gehaltenen Nutztieren nach-gewiesen werden können](https://img.pdfslide.net/doc/110x75/603152e40c958d0d35571973/mrsa-in-niedersachsen-ha-mrsa-2-3-livestock-assoziierte-mrsa-la-mrsa-bezeichnen.jpg)