Embed Size (px)
Citation preview

01 02 03 04 05
Across Health is pleased to present you with the state of the multichannel landscape in life sciences in Europe, US and emerging markets – for the sixth year already. Find out whether multichannel has reached its full potential in life sciences or not… yet! Click for preface by CEO Fonny Schenck
KEY SURVEY STATISTICS
EXECUTIVE SUMMARY
ADOPTION OF MULTICHANNEL
KEY CHALLENGES
FUTURE OF DIGITAL LIFE SCIENCES

01 02 03 04 05
10/06/14 Across Health Multichannel Barometer 2014 2
302 LIFE SCIENCES LEADERS COMPLETED THE BAROMETER, MAKING IT THE LARGEST OF ITS KIND.
WHAT ARE THE KEY DYNAMICS? SATISFACTION, CHANNEL USE, HURDLES AND BUDGET TRENDS.
BUDGETS PLATEAU AT A LOW LEVEL; MIX OPTIMIZATION AND CUSTOMER ANALYTICS REMAIN AN ISSUE.
LEGAL-REGULATORY ISSUES REMAIN THE KEY HURDLE, BUT ROI AND LACK OF KNOWLEDGE MOVE UP.
MOBILE & CROSS-CHANNEL ON THE INCREASE… SEVERAL HIGH-IMPACT CHANNELS REMAIN UNDERUSED.
Preface Last year, we saw satisfaction, knowledge and spend levels in multichannel plateauing and suggested that pharma was entering the trough of disillusionment, as defined by Gartner. This hypothesis is confirmed by this year’s results... overall, satisfaction levels are down vs 2013, and the importance of ROI evidence and internal skills is rising. In addition, there is a clear mismatch between what respondents feel is very impactful vs what they do. Most strikingly, digital spend is plateauing vs last year, from 16 to 15.6% of marketing spend... while other industries are already over 20% and intend to up that by 10% or more in 2014. Setting up the right organization (companywide strategy, processes & technology, organization...), focusing on the right set of multichannel tactics, rolling them out at scale and measuring for performance are key steps to move beyond the trough of disillusionment. We are seeing an increasing focus on such strategic efforts – maybe 2015 will be the first year of the “plateau of productivity” ... and 2014 the last year of the long fuse?
Fonny Schenck Managing Partner, Across Group CEO, Across Health
KEY SURVEY
STATISTICS EXECUTIVE SUMMARY
ADOPTION OF MULTICHANNEL
KEY CHALLENGES
FUTURE OF DIGITAL
2011 2012 2013 2014
2015?
The long fuse?

01
10/06/14 Across Health Multichannel Barometer 2014 3
Key survey statistics
302 RESPONDENTS FROM 100 LIFE SCIENCE COMPANIES COMPLETED
THE ONLINE SURVEY BETWEEN FEB. 25 AND
APRIL 3, 2014
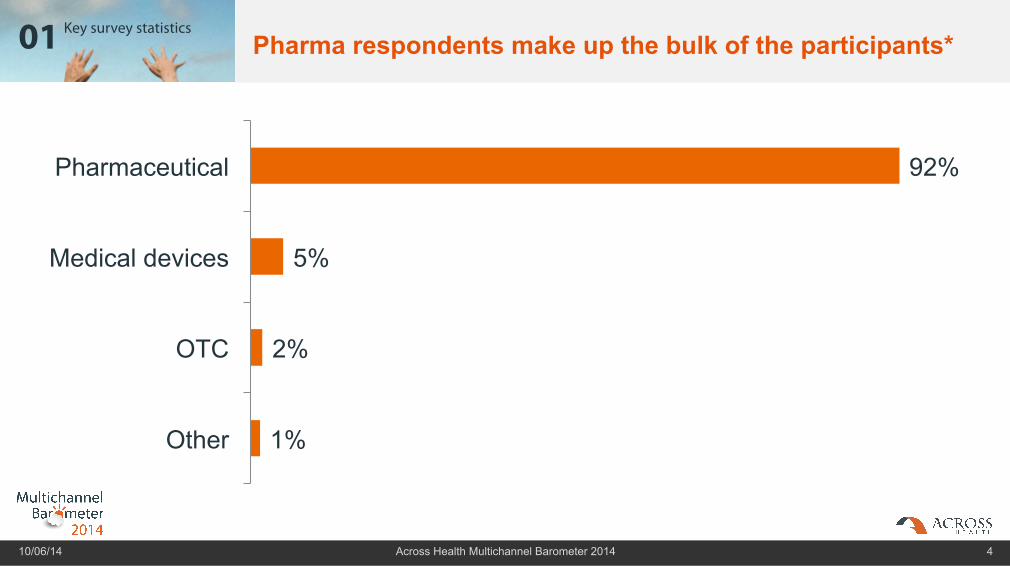
PHARMA RESPONDENTS MAKE UP THE BULK
GLOBAL SPREAD, BUT MOST RESPONDENTS FROM EUROPE
ONE THIRD HAVE INTERNATIONAL ROLE
MOST FUNCTIONS IN MARKETING & DIGITAL
01 Key survey statistics
1%
2%
5%
92%
Other
OTC
Medical devices
Pharmaceutical
Pharma respondents make up the bulk of the participants*
10/06/14 Across Health Multichannel Barometer 2014 4
KEY STATISTICS

01 Key survey statistics
4%
5%
6%
8%
9%
68%
Other
Japan
China
Latin-America
US
Europe
Most respondents come from the European region*
10/06/14 Across Health Multichannel Barometer 2014 5
KEY STATISTICS
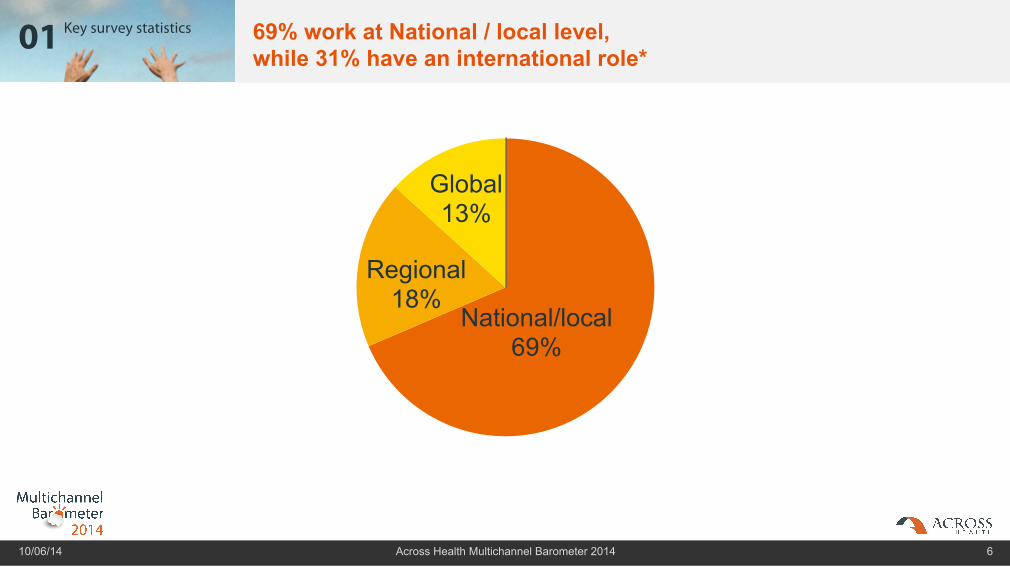
01 Key survey statistics 69% work at National / local level, while 31% have an international role*
10/06/14 Across Health Multichannel Barometer 2014 6
KEY STATISTICS
National/local 69%
Regional 18%
Global 13%

01 Key survey statistics Functional Spread
10/06/14 Across Health Multichannel Barometer 2014 7
KEY STATISTICS
7%
2%
3%
5%
6%
11%
21%
44%
Other
IT
Marketing Research
Medical
CRM
Sales
Digital
Marketing

02
LEGAL-REGULATORY ISSUES REMAIN THE TOP HURDLE, ROI &
LACK OF KNOWLEDGE RISING FAST
WEBSITES ARE MOST POPULAR TACTIC,
CROSS-CHANNEL AND MOBILE RISING FAST
SATISFACTION LEVELS REMAIN BELOW 20%
MULTICHANNEL BUDGETS HAVE
PLATEAUED
10/06/14 Across Health Multichannel Barometer 2014 8
Executive summary
02
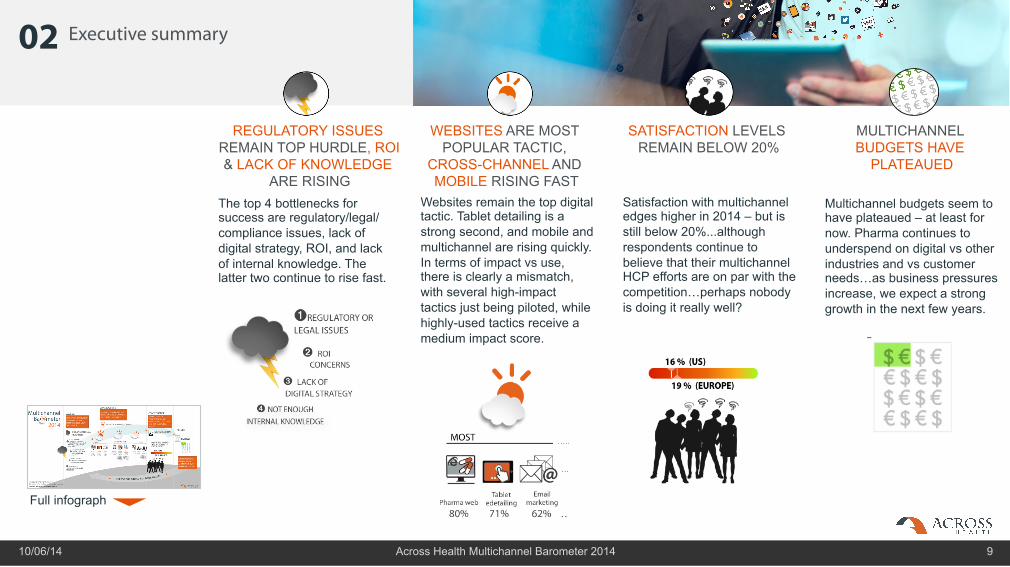
Websites remain the top digital tactic. Tablet detailing is a strong second, and mobile and multichannel are rising quickly. In terms of impact vs use, there is clearly a mismatch, with several high-impact tactics just being piloted, while highly-used tactics receive a medium impact score.
Executive summary
REGULATORY ISSUES REMAIN TOP HURDLE, ROI & LACK OF KNOWLEDGE
ARE RISING
WEBSITES ARE MOST POPULAR TACTIC,
CROSS-CHANNEL AND MOBILE RISING FAST
SATISFACTION LEVELS REMAIN BELOW 20%
MULTICHANNEL BUDGETS HAVE
PLATEAUED
The top 4 bottlenecks for success are regulatory/legal/compliance issues, lack of digital strategy, ROI, and lack of internal knowledge. The latter two continue to rise fast.
Multichannel budgets seem to have plateaued – at least for now. Pharma continues to underspend on digital vs other industries and vs customer needs…as business pressures increase, we expect a strong growth in the next few years.
Satisfaction with multichannel edges higher in 2014 – but is still below 20%...although respondents continue to believe that their multichannel HCP efforts are on par with the competition…perhaps nobody is doing it really well?
10/06/14 Across Health Multichannel Barometer 2014 9
Full infograph

02 Executive summary
10/06/14 Across Health Multichannel Barometer 2014 10
03
DO WE STILL HAVE INSUFFICIENT
KNOWLEDGE & SKILLS IN DIGITAL?
IN THE MIX: WHAT IS HOT?
& WHAT IS NOT?
WE CAN’T GET NO SATISFACTION?
10/06/14 Across Health Multichannel Barometer 2014 11
Current adoption of multichannel

03 Current adoption of multichannel
STRATEGY, PEOPLE, SKILLS: ROOM FOR IMPROVEMENT!
SEVERAL HIGH-IMPACT CHANNELS ARE
UNDERUSED
RESPONDENTS DO NOT FEEL VERY CONFIDENT
• Around 60% of respondents has a multichannel brand/company strategy in place, but only around 25% of those consider it well executed (ie, 15% of all respondents)…
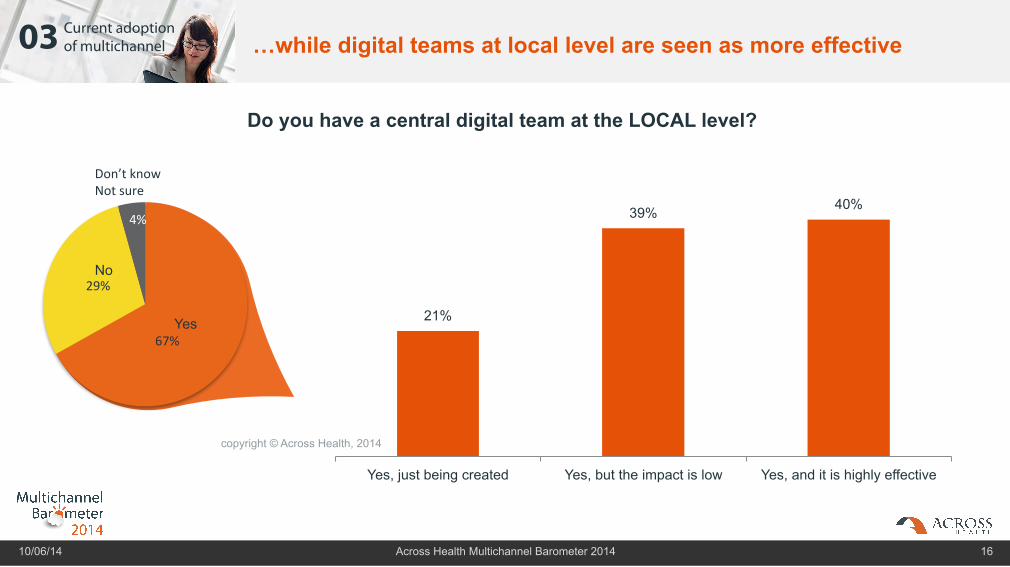
• More than 60% have a local and/or international team in place; but less than 50% of those feel it is very effective – local teams score significantly better than international ones
• Multichannel skill sets continue to be low – and are even lower vs 2009 (45% vs 37% with at least sufficient knowledge)
• Confidence in reaching patients & payers is even lower, and for patients too, confidence levels are dropping (Europe)... this correlates well with the limited use of high-impact patient channels (adherence, monitoring)
• As last year, multichannel initiatives targeted at HCPs are considered more competitive vs other customer groups....but only 24% feels this way...and in Europe, confidence is dropping. As in most other overviews, emerging markets score higher, but that may be due to the earlier stage of adoption (“hype” phase)
• Pilot focus continues to be on cross-channel & mobile mkt, while also patient adherence is rising through the ranks
• There is also limited use of third-party marketing & education opportunities (“fish where the fish are”) – less than 50% have included such channels so far.
• Pharma-owned websites still remain the most popular tactic, followed closely by tablet detailing. Mobile marketing is picking up, along with cross-channel
• Focused patient tactics are just emerging, with patient adherence tools scoring 26% standard use (quantified, self, social media and remote monitoring scoring much lower)
• Interestingly, the most used tactics are not always seen as the most effective… there is only 1 tactic in the high use/impact box, and highly effective tactics like multichannel and patient tools are hardly used.
10/06/14 Across Health Multichannel Barometer 2014 12

03 Current adoption of multichannel
20%
56%
24%
We have one, but its validity is questioned
We have one, but it is not implemented with rigour
We have one, and it is well executed
Most companies have issues with execution of their company-wide digital strategy or have not implemented one at all…
10/06/14 Across Health Multichannel Barometer 2014 13
Do you have a company-wide digital strategy in place (i.e. across all brands & functions)?
copyright © Across Health, 2014
57% 41%
2
No
No need
Yes

03 Current adoption of multichannel
26%
47%
27%
We have one, but its validity is questioned
We have one, but it is not implemented with rigour
We have one, and it is well executed
No
62%
36%
2
…the result is similar for digital brand strategies
10/06/14 Across Health Multichannel Barometer 2014 14
How robust is your digital brand strategy today (i.e. at the brand level – NOT the company level)?
copyright © Across Health, 2014
Don’t have one We have one
No need

03 Current adoption of multichannel
77%
16%
8%
Yes
Don’t know Not sure
No
25%
56%
19%
Yes, just being created Yes, but the impact is low Yes, and it is highly effective
Most organizations have dedicated digital teams at international level but their effectiveness is questioned…
10/06/14 Across Health Multichannel Barometer 2014 15
Do you have a central digital team at the INTERNATIONAL level?
copyright © Across Health, 2014
03 Current adoption of multichannel
21%
39% 40%
Yes, just being created Yes, but the impact is low Yes, and it is highly effective
…while digital teams at local level are seen as more effective
10/06/14 Across Health Multichannel Barometer 2014 16
Do you have a central digital team at the LOCAL level?
copyright © Across Health, 2014
67%
29%
4%
No
Yes
Don’t know Not sure

03 Current adoption of multichannel
The level of internal expertise is dropping again – and arguably has not moved ahead since 2009
10/06/14 Across Health Multichannel Barometer 2014 17
Do you feel that you have sufficient knowledge of all opportunities offered by the internet for your business activities?
KEY CHALLENGES
Note: 2009-2011 data EMEA only
4%
4%
2%
1%
2%
4%
24%
20%
24%
18%
16%
21%
27%
31%
42%
44%
36%
38%
31%
34%
21%
30%
34%
25%
14%
10%
10%
8%
12%
12%
0% 10% 20% 30% 40% 50% 60% 70% 80% 90% 100%
2009
2010
2011
2012
2013
2014
Totally insufficient
Insufficient
Between sufficient and insufficient
Sufficient
More than sufficient (expert)
copyright © Across Health, 2014

03 Current adoption of multichannel
80% 71%
62% 61%
59% 48%
46% 42% 41%
34% 33%
29% 26%
25% 23%
21% 20%
18% 11% 11% 11% 9%
8% 8% 7%
5%
11% 14%
21% 13% 17%
34% 33%
32% 22%
41% 25%
22% 36%
40% 28%
34% 35%
31% 12%
28% 18%
16% 22%
12% 19%
21%
4% 9%
11% 19% 16%
15% 16%
19% 26%
21% 30%
38% 25%
25% 40%
39% 39%
43% 54%
48% 60%
59% 47%
61% 54%
57%
5% 6% 6%
8% 9%
3% 5%
7% 11%
4% 12% 11%
12% 10% 9%
6% 6%
9% 23%
13% 11%
16% 23%
20% 20%
17%
Pharma-owned website* Tablet eDetailing Email marketing Direct marketing
Web Banners Web conference or virtual meeting
Online medical education HCP self-service portal
SEO Mobile marketing
SEA Outbound call centre
Patient adherence tools Integrated cross-channel campaigns
Virtual eDetailing Social media marketing
Social media monitoring eRep
e-sampling e-MSL
Mobile advertising e- or PHR** ad & promo services
Marketing automation software ePrescribing advertising & promo services
Quantified self / self-tracking devices Remote patient monitoring
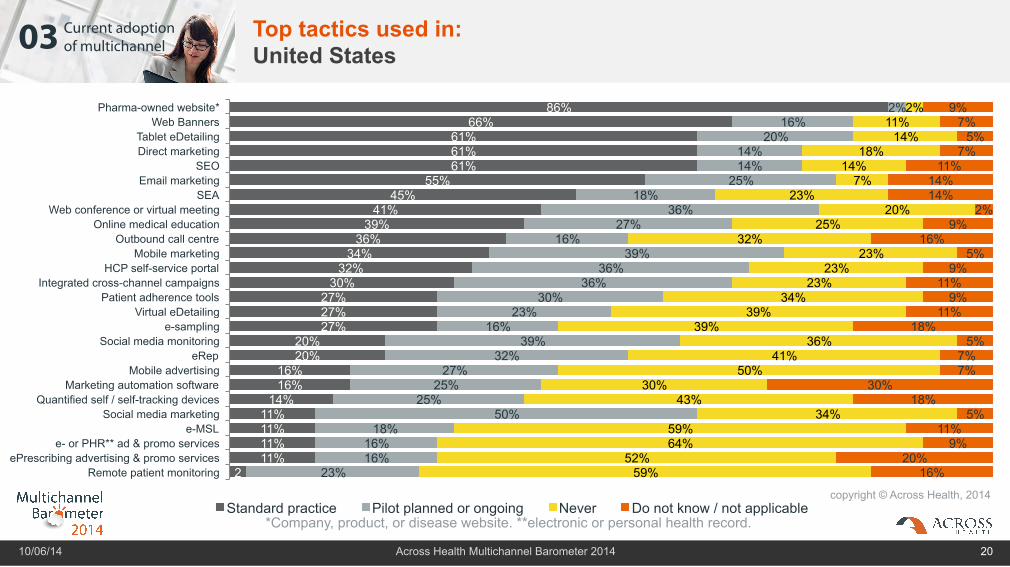
Standard practice Pilot planned or ongoing Never Do not know / not applicable
Websites still remain the most popular tactic, followed closely by tablet detailing. Mobile marketing is picking up, along with cross-channel
10/06/14 Across Health Multichannel Barometer 2014 18
CURRENT ADOPTION *Company, product, or disease website. **electronic or personal health record.
copyright © Across Health, 2014

03 Current adoption of multichannel
80% 72%
63% 60% 59%
48% 48%
43% 41%
35% 33%
30% 25% 25%
22% 22%
21% 17%
11% 11% 10% 9% 8% 8% 8%
6%
11% 13%
21% 12%
17% 34%
33% 32%
23% 41%
26% 20%
41% 38%
34% 28%
36% 31%
29% 18%
16% 11%
20% 12%
20% 21%
4% 9%
10% 20%
15% 14%
14% 19%
25% 20%
30% 39%
23% 24% 39%
41% 38%
43% 47%
59% 59%
55% 47%
60% 52% 56%
5% 6% 5%
8% 9%
3% 5%
6% 11%
4% 12% 11% 10%
13% 5%
9% 6%
9% 13% 12%
16% 25% 24%
20% 20%
17%
Pharma-owned website* Tablet eDetailing Email marketing Direct marketing
Web Banners Web conference or virtual meeting
Online medical education HCP self-service portal
SEO Mobile marketing
SEA Outbound call centre
Integrated cross-channel campaigns Patient adherence tools Social media marketing
Virtual eDetailing Social media monitoring
eRep e-MSL
Mobile advertising e- or PHR** ad & promo services
e-sampling Marketing automation software
ePrescribing advertising & promo services Quantified self / self-tracking devices
Remote patient monitoring
Standard practice Pilot planned or ongoing Never Do not know / not applicable
Top tactics used in: Europe
10/06/14 Across Health Multichannel Barometer 2014 19
*Company, product, or disease website. **electronic or personal health record.
copyright © Across Health, 2014
03 Current adoption of multichannel
Top tactics used in: United States
10/06/14 Across Health Multichannel Barometer 2014 20
CURRENT ADOPTION
86% 66%
61% 61% 61%
55% 45%
41% 39%
36% 34%
32% 30%
27% 27% 27%
20% 20%
16% 16%
14% 11% 11% 11% 11%
2
2% 16%
20% 14% 14%
25% 18%
36% 27%
16% 39%
36% 36%
30% 23%
16% 39%
32% 27%
25% 25%
50% 18%
16% 16%
23%
2% 11%
14% 18%
14% 7%
23% 20%
25% 32%
23% 23%
23% 34%
39% 39%
36% 41%
50% 30%
43% 34%
59% 64%
52% 59%
9% 7%
5% 7%
11% 14% 14%
2% 9%
16% 5%
9% 11%
9% 11%
18% 5%
7% 7%
30% 18%
5% 11%
9% 20%
16%
Pharma-owned website* Web Banners
Tablet eDetailing Direct marketing
SEO Email marketing
SEA Web conference or virtual meeting
Online medical education Outbound call centre
Mobile marketing HCP self-service portal
Integrated cross-channel campaigns Patient adherence tools
Virtual eDetailing e-sampling
Social media monitoring eRep
Mobile advertising Marketing automation software
Quantified self / self-tracking devices Social media marketing
e-MSL e- or PHR** ad & promo services
ePrescribing advertising & promo services Remote patient monitoring
Standard practice Pilot planned or ongoing Never Do not know / not applicable *Company, product, or disease website. **electronic or personal health record.
copyright © Across Health, 2014

03 Current adoption of multichannel
82% 71% 71%
59% 59%
53% 47% 47%
41% 29% 29% 29% 29% 29%
24% 18% 18% 18%
12% 6% 6% 6% 6%
6% 24%
12% 29% 29%
18% 41%
29% 47%
47% 41%
35% 35%
29% 41%
71% 18%
6% 24%
24% 24%
12% 12%
18% 18%
12%
6% 6%
18% 12% 12%
24% 12%
18% 12%
18% 18% 29%
24% 35%
29% 6%
53% 65%
59% 59% 59%
65% 59%
65% 53%
71%
6%
6%
6%
6% 12%
6% 12%
6% 6% 6%
12% 12%
6% 12% 12%
18% 24%
18% 29%
18%
Pharma-owned website* Tablet eDetailing
Web Banners Web conference or virtual meeting
Email marketing Direct marketing
HCP self-service portal SEO
Online medical education Integrated cross-channel campaigns
SEA Outbound call centre
Patient adherence tools Virtual eDetailing
Social media monitoring Mobile marketing
Social media marketing Mobile advertising
eRep Marketing automation software
e-MSL ePrescribing advertising & promo services
e- or PHR** ad & promo services Quantified self / self-tracking devices
e-sampling Remote patient monitoring
Standard practice Pilot planned or ongoing Never Do not know / not applicable
Top tactics used in: Emerging countries
10/06/14 Across Health Multichannel Barometer 2014 21
CURRENT ADOPTION
*Company, product, or disease website. **electronic or personal health record.
copyright © Across Health, 2014
Emerging: Brazil, China, Colombia, Hungary, Mexico, Poland, Russian Federation, South Africa, Turkey, Uruguay
03 Current adoption of multichannel
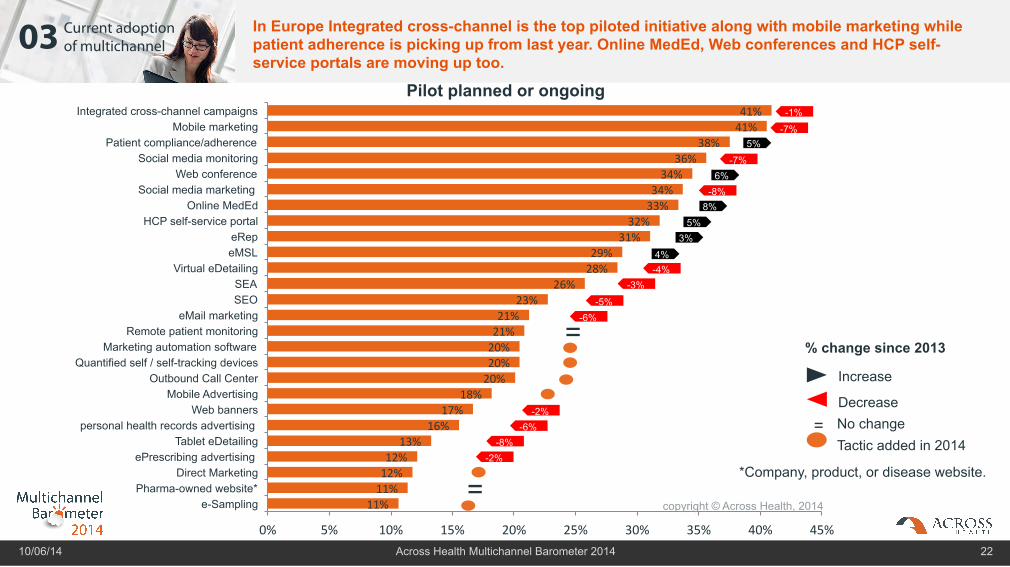
11% 11% 12% 12%
13% 16%
17% 18%
20% 20% 20% 21% 21%
23% 26%
28% 29%
31% 32%
33% 34% 34%
36% 38%
41% 41%
0% 5% 10% 15% 20% 25% 30% 35% 40% 45%
e-Sampling Pharma-owned website*
Direct Marketing ePrescribing advertising
Tablet eDetailing personal health records advertising
Web banners Mobile Advertising
Outbound Call Center Quantified self / self-tracking devices
Marketing automation software Remote patient monitoring
eMail marketing SEO SEA
Virtual eDetailing eMSL eRep
HCP self-service portal Online MedEd
Social media marketing Web conference
Social media monitoring Patient compliance/adherence
Mobile marketing Integrated cross-channel campaigns
In Europe Integrated cross-channel is the top piloted initiative along with mobile marketing while patient adherence is picking up from last year. Online MedEd, Web conferences and HCP self-service portals are moving up too.
10/06/14 Across Health Multichannel Barometer 2014 22
Pilot planned or ongoing
*Company, product, or disease website.
copyright © Across Health, 2014
5%
-1%
-7%
-7% 6%
-8% 8%
5% 3%
-4% 4%
-3%
-5% -6%
= % change since 2013
Increase
Decrease No change = Tactic added in 2014
-2% -6%
-8% -2%
=

03 Current adoption of multichannel
27%
25%
21%
14%
16%
48%
47%
48%
27%
30%
25%
25%
27%
49%
44%
3
4
9%
9%
EPG
Mdlinx
Docguide
Medscape
Elsevier
Poor Neutral Good Excellent
Third-party offerings are less often used. Medscape and Elsevier are leading the pack.
10/06/14 Across Health Multichannel Barometer 2014 23
How would you rate the value for money of the following third-party digital channels to communicate
with your physicians?
copyright © Across Health, 2014 78%
75%
72%
49%
48%
22%
25%
28%
51%
52%
Never used it Used it
Have you worked with these third parties?

03 Current adoption of multichannel
Integrated cross-channel campaigns score the highest impact in all regions along with e-MSL and patient adherence tools yet they are all under utilized by pharma
10/06/14 Across Health Multichannel Barometer 2014 24
Impact scale from 0 (not impactful) to 10 (very impactful) *Company, product, or disease website. **electronic or personal health record.
*** Weighted Impact score based on results from previous question “How impactful do you feel these channels are?” **** Adoption is based on % of respondents who answered (Standard practice) to “How often do you use the following
multichannel Marketing tools TODAY?”
• Integrated cross-channel campaigns • Patient adherence tools • e-MSL • Remote patient monitoring
• Web conf/virtual meeting • Online MedEd • SEO
• HCP self-service portal • Mobile MKT • SEA
Adoption****
Perc
eive
d im
pact
***
10
0 0% 100% copyright © Across Health, 2014
• Tablet eDetailing
• Pharma-owned website* • Email MKT
• Web Banners • Direct MKT
4
• e/PHR** promotion
• e-sampling • MKT automation • ePrescribing
promo • Quantified self
• Call centre • Social media MKT • Virtual eDetailing • SM monitoring • eRep • Mobile Ad
6
30% 60%
Global

03 Current adoption of multichannel
Respondents are most confident in use of multichannel initiatives towards HCPs and least towards payors…
10/06/14 Across Health Multichannel Barometer 2014 25
How would you rank your company versus your competitors in using digital initiatives targeted at stakeholders?
copyright © Across Health, 2014
35%
53%
64%
41%
32%
28%
24%
15%
8%
0% 10% 20% 30% 40% 50% 60% 70% 80% 90% 100%
HCPs
Consumers/patients
Payors
Behind
Equal
Ahead

03 Current adoption of multichannel
2%
11%
0%
8% 7%
12%
25%
34%
18%
41%
32%
24% 21%
14%
41%
3% 2% 6%
Europe US Emerging
No opinion Far behind Behind Average Ahead Far ahead
…with the emerging markets showing most confidence
10/06/14 Across Health Multichannel Barometer 2014 26
How would you rank your company versus your competitors in using digital initiatives targeted at healthcare professionals?
HCPs
Emerging: Brazil, China, Colombia, Hungary, Mexico, Poland, Russian Federation, South Africa, Turkey, Uruguay
24%
47%
16%
copyright © Across Health, 2014

03 Current adoption of multichannel
0%
10%
20%
30%
40%
50%
60%
70%
2009 2010 2011 2012 2013 2014
Behind Equal Ahead
HCPs
…while a drop in confidence occurred in Europe vs. 2013
10/06/14 Across Health Multichannel Barometer 2014 27
CURRENT ADOPTION
How would you rank your company versus your competitors in using digital initiatives targeted at healthcare professionals?
copyright © Across Health, 2014

03 Current adoption of multichannel
3%
9% 12%
17%
9%
18%
34%
27% 29%
32%
36%
18%
11% 11%
18%
3%
7% 6%
Europe US Emerging
No opinion Far behind Behind Average Ahead Far ahead
Emerging markets also declare the greatest confidence in initiatives towards consumers/patients
10/06/14 Across Health Multichannel Barometer 2014 28
How would you rank your company versus your competitors in using digital initiatives targeted at consumers/patients?
14% 18%
CURRENT ADOPTION
Consumers/patients
24%
copyright © Across Health, 2014
Emerging: Brazil, China, Colombia, Hungary, Mexico, Poland, Russian Federation, South Africa, Turkey, Uruguay

03 Current adoption of multichannel
3%
12%
24%
44%
17%
1%
0 1 2 3 4 5
Overall, only 18% are satisfied with their current digital activities
10/06/14 Across Health Multichannel Barometer 2014 29
Extremely Satisfied
Extremely Dissatisfied
18%
CURRENT ADOPTION
On a scale from 0 to 5, how satisfied are you with your current digital activities?
copyright © Across Health, 2014

03 Current adoption of multichannel
38%
43%
29%
44%
41%
47%
19%
16%
24%
Europe
US
Emerging
Dissatisfied Neutral Satisfied
As last year, satisfaction rates were highest in emerging markets and lowest in US…
10/06/14 Across Health Multichannel Barometer 2014 30
CURRENT ADOPTION
On a scale from 0 to 5, how satisfied are you with your current digital activities?
copyright © Across Health, 2014
Emerging: Brazil, China, Colombia, Hungary, Mexico, Poland, Russian Federation, South Africa, Turkey, Uruguay

03 Current adoption of multichannel
0%
10%
20%
30%
40%
50%
60%
2009 2010 2011 2012 2013 2014
Dissatisfied Neutral Satisfied
…in Europe, satisfaction rates edged up slightly (but still less than 20%!!)
10/06/14 Across Health Multichannel Barometer 2014 31
On a scale from 0 to 5, how satisfied are you with your current digital activities?
copyright © Across Health, 2014
04
What are the key challenges in applying multichannel?
10/06/14 Across Health Multichannel Barometer 2014 32
KEY HURDLES ROI KNOWLEDGE

04 Key challenges
10/06/14 Across Health Multichannel Barometer 2014 33
KEY HURDLES ROI KNOWLEDGE
• As last year, regulatory, legal, and compliance issues, ROI, and lack of digital strategy remain the main challenges globally.
• In emerging markets, regulatory, legal, and compliance issues are by far the main concern (as opposed to ROI last year). In Europe, ROI issues are almost as important as regulatory concerns and in the US, the most advanced multichannel market, ROI has taken the top spot.
• Overall, ROI concerns and lack of internal knowledge have increased the most since 2010. Interestingly, also lack of management support is going up (perhaps they have been disappointed by the business impact of the current programs)
• Interestingly, only about 33% of respondents feel they have a poor understanding of ROI...so the framework is there...but the results are underwhelming?

04 Key challenges
3%
4%
4%
10%
12%
12%
18%
28%
31%
36%
42%
N/A
Other
No expert agencies with pharma background available
Customers are not ready
No budget
No headcount to support this
No senior management support
Not enough internal knowledge
No clear digital strategy
ROI questions
Regulatory / legal / healthcare compliance issues
Regulatory, legal and compliance issues remain the top bottlenecks, followed by ROI questions and unclear multichannel strategy
10/06/14 Across Health Multichannel Barometer 2014 34
KEY CHALLENGES
% of respondents indicating options as one of the top two main bottlenecks for digital in their organization.
copyright © Across Health, 2014

04 Key challenges
0%
10%
20%
30%
40%
50%
60%
70%
Regulatory / legal / healthcare compliance
issues
ROI questions No clear digital strategy Not enough internal knowledge
No senior management support
Europe
US
Emerging
Regulatory, legal and compliance issues are the largest bottlenecks in emerging countries and Europe, while US is mostly challenged by ROI questions
10/06/14 Across Health Multichannel Barometer 2014 35
KEY CHALLENGES
% of respondents indicating options as one of the top two main bottlenecks for digital in their organization. copyright © Across Health, 2014
Emerging: Brazil, China, Colombia, Hungary, Mexico, Poland, Russian Federation, South Africa, Turkey, Uruguay

04 Key challenges
6%
14%
16%
19%
28%
40%
51%
52%
61%
No expert agencies with pharma background available
Customers are not ready
No budget
No headcount to support this
No senior management support
Not enough internal knowledge in this area
No clear eBusiness strategy
ROI questions
Regulatory or legal issues
In Europe, ROI questions, lack of strategy and internal knowledge are rising in importance vs 2010…and even lack of senior support is on the increase.
10/06/14 Across Health Multichannel Barometer 2014 36
KEY CHALLENGES
% of respondents indicating main bottlenecks for digital in their organization.
* 2013 and 2014 data has been adjusted for comparability to previous years
copyright © Across Health, 2014
% change since 2010
High increase Low increase Decrease
-2%
5%
1%
-2%
10%
15%
6%
11%
4%

04 Key challenges
5%
28%
31%
23%
13%
4%
30% 28% 29%
9%
Very poor Poor OK Well Very well
2013 2014
More than 1/3 of all respondents state that they do not have sufficient understanding of ROI from their digital channels….
10/06/14 Across Health Multichannel Barometer 2014 37
How well do you understand the ROI from digital channels?
copyright © Across Health, 2014
34%

04 Key challenges
4% 7%
30% 32%
29% 28%
25%
41%
29% 30%
12%
8% 7%
18%
Europe US Emerging
Very poor
Poor
OK
Well
Very well
US and Europe feel they have an OK understanding of ROI; Emerging markets are behind
10/06/14 Across Health Multichannel Barometer 2014 38
How well do you understand the ROI from digital channels?
copyright © Across Health, 2014
Emerging: Brazil, China, Colombia, Hungary, Mexico, Poland, Russian Federation, South Africa, Turkey, Uruguay

05
10/06/14 Across Health Multichannel Barometer 2014 39
BUDGET CHANNEL MIX & CUSTOMER
INTELLIGENCE
What holds the future for digital in life sciences?

05 The future of digital in life sciences
10/06/14 Across Health Multichannel Barometer 2014 40
BUDGET
CHANNEL MIX & CUSTOMER
INTELLIGENCE
In view of the weak results on key parameters like strategic and organizational excellence, skill level, use of high-impact channels and overall satisfaction level, it should not come as a surprise that the investment in multichannel has plateaued vs last year – at a much earlier point than other industries.
Little progress is also being made on these 2 key areas
• Channel mix: For 9 out of 10 respondents, defining the optimal channel mix is not a simple task
• Customer intelligence: More than 4 of 5 respondents have not implemented a robust framework to leverage customer data for closed-loop marketing yet
05 The future of digital in life sciences
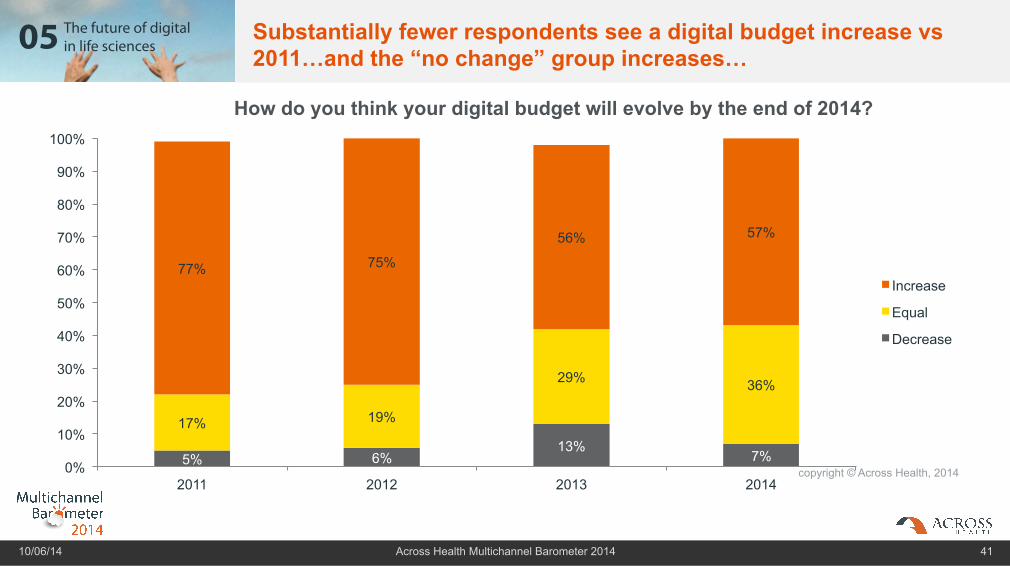
5% 6% 13%
7%
17% 19%
29% 36%
77% 75%
56% 57%
0%
10%
20%
30%
40%
50%
60%
70%
80%
90%
100%
2011 2012 2013 2014
Increase
Equal
Decrease
Substantially fewer respondents see a digital budget increase vs 2011…and the “no change” group increases…
10/06/14 Across Health Multichannel Barometer 2014 41
How do you think your digital budget will evolve by the end of 2014?
copyright © Across Health, 2014

05 The future of digital in life sciences
9%
24%
19%
41%
16%
38%
17% 16% 19%
13%
20% 19%
12%
16%
6% 8% 8%
Europe US Emerging
less than 5% 5% to 10% 11% to 15% 16% to 20% 21% to 25% more than 25%
Average multichannel marketing budgets tend to be higher in the US and Europe than in emerging markets
10/06/14 Across Health Multichannel Barometer 2014 42
If you oversee a marketing budget, which percentage of it is allocated to digital initiatives THIS YEAR?
Average 10.9%
Average 15.8%
Average 15.6%
copyright © Across Health, 2014
Emerging: Brazil, China, Colombia, Hungary, Mexico, Poland, Russian Federation, South Africa, Turkey, Uruguay

05 The future of digital in life sciences
For the first time since 2010 in Europe, the average percentage allocated to digital marketing has plateaued – the average does not deviate a lot from 2012 figures…
10/06/14 Across Health Multichannel Barometer 2014 43
If you oversee a marketing budget, which percentage of it is allocated to digital initiatives THIS YEAR?
copyright © Across Health, 2014 0%
2%
4%
6%
8%
10%
12%
14%
16%
18%
2010 2011 2012 2013 2014
Average 5%
Average 8%
Average 15%
Average 16%
Δ +6% Δ -2.6%
Average 15.6%

05 The future of digital in life sciences
36% 36%
7%
14%
7%
If you oversee a MEDICAL* budget, which percentage of it is allocated to digital initiatives THIS YEAR?
46%
38%
8% 8%
less than 5%
5% to 10%
11% to 15%
16% to 20%
21% to 25%
more than 25%
Despite limited data, we can see an even lower average budget allocation to digital within sales and medical departments
10/06/14 Across Health Multichannel Barometer 2014 44
If you oversee a SALES* budget, which percentage of it is allocated to digital initiatives THIS YEAR?
Average
8.1% Average
6.2%
copyright © Across Health, 2014
*Limited data collected
copyright © Across Health, 2014

05 The future of digital in life sciences
2%
32%
51%
11% 4%
We do not see the need for collecting or using customer
data
We are not collecting useful customer data yet, but we
should
We have started doing some analysis on our multichannel
customer data
We have already implemented some robust
customer analytics frameworks
We leverage this data consistently
With little change from last year, more than 4 of 5 respondents have not implemented a robust framework to leverage customer data for closed-loop marketing yet
10/06/14 Across Health Multichannel Barometer 2014 45
Do you leverage customer data from your cross-channel initiatives for advanced customer analytics and closed-loop marketing?
15%
copyright © Across Health, 2014
% change since 2013
Increase Decrease
2%
-2%
-2%
3% -2%

05 The future of digital in life sciences
2% 2%
32% 27%
12%
52% 52% 59%
11% 14% 12% 4% 5%
18%
Europe US Emerging
We do not see the need for collecting or using customer data
We are not collecting useful customer data yet, but we should
We have started doing some analysis on our multichannel customer data
We have already implemented some robust customer analytics frameworks
We leverage this data consistently
The same can be observed in US while emerging countries show more focus at 30%
10/06/14 Across Health Multichannel Barometer 2014 46
Do you leverage customer data from your cross-channel initiatives for advanced customer analytics and closed-loop marketing?
copyright © Across Health, 2014
Emerging: Brazil, China, Colombia, Hungary, Mexico, Poland, Russian Federation, South Africa, Turkey, Uruguay

05 The future of digital in life sciences
24%
51%
16%
7% 2%
Very complicated Somewhat complicated Neither complicated nor simple
Relatively simple Very simple
For 9 out of 10 respondents, defining the optimal channel mix is not a simple task
10/06/14 Across Health Multichannel Barometer 2014 47
How complex is it to define the optimal channel mix*?
9%
*Allocating the right amount of budget to digital versus offline channels. copyright © Across Health, 2014
5%
-1%
1%
-6%
Emerging: Brazil, China, Colombia, Hungary, Mexico, Poland, Russian Federation, South Africa, Turkey, Uruguay
% change since 2013
Increase Decrease No change =
=

01 02 03 04 05
Final thoughts 2014… the long fuse? Digital will have a major impact on the outlook of healthcare, with empowered patients/caregivers, real-time clinical trials, the rise of the EHR & PHR 2.0, tight patient-physician connectivity and sophisticated payor programmes to name but a few key trends. Yet healthcare has traditionally been a slow adopter of new technologies at scale, which also reduces the business pressures on pharma to take the leap of faith. In life sciences, multichannel is very much evolutionary, rather than revolutionary. The comparison with the long fuse is therefore quite adequate…it may still take a while before the healthcare market “explodes”, but it is high time to start preparing for this transformational event and to jockey for position. As Marissa Meyer (Yahoo) puts it: Don't look for the "right" answer. There's a lot of good choices and then there's the one you pick, commit to, and make great.”… We hope we have given you some handles to improve your multichannel programme and wish you continued success in your journey!
Fonny Schenck Managing Partner, Across Group CEO, Across Health
LOREM IPSUM DOLOR SIT AMET, CONSECTETUR ADIPISCING ELIT. IN NIBH TELLUS, FRINGILLA AT
LOREM IPSUM DOLOR SIT AMET, CONSECTETUR ADIPISCING ELIT. IN NIBH TELLUS, FRINGILLA AT
LOREM IPSUM DOLOR SIT AMET, CONSECTETUR ADIPISCING ELIT. IN NIBH TELLUS, FRINGILLA AT
LOREM IPSUM DOLOR SIT AMET, CONSECTETUR ADIPISCING ELIT. IN NIBH TELLUS, FRINGILLA AT
LOREM IPSUM DOLOR SIT AMET, CONSECTETUR ADIPISCING ELIT. IN NIBH TELLUS, FRINGILLA AT
KEY SURVEY STATISTICS
EXECUTIVE SUMMARY
ADOPTION OF MULTICHANNEL
KEY CHALLENGES
FUTURE OF MULTICHANNEL
10/06/14 Across Health Multichannel Barometer 2014 48
2011 2012 2013 2014
2015?
“Chance favours the prepared mind”
Find us at
a-cross.com/health