Embed Size (px)
Citation preview
Challenges in the new market place10th International Pharmaceutical Compliance Congress and Best Practices Forum
Frank Wartenberg
President Central Europe
IMS HEALTH GmbH & Co. OHG

22 © 2016, IMS HEALTH – Dr. Frank Wartenberg (Twitter: @FrankWartenberg)
Global growth is now on an exceptional level –
forecast suggests that it will not be sustained
Source: IMS Market Prognosis Oct 2015; (*) at ex-manufacturer price levels, not including rebates and discounts. Contains Audited + Unaudited data. $US used for Argentina, Venezuela, Nigeria & Ukraine due to hyperinflation
Developed Markets
CAGR 2016-2020
US 6%-9%
Japan (-1)%-2%
Germany 3%-6%
UK* 4%-7%
Italy 2%-5%
France (-2)%-1%
Spain 2%-5%
Canada 3%-6%
Developed 4%-7%
Pharmerging Markets
CAGR 2016-20 LCUS$
China 5%-8%
Brazil 7%-10%
India 10%-13%
Russia 6%-9%
Turkey 12%-15%
Mexico 2%-5%
Pharmerging
LCUS$6%-9%
Pharmerging
US$4%-7%
Global Sales and Market Growth
At par with region CAGR
Lower than region CAGR
Higher than region CAGR*Subject to clawback
0%
2%
4%
6%
8%
10%
12%
0
200
400
600
800
1.000
1.200
1.400
1.600
2015 2016 2017 2018 2019 2020G
row
th
Sa
les
(B
n L
CU
S$
)
Global sales Developed growth Pharmerging growth

33 © 2016, IMS HEALTH – Dr. Frank Wartenberg (Twitter: @FrankWartenberg)
Specialty medicines drive growth in developed
regions; globally, primary care dominates
Specialty share of growth
Traditional share of growth World
$223-253Bn growth
North America
$90-100Bn growth Asia
$75-105Bn growth
AFME
$14-24Bn growthLatin America
$9-19Bn growth
Europe
$13-23Bn growth
27%73% 100%
79%
21%
93%
7%91%
9%
52%48%
Source: IMS Health Market Prognosis, April 2015; IMS Institute for Healthcare Informatics, May 2015

44
2010 2011 2012 2013 2014 2015
1 LIPITOR HUMIRA HUMIRA HUMIRA HUMIRA HUMIRA
2 SERETIDE SERETIDE SERETIDE ENBREL ENBREL HARVONI
3 HUMIRA LIPITOR ENBREL SERETIDE HERCEPTIN SOVALDI
4 ENBREL ENBREL HERCEPTIN HERCEPTIN SERETIDE ENBREL
5 HERCEPTIN HERCEPTIN MABTHERA REMICADE REMICADE HERCEPTIN
6 AVASTIN LOVENOX REMICADE MABTHERA MABTHERA AVASTIN
7 LOVENOX MABTHERA LOVENOX AVASTIN AVASTIN MABTHERA
8 MABTHERA REMICADE AVASTIN LOVENOX LYRICA REMICADE
9 ZYPREXA AVASTIN SPIRIVA LUCENTIS LOVENOX LOVENOX
10 REMICADE SYMBICORT LYRICA LYRICA SOVALDI SERETIDE
No. Biologics in Top 10
7 7 7 8 7 7
© 2016, IMS HEALTH – Dr. Frank Wartenberg (Twitter: @FrankWartenberg)
Europe illustrates the importance of biologic
therapiesTop 10 Products in Europe 2010-2015
Small molecule Biologica Small molecule specialty product
Source: IMS Health, MIDAS, MAT Q4 2015 . Rx only. Europe excludes Russia and Turkey

55 © 2016, IMS HEALTH – Dr. Frank Wartenberg (Twitter: @FrankWartenberg)
There is a high concentration of spending to
Top 50 products across Europe
60.0%
40.0%
20.0%
0.0%
100.0%
80.0%
UK
$23.6 Mn
49.5%
13.4%
21.3%
15.8%
Spain
$19.6 Mn
51.7%
10.9%
20.6%
16.7%
Italy
12.1%
17.3%
13.5%
Germany
$36.6 Mn
52.3%
12.5%
20.6%
14.6%
France
$28.3 Mn
56.0%
12.3%
20.4%
11.3%
57.0%
$25.2 Mn
Top 10 products Products 11-50 Products 51-100 All others
EU 5 – 2015 Concentration of product sales
0.0%
40.0%
60.0%
80.0%
100.0%
20.0%
$180.9 Mn
2015
59.4%
10.9%
17.8%
12.0%
2010
$185.1 Mn
60.2%
11.0%
18.1%
10.6%
Europe – Concentration of product sales
Source: IMS Health, MIDAS Restricted, MAT Q4 2010-Q4 2015 . Rx only. Europe excludes Russia and Turkey
EU5

66 © 2016, IMS HEALTH – Dr. Frank Wartenberg (Twitter: @FrankWartenberg)
High-cost products like Sovaldi influence
decision-makers in their reimbursement strategy
Confidential discount with some sick
funds prior to the GKV-SpV
negotiation oucome, which is
ground-breaking
German government attempts to set
a revenue threshold for the first
year of free-pricing at €250m
NHS England delayed Sovaldi’s
introduction by 4 months; this is
unprecedented
Agreement to refund the cost of
Sovaldi for any patient not cured;
this type of agreement is not
common in France
MSSSI set population maximum
expenditure caps for each recent
innovative HCV launch
separately (€125m/year for
Sovaldi)
AIFA set up an ad hoc fund of
€750m to treat a maximum of
50.000 patients with Sovaldi in
2015
EU5
77
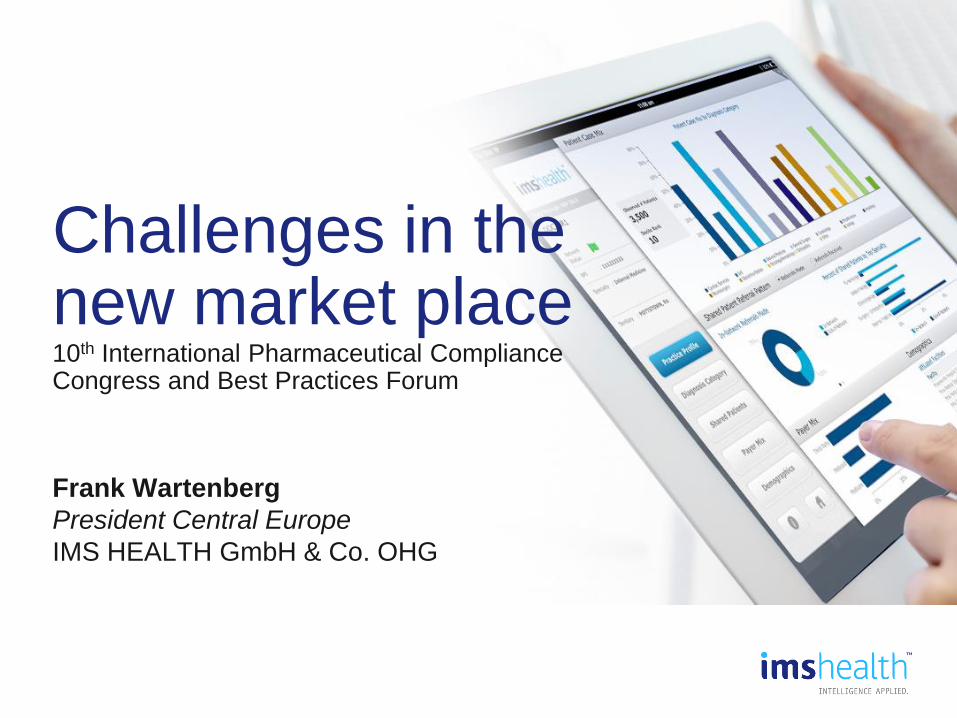
Sovaldi only the first of several potential tsunamis
Are these innovations sustainable?
Source: IMS Health Analytics Link consensus analyst forecast; Drug analyst consensus; IMS Health MIDAS Q4 2015;
20
15
10
5
0
20
20
2018
2016
2014Analy
st
fore
cast
(Bn U
S$)
$18-22 Bn
8
6
4
2
0
20
20
20
18
20
16
20
14A
na
lyst fo
reca
st (B
n U
S$
)
$5-7 Bn
8
6
4
2
0
20
20
20
18
20
16
20
14
$6-8 Bn
Immuno-Oncology Respiratory
biologics
PCSK9 inhibitors?
40
30
20
10
0
20
12H
isto
ric s
ale
s (
Bn U
S$)
20
15
20
14
20
13
Hepatitis-C market
2012-2015
$32 Bn
88 © 2016, IMS HEALTH – Dr. Frank Wartenberg (Twitter: @FrankWartenberg)
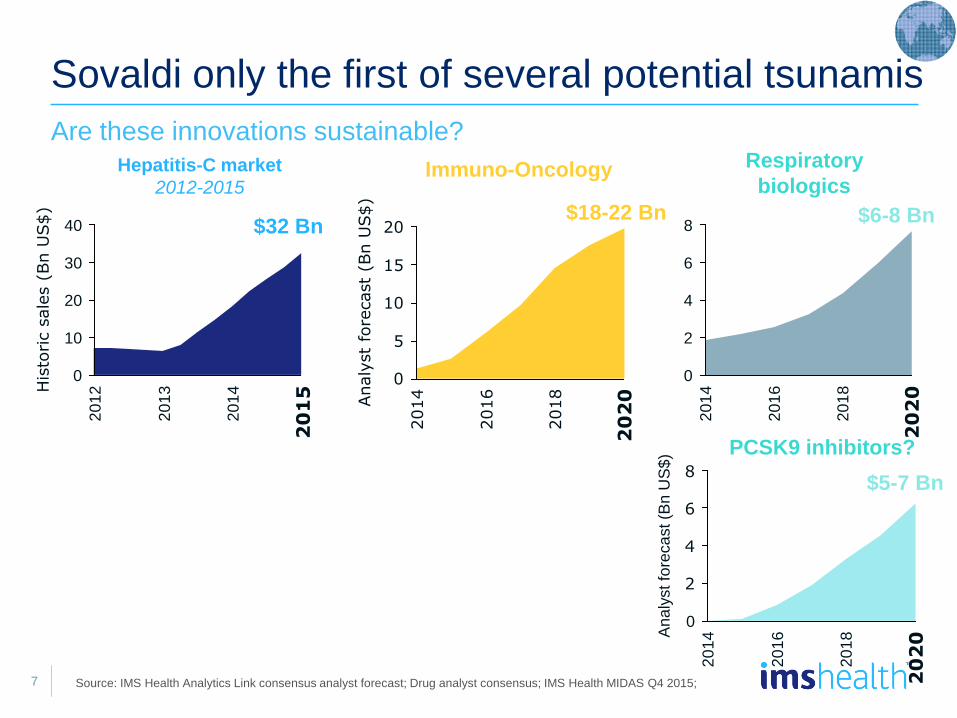
… and Cell & Gene Therapies are arriving soon
Source: IMS Health Thought Leadership analysis March 2015; IMS Health Pharma Deals; deal values incl. milestones
Autol. CAR
T-cells
$1.1bn
2012 2013 2014 2015
Autologous
CAR T-cells
Allogeneic
CAR T-cells
$265m
Parkinson’s
gene therapy
$845 m
Autol. TCR
therapy
$350 Mn
License for Glybera &
adenovirus vector
pipeline $40m Ocular
gene
therapy
20112010
Autologous
T-cells for
MS $225m
Autologous
CAR T-cells
$941m
Haemophilia
gene therapy
$280m
CV gene
therapy
$2.3bn
Autologous
CAR T-cells
$250m
Cell
thera
py
Gene t
hera
py
Hearing loss
gene therapy
$216m
Allogeneic
CAR T-cells
$850 Mn
\
Haemophilia
gene therapy
$252m
ADA-SCID
gene therapy
Oncolytic
virus $1bn
Ophthalmology
gene therapy
$1.2bn
Autol.
CAR T-
cells
$1.1 bnStem cells,
Blood
diseases
$600m
Haemophilia
gene therapy
$321m
Cell & Gene Therapy – Major companies are now actively engaged
Autol.
Dendr.
cells
$495m

99 © 2016, IMS HEALTH – Dr. Frank Wartenberg (Twitter: @FrankWartenberg)
A restricted funding environment challenges
Pharma to demonstrate value
Clinical Evidence;
Reimbursement
Assessment
Pure cost
containment
Reallocating resources to
valueSustained evidence
of value to payer
Clinical evidence stricter at
both regulatory and
national reimbursement
levels:
Payers demand H2H
comparisons, addressing
unmet need
Payers’ increasing cost
containment measures to
balance and prioritise
budget spend
Tangible and measurable
incremental benefit
Addresses healthcare
priorities
Pharma increasingly
having to find common
ground to achieve or
sustain access
Payer Interventions

1010
Challenges in Europe are numerous and
uncertain
Price negotiation collaboration
• NL and BE announced pilot joint price negotiations for orphan drugs
• GR and PT health ministers call for increasing payer collaborations
• Increased transparency of net price
Post launch payer led RWE scrutiny
• France NOAC re-assessment basedin part on own RWE
• Italy and France Avastin reimburse-ment for use in AMD
• Infliximab switching NOR-SWITCH
Budget caps and pharmapayback schemes
• Portugal and Italy reviewing payback mechanisms for budget overspend
• French HCV spending cap
• UK PPRS scheme
Increasing emphasison drug cost-value
• NHS Cancer Drugs Fund being taken in under NICE QALY assessment
• NICE QALY threshold being reviewed
• French and Italian MoH reviewingcurrent drug reimbursement system
PMAuncertainty
1111 © 2016, IMS HEALTH – Dr. Frank Wartenberg (Twitter: @FrankWartenberg)
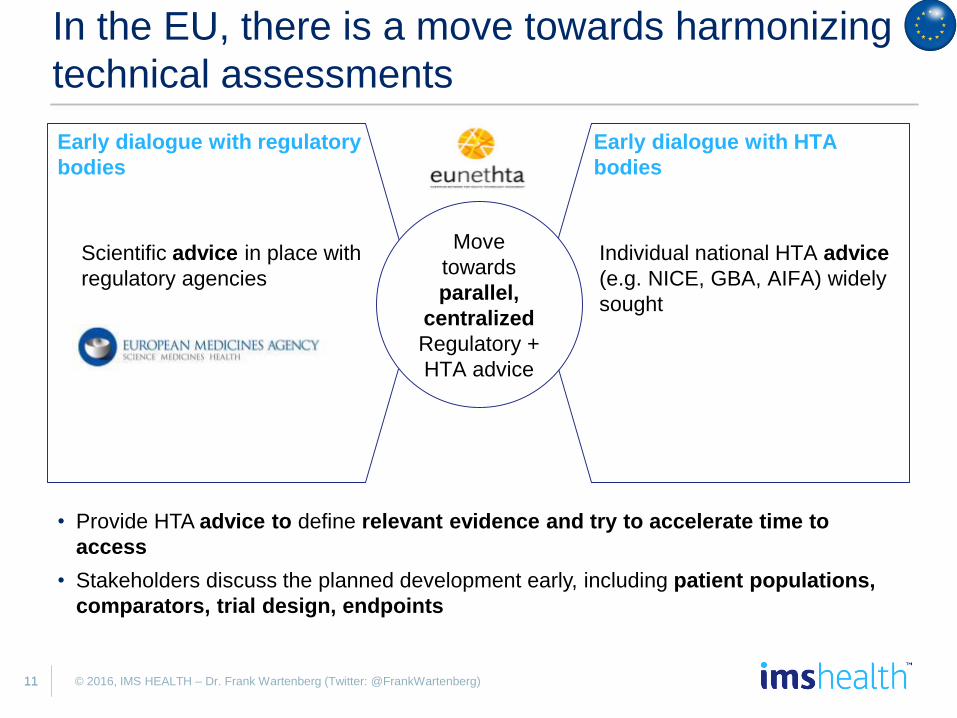
In the EU, there is a move towards harmonizing
technical assessments
Early dialogue with regulatory
bodies
Scientific advice in place with
regulatory agencies
Early dialogue with HTA
bodies
Individual national HTA advice
(e.g. NICE, GBA, AIFA) widely
sought
Move
towards
parallel,
centralized
Regulatory +
HTA advice
• Provide HTA advice to define relevant evidence and try to accelerate time to
access
• Stakeholders discuss the planned development early, including patient populations,
comparators, trial design, endpoints
1212 © 2016, IMS HEALTH – Dr. Frank Wartenberg (Twitter: @FrankWartenberg)
Currently, EUnetHTA started phase 3 which
aims to put joint assessments into real life
Joint Action 1
(2010-2012)
Joint Action 2
(2013-2015)
Joint Action 3
2016 - 2019
• Put into practice
an effective and
sustainable HTA
collaboration in Europe
• Attempt to lower barriers
for collaboration
• Deliver context specific
reporting of HTA results,
e.g. new application of the
HTA Core Model
• Strengthen the practical
application of tools and
approaches to cross-
border HTA collaboration
• Establish a sustainable
structure for HTA in the EU
• Bringing collaboration to a
higher level resulting in
better understanding
• 15 joint assessments were
performed during
EUnetHTA JA2 (2012-
2015)
• Defining and implementing
a sustainable model for
scientific and technical
cooperation on HTA in
Europe
• Results of the pilot joint
assessments need to be
put into the “real life”
routine HTA production
processes of the
EUnetHTA participating
organizations.
Coordinator: Danish Health AuthorityCoordinator: Zorginstituut
Nederland (ZIN)
Source: EUnetHTA website

1313 © 2016, IMS HEALTH – Dr. Frank Wartenberg (Twitter: @FrankWartenberg)
Question is… is value defined in the same way?
Brand name
HAS GBA NICE
Jevtana ASMR III 2
Halaven ASMR IV 4
Yervoy ASMR IV 1
Zytiga ASMR III 1
Zelboraf ASMR III 1
Inlyta ASMR IV 2
Xalkori ASMR III 3
Perjeta ASMR III 3
Tafinlar ASMR V 5
Xtandi ASMR III 1
Zaltrap ASMR V -
Erivedge ASMR IV 4
Kadcyla AMSR II 1
Opdivo ASMR III 1
Keytruda ASMR II 1
Stivarga AMSR IV 4
Positive*
unanimous
agreement
Selection of oncology products: HTA assessment ratings
Negative*
unanimous
agreement
*ASMR or GBA
rating of 3 or lower
has been classed as
positive
Source: HTA body websites

1414 © 2016, IMS HEALTH – Dr. Frank Wartenberg (Twitter: @FrankWartenberg)
In most EU countries only ~70-90% of the top
200 selling products are available in the market
140
180
0
50
100
150
200
EE
111
LV
123
LU
125
LT
143
BG
146
GR
147
NL
149
PL
155
RO
158
CZ
159
IE
166
SI
169
SK
176
HU
177
FI
180
SE
183
NO
183
UK
188
PT
189
BE
189
AT
190
IT
192
ES
193
FR
196
DE
197
Availability of EU Top 200 Products across Countries
Source: IMS Health MIDAS. 2015.

1515 © 2016, IMS HEALTH – Dr. Frank Wartenberg (Twitter: @FrankWartenberg)
Launch rollouts of innovations across EU5
diverge greatly: Germany is keyD
ela
y in M
on
ths
Top 5 onco drugs (launched 2011-2015), delay from 1st country’s launch, EU5
$107 $213 $57 $124 $37
Source: IMS Health, MIDAS December 2015, Rx only. Delay calculated from 1st country’s launch in one of the EU5 markets. Country ranked by
months of delay since first launch; drugs ranked by sales in EU5.
Imbruvica not launched yet in Spain (the 18 months equal the time between first launch and April ’16)
EU5
4
9
21
18
89
3
20
12
65
27
10
16
18
1
10
1
GermanyUK SpainItaly France
ImbruvicaZytiga PerjetaXtandi Jakavi
MAT 12/15
sales (Mio)
1616 © 2016, IMS HEALTH – Dr. Frank Wartenberg (Twitter: @FrankWartenberg)
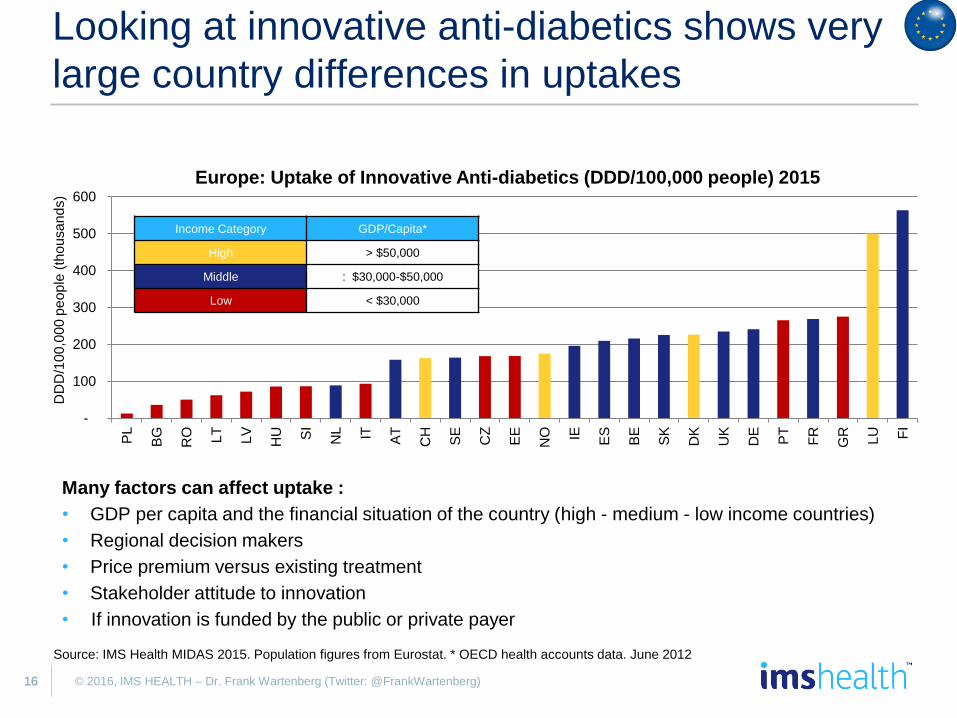
Looking at innovative anti-diabetics shows very
large country differences in uptakes
-
100
200
300
400
500
600
PL
BG
RO LT
LV
HU SI
NL IT AT
CH
SE
CZ
EE
NO IE ES
BE
SK
DK
UK
DE
PT
FR
GR
LU FI
DD
D/1
00
,00
0 p
eo
ple
(th
ou
sa
nd
s)
Europe: Uptake of Innovative Anti-diabetics (DDD/100,000 people) 2015
Income Category GDP/Capita*
High > $50,000
Middle : $30,000-$50,000
Low < $30,000
Many factors can affect uptake :
• GDP per capita and the financial situation of the country (high - medium - low income countries)
• Regional decision makers
• Price premium versus existing treatment
• Stakeholder attitude to innovation
• If innovation is funded by the public or private payer
Source: IMS Health MIDAS 2015. Population figures from Eurostat. * OECD health accounts data. June 2012
1717
Source: IMS MIDAS, Q4 2015, only Rx, IMS Health analysis
© 2016, IMS HEALTH – Dr. Frank Wartenberg (Twitter: @FrankWartenberg)
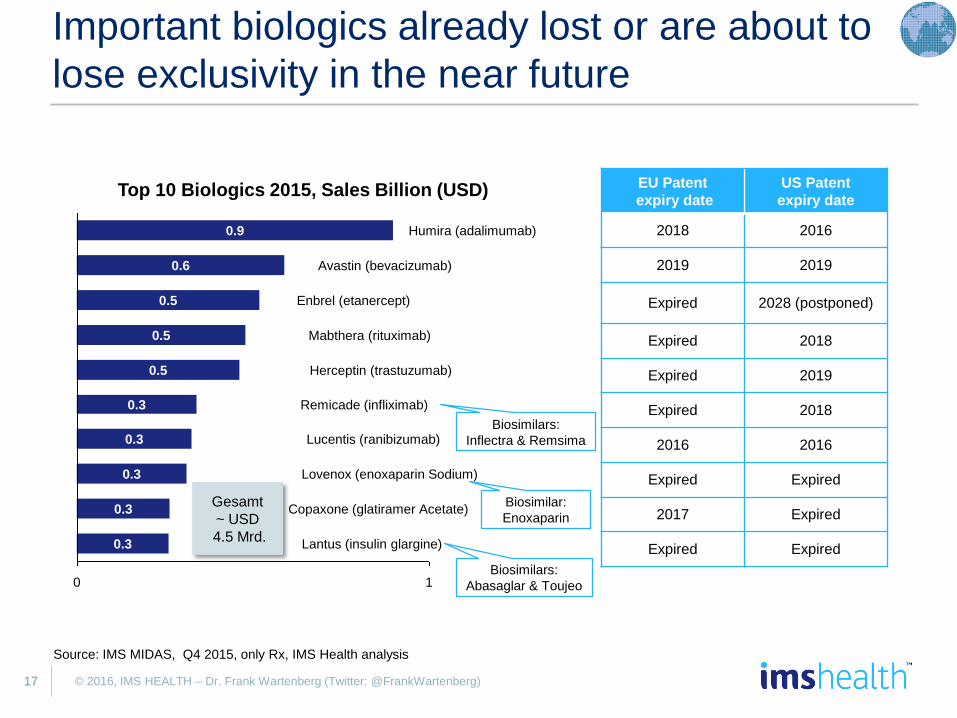
Important biologics already lost or are about to
lose exclusivity in the near future
EU Patent
expiry date
US Patent
expiry date
2018 2016
2019 2019
Expired 2028 (postponed)
Expired 2018
Expired 2019
Expired 2018
2016 2016
Expired Expired
2017 Expired
Expired Expired
0 1
0.9
Mabthera (rituximab)
0.6
Humira (adalimumab)
0.5 Enbrel (etanercept)
Avastin (bevacizumab)
0.5
0.5
Lucentis (ranibizumab)
Remicade (infliximab)
0.3
0.3
Copaxone (glatiramer Acetate)
0.3
0.3
Herceptin (trastuzumab)
Lovenox (enoxaparin Sodium)
Lantus (insulin glargine)0.3
Top 10 Biologics 2015, Sales Billion (USD)
Gesamt
~ USD
4.5 Mrd.
Biosimilars:
Abasaglar & Toujeo
Biosimilars:
Inflectra & Remsima
Biosimilar:
Enoxaparin

1818 © 2016, IMS HEALTH – Dr. Frank Wartenberg (Twitter: @FrankWartenberg)
The entrance of biosimilars leads to a decrease
in prices – putting the originator under pressure
-48%-16%
-29%
-13%-8%
-15%
-27%-28%
-13%
-71%
-44%-30%
-28%
-18%
-61%
-10%
-2%
CZ
-30%
-22%FR
-29%-12%
7%-29%
-45%
-21%
-10%
-41%-36%
AT
-20%
EU
-5%
UK
ES
SK
IT
HU
DE
HGHEpoetin alfa
G-CSF
The increased competition affects
not just the price for the directly
comparable product but also
the price of the whole product class
The countries with the highest
reduction show reduction of 50-70%
Caveat – prices used in the study
are list prices. It can be assumed
that additional discounts have been
agreed in certain situations
Source: IMS Health (2015): The Impact of Biosimilar Competition
Price per treatment day
(2014/year before biosimilar entrance)

1919 © 2016, IMS HEALTH – Dr. Frank Wartenberg (Twitter: @FrankWartenberg)
In less than 2 months, the first disclosure for
EFPIA will take place
201520142013
Publicationuntil: June 30th 2016
EFPIA HCP/HCO
Disclosure CodeJune 24th 2013
EFPIA Code
of Practice
Data collection by
member companiesfrom January 2015
Aggregate
R&D
Healthcare-
Organizations
HCPs
Disclosure in 2016
based on 2015 data
Source: IMS Health 2014 European Trends in Aggregate Spend, Transparency & Disclosure

2020 © 2016, IMS HEALTH – Dr. Frank Wartenberg (Twitter: @FrankWartenberg)
Obtaining consent is key, however status
updates show that it is often missing
27%
28%
Establishing a unique identifier for
each HCP/HCO from all data sources
Implementing effective governance
Managing relationships
with customers
20%
Disclosing data 35%
Monitoring transparency
requirements
54%
Obtaining consent
for each customer
40%
Allocating time and
identifying resources
65%
How challenging are the following process? (Percentage rating 7,8, and 9 on a 9 point scale)
• Poland – Infarma
– January 2015 - 12% Consent
– December 2015 – 23% Consent
• Germany- Vfa/EFPIA
– April 2015 – 50-55 % Consent
– October 2015 - 40-45% Consent
• UK – ABPI Survey
– 2015 – 69 % Consent
• Spain – Farmaindustria
– April 2015 – Approx. 10% Consent
– October 2015 – Approx. 25% Consent
Consent Status from EFPIA members
Consent Status from IMS Health Consent
solutions users
• Spain
– October 2015 3% Consent
– February 2016 2,2 % Consent
• Germany
– October 2015 57% Consent
– February 2016 27% Consent
Source: IMS Health: 2015 European Aggregate Spend, Transparency and Disclosure, 2016 EUROPEAN USER GROUP MEETING

2121 © 2016, IMS HEALTH – Dr. Frank Wartenberg (Twitter: @FrankWartenberg)
Wrap-up
Growth in the pharmaceutical market mainly comes from specialty care1
Uptake and launch roll-out differs between EU countries2
Value assessments serve as justification for pricing/reimbursement,
however high-cost products are subject to further cost containments3
Biosimilars enter the market and increase competition which leads to lower
prices4
European Transparency Initiative affects all pharmaceutical companies –
biggest challenge in obtaining consent from stakeholders5

2222
Please contact me for more
information:
Dr. Frank Wartenberg
President Central Europe, IMS Health
Telefon: 069/6604-4315
Follow me on : @FrankWartenberg
© 2016, IMS HEALTH – Dr. Frank Wartenberg (Twitter: @FrankWartenberg)

2323 © 2016, IMS HEALTH – Dr. Frank Wartenberg (Twitter: @FrankWartenberg)

2424
© 2016, IMS HEALTH GmbH & Co. OHG
All rights reserved. The information may not be duplicated, stored, further processed, nor be made accessible in whole or in part to any third party
without the prior express written consent of IMS HEALTH.
In connection with data/figures used terms, such as „patient, doctor, medical practice, prescriber or pharmacy”, do not designate any personal data
but exclusively anonymous information (in accordance with § 3 Abs. 6 “Bundesdatenschutzgesetz” – German Federal Data Protection Act)
IMS employs high sophisticated technologies and methods which ensure all its Information Services to meet the applicable data-protection
requirements, regardless the way data are combined with one another.
© 2016, IMS HEALTH – Dr. Frank Wartenberg (Twitter: @FrankWartenberg)