Embed Size (px)
Citation preview
Physical Sciences Inc. 20 New England Business Center Andover, MA 01810
Physical
Sciences Inc.
Compact Hydrogen Peroxide Sensor for
Sterilization Cycle Monitoring
January 26, 2015
Krishnan R. Parameswaran, Clinton J. Smith,
Kristin L. Galbally-Kinney, William J. Kessler
Acknowledgement of Support
The project described was supported by Award Number 4R44EB013517 02 from the National Institute of Biomedical Imaging and Bioengineering. The content is
solely the responsibility of the author(s) and does not necessarily represent the official views of the National Institute of Biomedical Imaging and Bioengineering or
the National Institutes of Health.
VG15-012
Physical Sciences Inc.
Outline
Background & Motivation
– H2O2 facilitates sterile processing in pharmaceutical manufacturing
– Difficult to measure extremely low (part-per billion) concentrations
Solution: Photoacoustic Spectroscopy – Less (cost, size) is More
Sensor Development Results
Summary
VG15-012 -1 -1
Physical Sciences Inc.
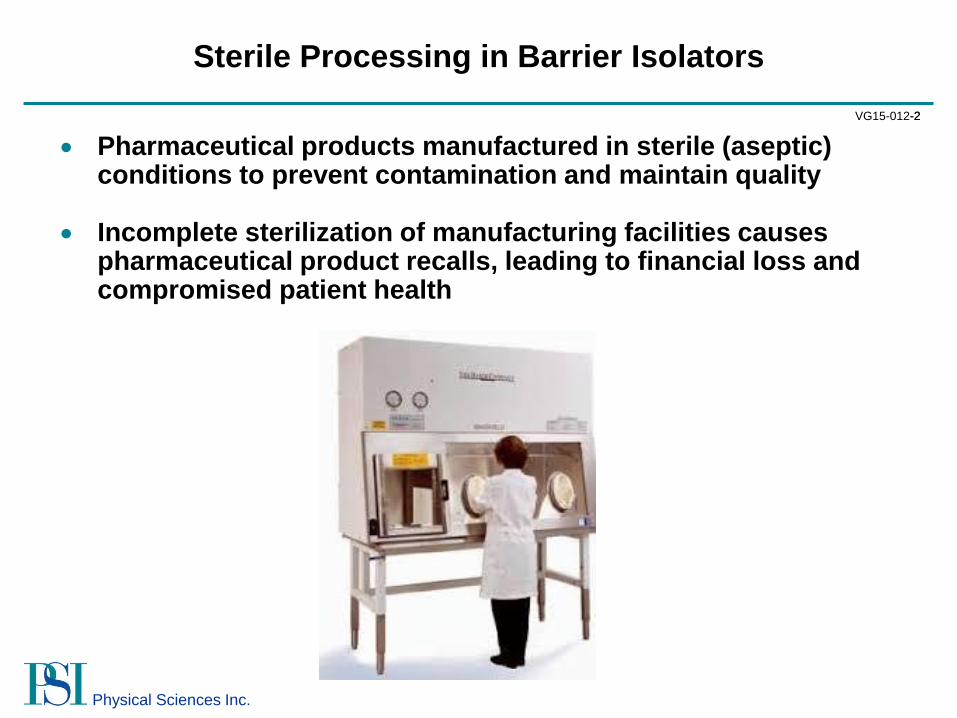
Sterile Processing in Barrier Isolators
Pharmaceutical products manufactured in sterile (aseptic) conditions to prevent contamination and maintain quality
Incomplete sterilization of manufacturing facilities causes pharmaceutical product recalls, leading to financial loss and compromised patient health
VG15-012 -2 -2
Physical Sciences Inc.
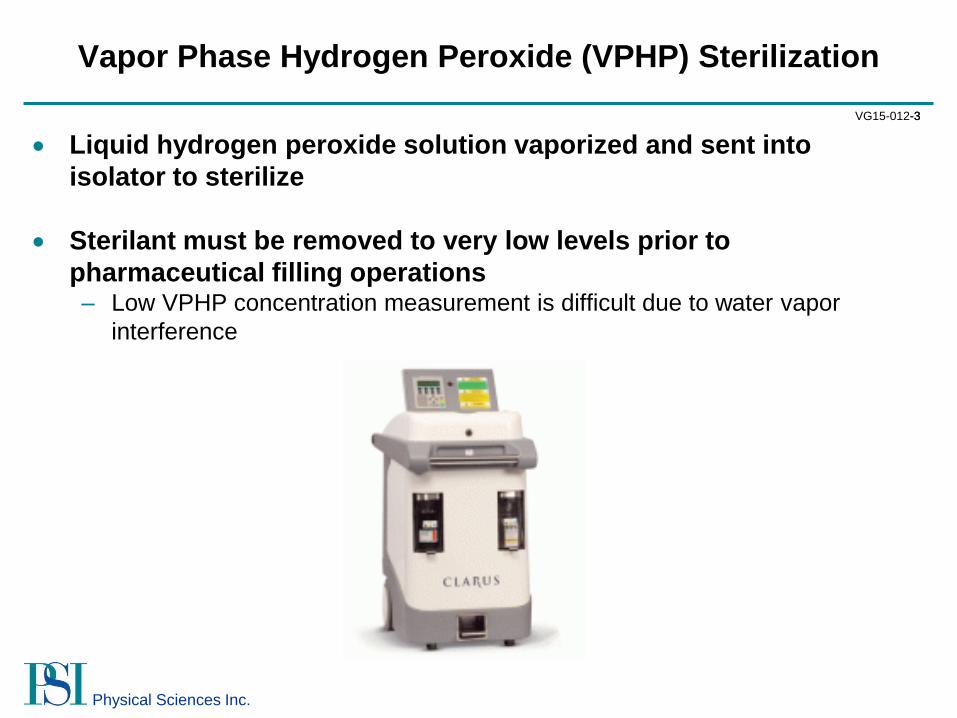
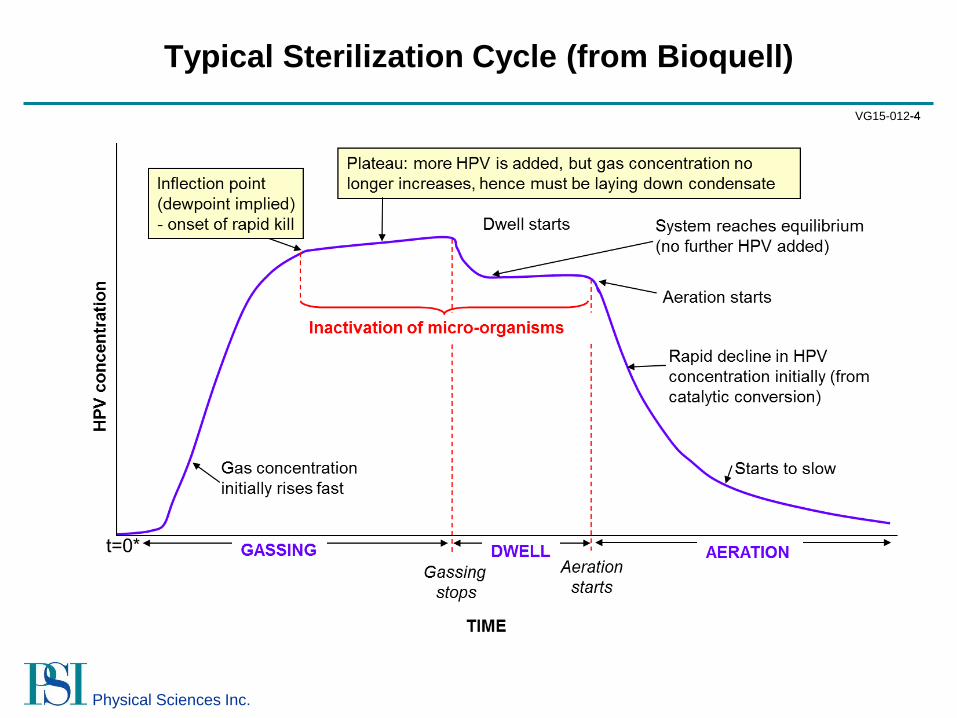
Vapor Phase Hydrogen Peroxide (VPHP) Sterilization
Liquid hydrogen peroxide solution vaporized and sent into
isolator to sterilize
Sterilant must be removed to very low levels prior to
pharmaceutical filling operations – Low VPHP concentration measurement is difficult due to water vapor
interference
VG15-012 -3 -3
Physical Sciences Inc.
Typical Sterilization Cycle (from Bioquell)
VG15-012 -4 -4
Physical Sciences Inc.
New Challenge: Lower VPHP Detection Limit
New biologic drugs more sensitive to VPHP – Must reduce concentration to 10 ppb before manufacturing
Current state of the art not able to reach 10 ppb (0.01 ppm)
detection limit
Goal:
Develop (robust) commercial sensor capable of measuring
10 ppb VPHP in presence of 10,000 ppm water vapor
PSI Approach:
Mid-Infrared Laser-Based Photoacoustic Spectroscopy
(MIR PAS)
VG15-012 -5 -5
Physical Sciences Inc.
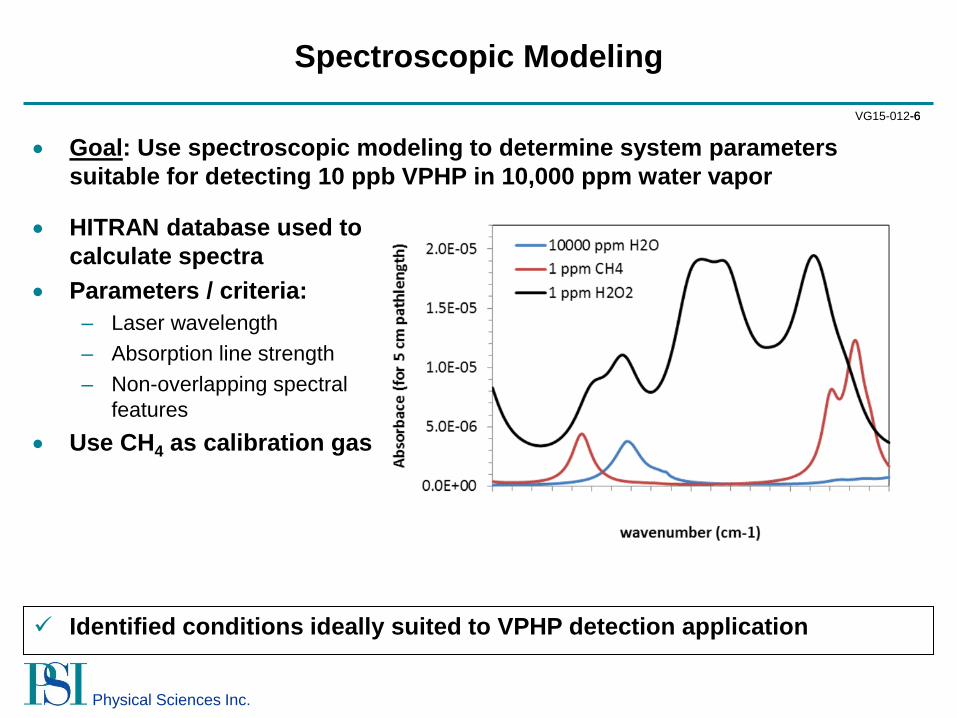
Spectroscopic Modeling
Goal: Use spectroscopic modeling to determine system parameters
suitable for detecting 10 ppb VPHP in 10,000 ppm water vapor
Identified conditions ideally suited to VPHP detection application
HITRAN database used to
calculate spectra
Parameters / criteria:
– Laser wavelength
– Absorption line strength
– Non-overlapping spectral
features
Use CH4 as calibration gas
VG15-012 -6 -6
Physical Sciences Inc.
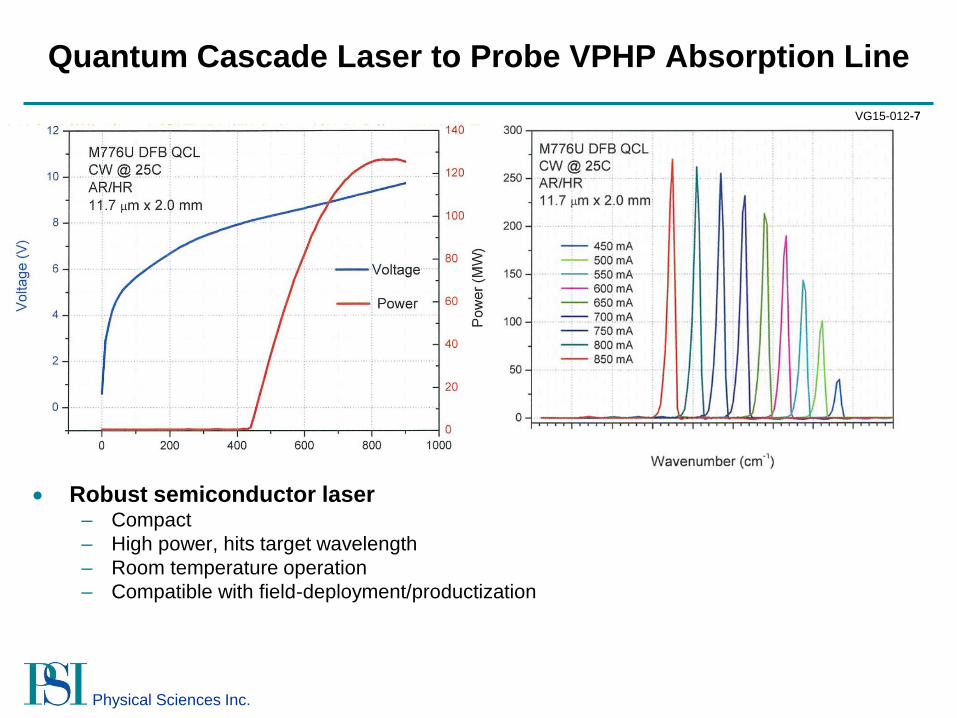
Quantum Cascade Laser to Probe VPHP Absorption Line
Robust semiconductor laser – Compact
– High power, hits target wavelength
– Room temperature operation
– Compatible with field-deployment/productization
VG15-012 -7 -7
Physical Sciences Inc.
VPHP Measurement Method:
Photoacoustic Spectroscopy (PAS)
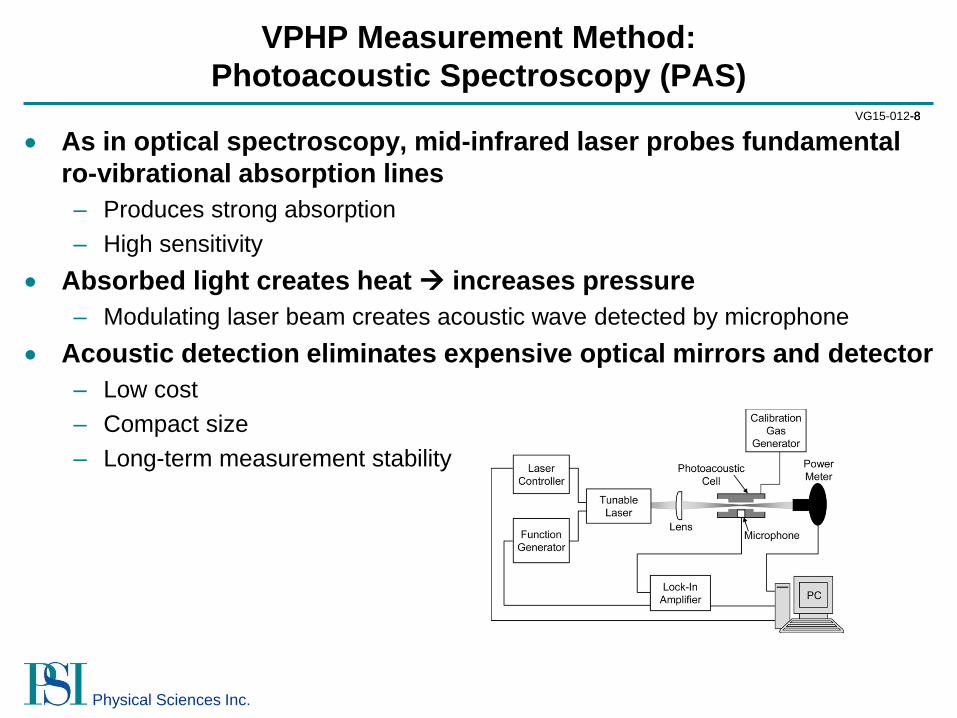
As in optical spectroscopy, mid-infrared laser probes fundamental
ro-vibrational absorption lines
– Produces strong absorption
– High sensitivity
Absorbed light creates heat increases pressure
– Modulating laser beam creates acoustic wave detected by microphone
Acoustic detection eliminates expensive optical mirrors and detector
– Low cost
– Compact size
– Long-term measurement stability
VG15-012 -8 -8
Physical Sciences Inc.
PAS Figures of Merit (to Maximize Sensitivity)
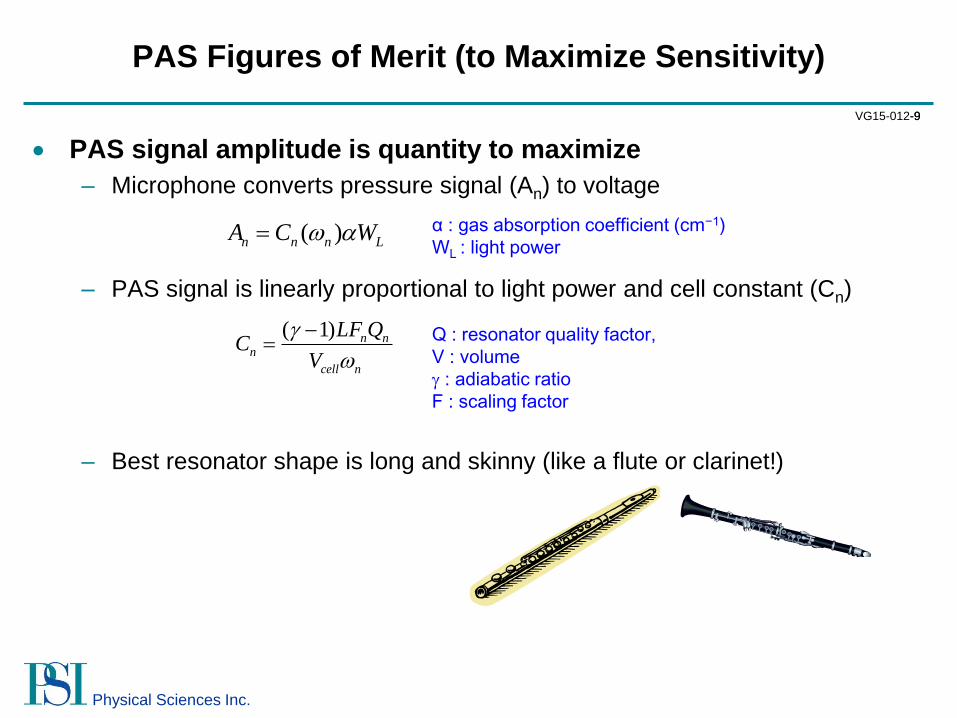
PAS signal amplitude is quantity to maximize
– Microphone converts pressure signal (An) to voltage
– PAS signal is linearly proportional to light power and cell constant (Cn)
– Best resonator shape is long and skinny (like a flute or clarinet!)
( )n n n LA C W α : gas absorption coefficient (cm−1)
WL : light power
( 1) n nn
cell n
LF QC
V
Q : resonator quality factor,
V : volume
: adiabatic ratio
F : scaling factor
VG15-012 -9 -9
Physical Sciences Inc.
PAS Major Drawback
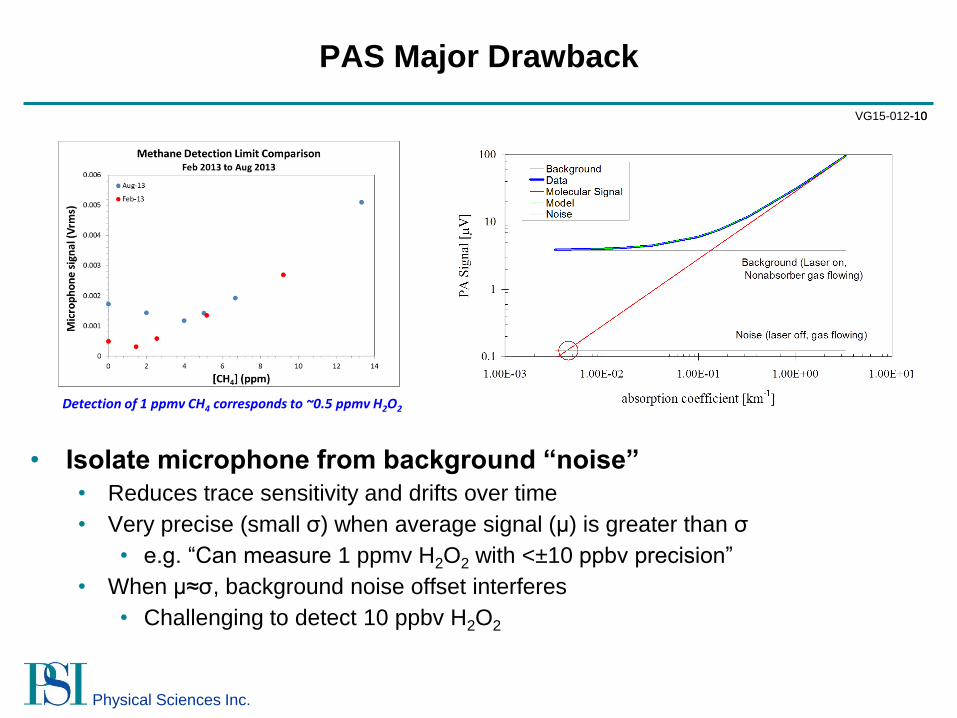
• Isolate microphone from background “noise”
• Reduces trace sensitivity and drifts over time
• Very precise (small σ) when average signal (μ) is greater than σ
• e.g. “Can measure 1 ppmv H2O2 with <±10 ppbv precision”
• When μ≈σ, background noise offset interferes
• Challenging to detect 10 ppbv H2O2
Detection of 1 ppmv CH4 corresponds to ~0.5 ppmv H2O2
VG15-012 -10 -10
Physical Sciences Inc.
Acoustic Modeling to Optimize Resonator Design
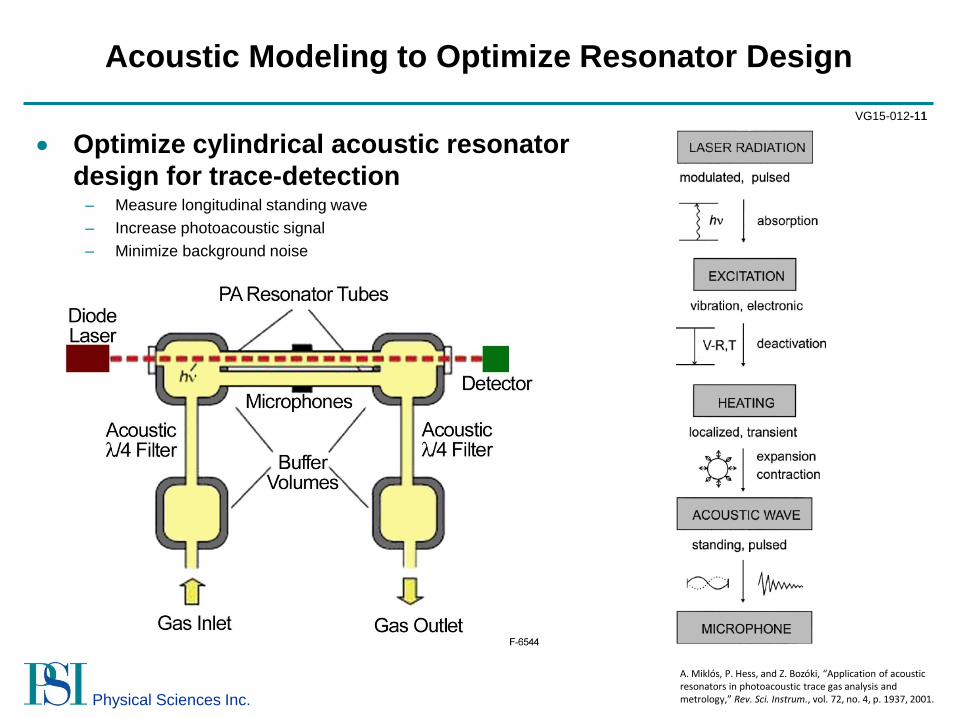
Optimize cylindrical acoustic resonator
design for trace-detection – Measure longitudinal standing wave
– Increase photoacoustic signal
– Minimize background noise
A. Miklos, P. Hess, and Z. Bozoki, “Application of acoustic resonators in photoacoustic trace gas analysis and metrology,” Rev. Sci. Instrum., vol. 72, no. 4, p. 1937, 2001.
VG15-012 -11 -11
Physical Sciences Inc.
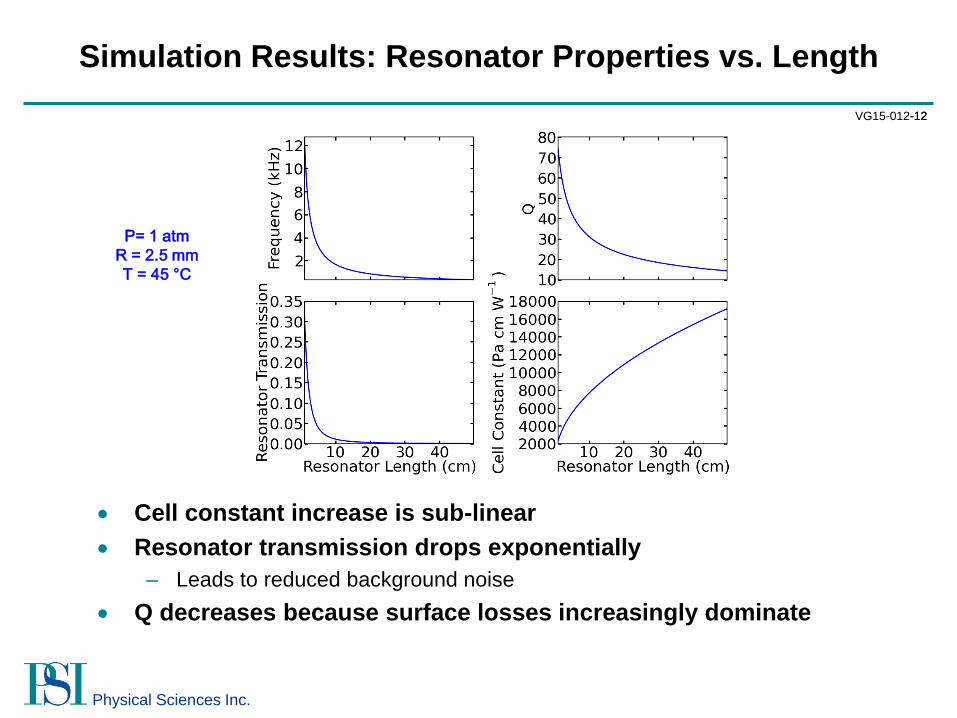
Simulation Results: Resonator Properties vs. Length
Cell constant increase is sub-linear
Resonator transmission drops exponentially
– Leads to reduced background noise
Q decreases because surface losses increasingly dominate
Intensity Map (A.U.)
P= 1 atm
R = 2.5 mm
T = 45 °C
VG15-012 -12 -12
Physical Sciences Inc.
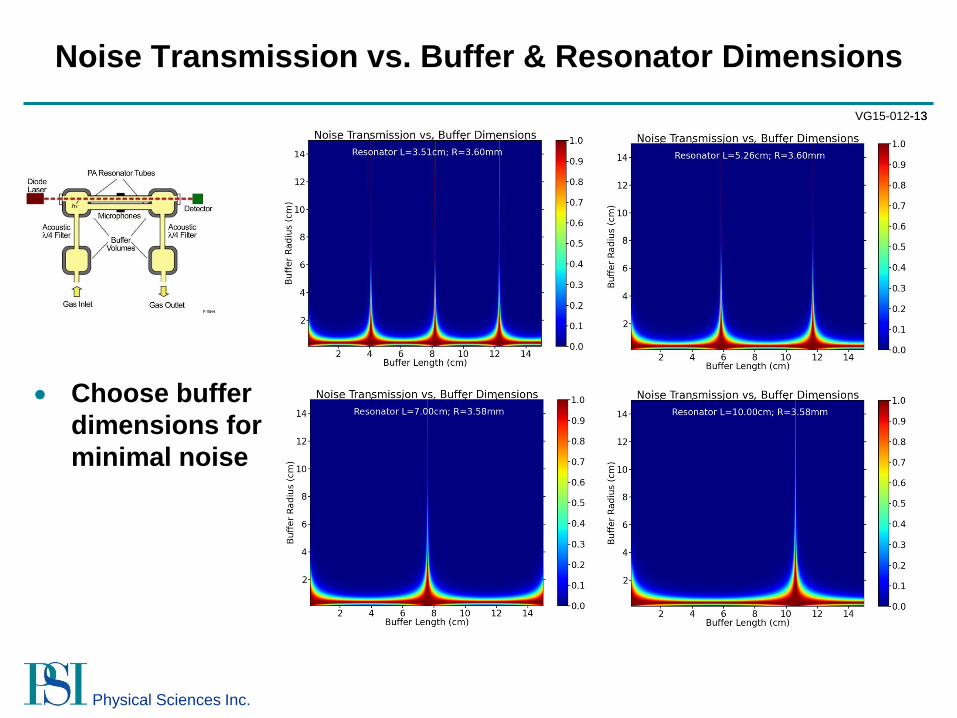
Noise Transmission vs. Buffer & Resonator Dimensions
Choose buffer
dimensions for
minimal noise
VG15-012 -13 -13
Physical Sciences Inc.
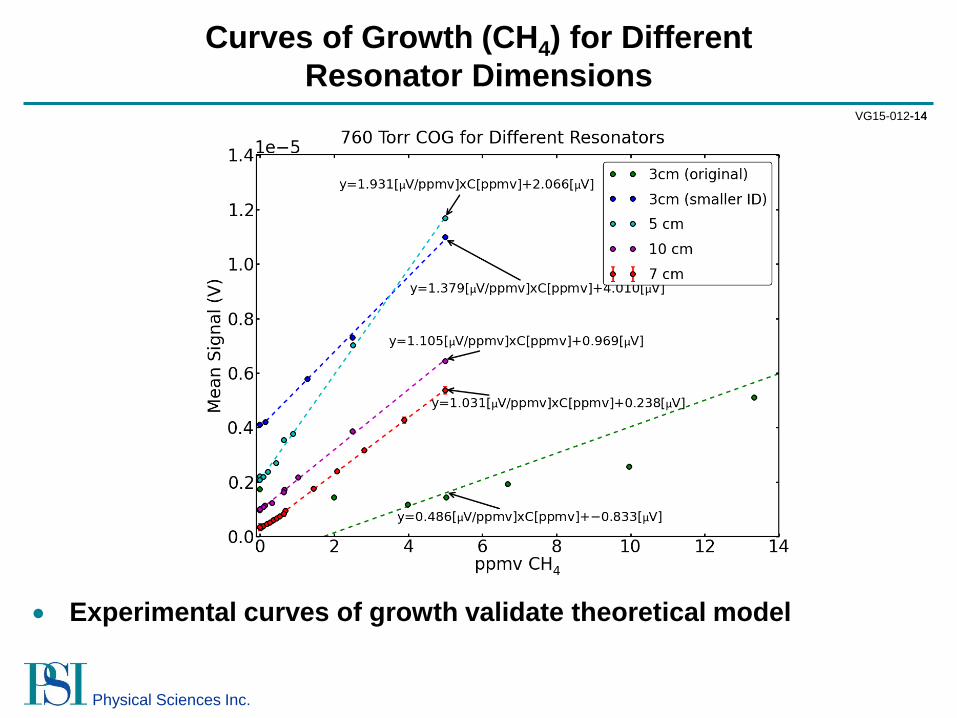
Curves of Growth (CH4) for Different
Resonator Dimensions
Experimental curves of growth validate theoretical model
VG15-012 -14 -14
Physical Sciences Inc.
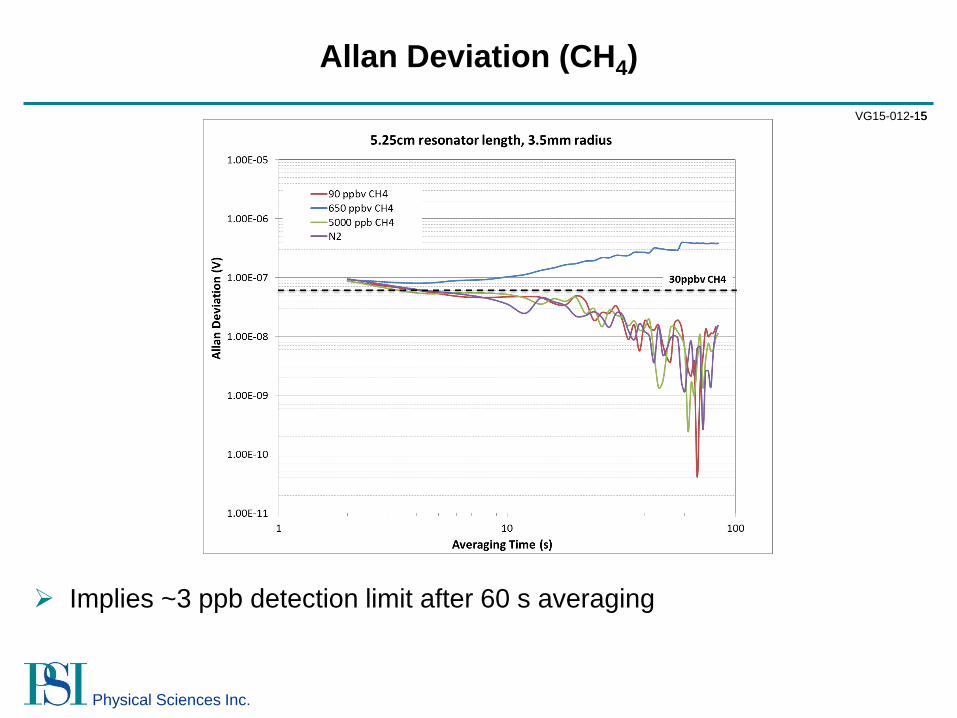
Allan Deviation (CH4)
Implies ~3 ppb detection limit after 60 s averaging
VG15-012 -15 -15
Physical Sciences Inc.
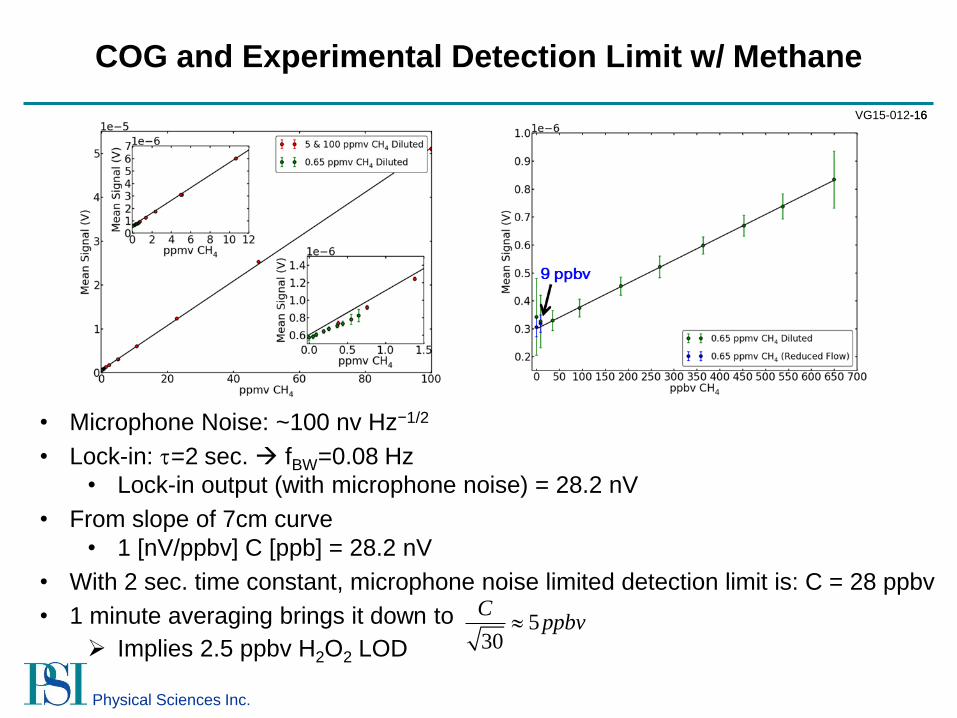
• Microphone Noise: ~100 nv Hz−1/2
• Lock-in: t=2 sec. fBW=0.08 Hz
• Lock-in output (with microphone noise) = 28.2 nV
• From slope of 7cm curve
• 1 [nV/ppbv] C [ppb] = 28.2 nV
• With 2 sec. time constant, microphone noise limited detection limit is: C = 28 ppbv
• 1 minute averaging brings it down to
Implies 2.5 ppbv H2O2 LOD 5
30
Cppbv
COG and Experimental Detection Limit w/ Methane
VG15-012 -16 -16
Physical Sciences Inc.
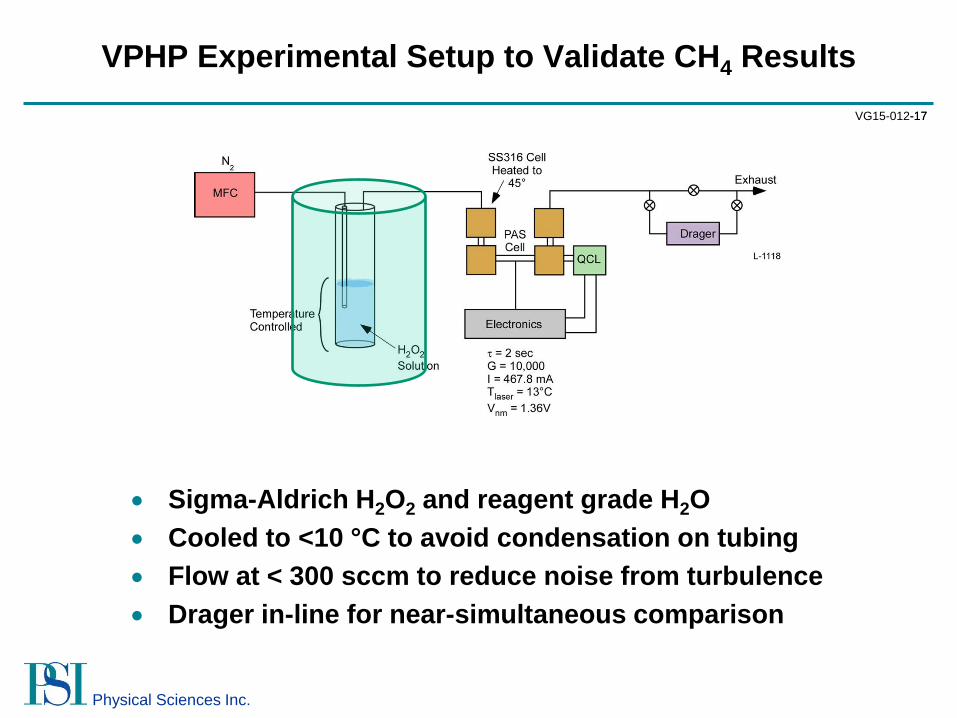
VPHP Experimental Setup to Validate CH4 Results
Sigma-Aldrich H2O2 and reagent grade H2O
Cooled to <10 °C to avoid condensation on tubing
Flow at < 300 sccm to reduce noise from turbulence
Drager in-line for near-simultaneous comparison
VG15-012 -17 -17
Physical Sciences Inc.
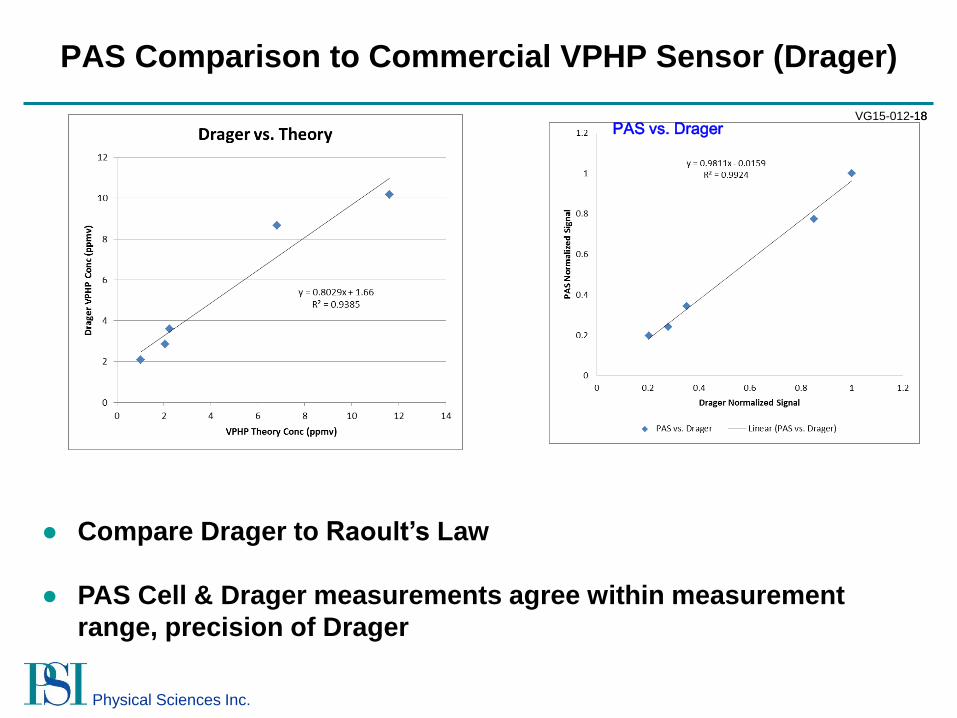
PAS vs. Drager
PAS Comparison to Commercial VPHP Sensor (Drager)
● Compare Drager to Raoult’s Law
● PAS Cell & Drager measurements agree within measurement
range, precision of Drager
VG15-012 -18 -18
Physical Sciences Inc.
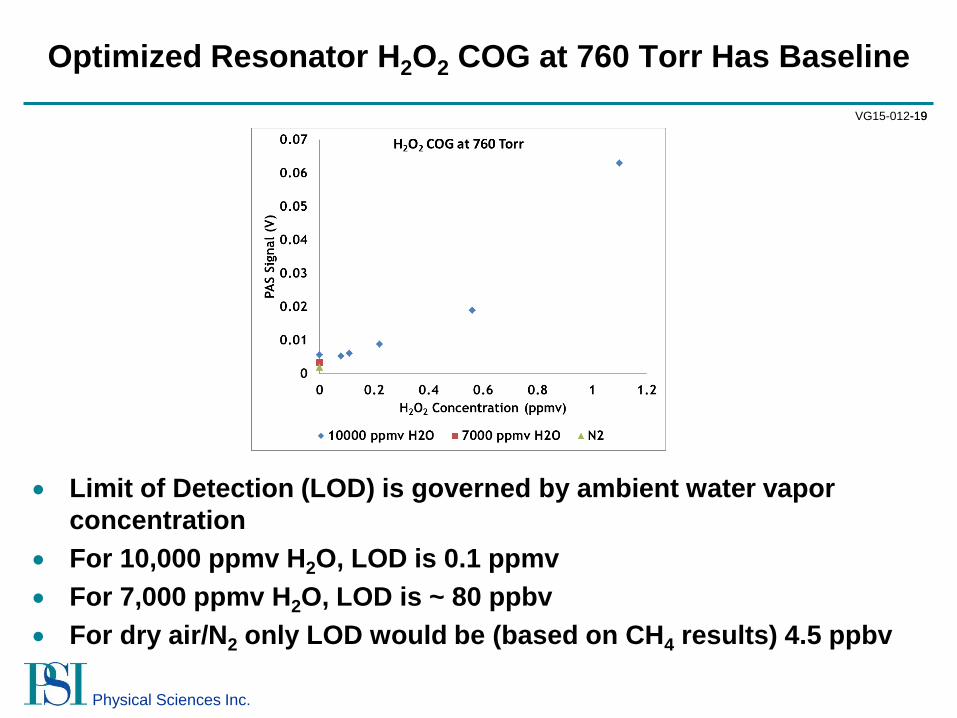
Optimized Resonator H2O2 COG at 760 Torr Has Baseline
Limit of Detection (LOD) is governed by ambient water vapor
concentration
For 10,000 ppmv H2O, LOD is 0.1 ppmv
For 7,000 ppmv H2O, LOD is ~ 80 ppbv
For dry air/N2 only LOD would be (based on CH4 results) 4.5 ppbv
VG15-012 -19 -19
Physical Sciences Inc.
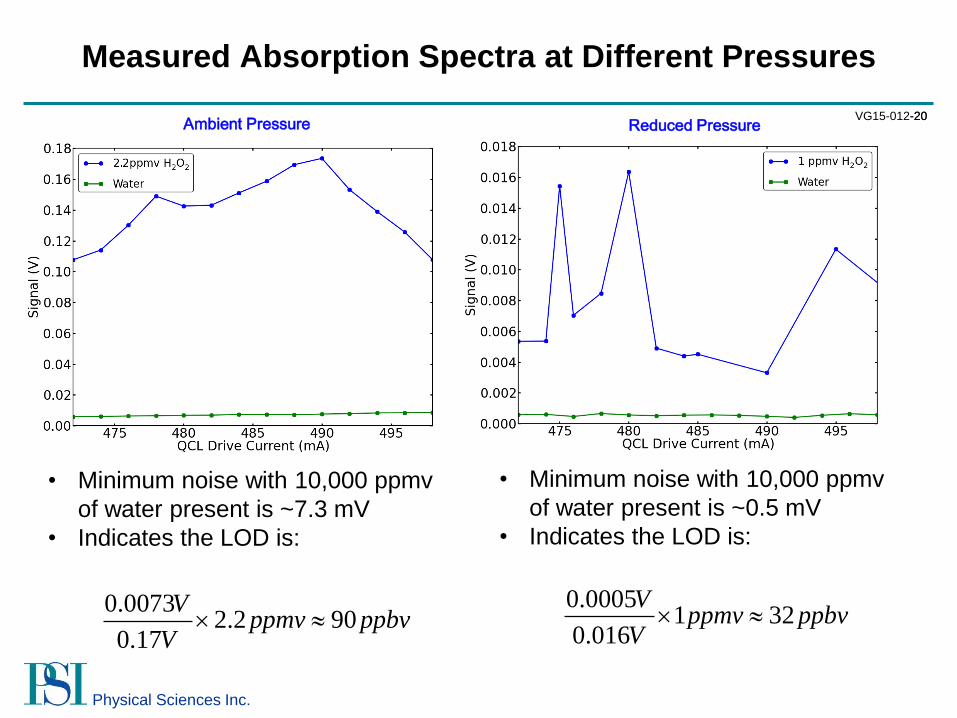
0.00051 32
0.016
Vppmv ppbv
V
• Minimum noise with 10,000 ppmv
of water present is ~0.5 mV
• Indicates the LOD is:
Measured Absorption Spectra at Different Pressures
• Minimum noise with 10,000 ppmv
of water present is ~7.3 mV
• Indicates the LOD is:
0.00732.2 90
0.17
Vppmv ppbv
V
Ambient Pressure Reduced Pressure VG15-012 -20 -20
Physical Sciences Inc.
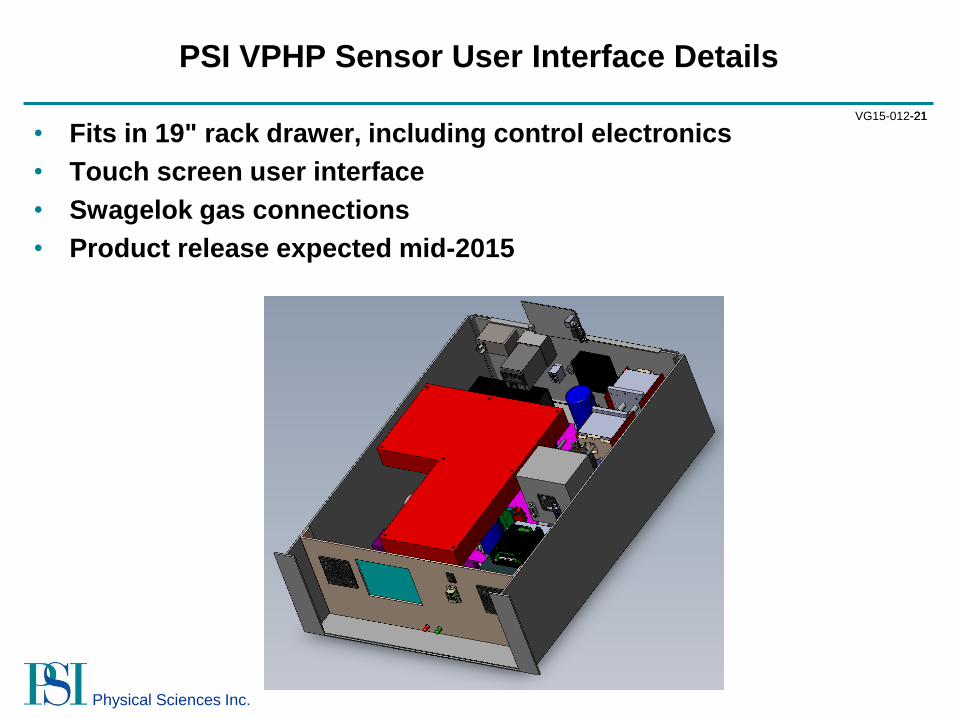
PSI VPHP Sensor User Interface Details
• Fits in 19" rack drawer, including control electronics
• Touch screen user interface
• Swagelok gas connections
• Product release expected mid-2015
VG15-012 -21 -21
Physical Sciences Inc.
Summary
New biologic drugs more sensitive to VPHP than small
molecules
Must reduce concentration to as little as 10 ppbv before
manufacturing
Current state of the art spectrometers have ~ 0.1 ppmv
detection limit
Demonstrated photoacoustic VPHP detection in compact,
low-cost platform
– High dynamic range (> 4 orders of magnitude)
– Detection limit of ~32 ppbv
– Easily calibrated with CH4
VG15-012 -22 -22
Physical Sciences Inc.
Questions?