Embed Size (px)
Citation preview

F O R M A L I S AT I O N A N D A U T O M AT E D C O M P U TAT I O N O F D I A B E T E S C L I N I C A L Q U A L I T Y I N D I C AT O R S W I T H C H I N E S E H O S P I TA L PAT I E N T D ATA
H A I T O N G L I U , A N N E T T E T E N T E I J E , K A T H R I N D E N T L E R , J I N G D O N G M A , S H I J I N G Z H A N G - K R 4 H C / P R O H E A LT H 2 0 1 6
TA B L E O F C O N T E N T S
• Background 1) Healthcare quality indicators2) Formalisation of quality indicators 3) CLIF: reproducibility and generalisability
• CLIF’s (re-)usability and generalisability to Chinese patient data
Q U A L I T Y I N D I C AT O R S
• Voluntary and legally mandatory
• Structure, process and outcome
• For hospitals and general practitioners
• Based on evidence and consensus
• Used by patients, care givers, government, insurances
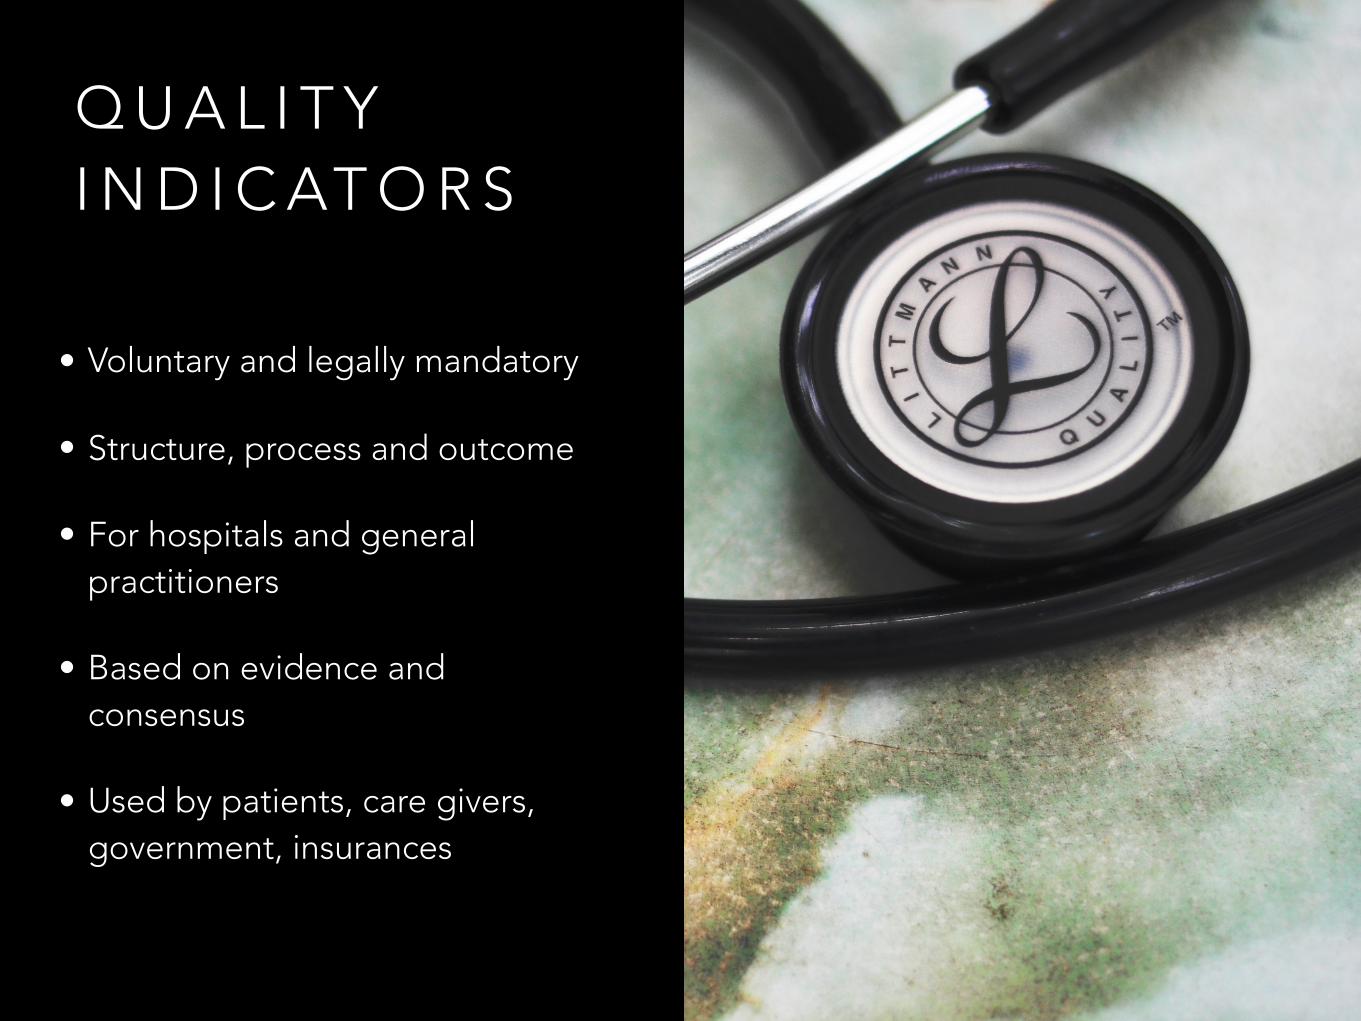
E X A M P L E I N D I C AT O R : H B A 1 C M E A S U R E D
Numerator: % of diabetes patients whose HbA1c has been determined in the last 12 months
Denominator: diabetes patients
P R O B L E M S
• Increasing number of indicators (in the Netherlands > 2.000 per hospital); mainly calculated manually => increasing workload and costs
• Varying interpretations of ambiguous natural language => doubtful results
O P P O R T U N I T Y: M O R E A N D M O R E PAT I E N T D ATA I S B E I N G C O L L E C T E D , S O T H AT I T M I G H T B E P O S S I B L E T O C O M P U T E I N D I C AT O R S A U T O M AT I C A L LY
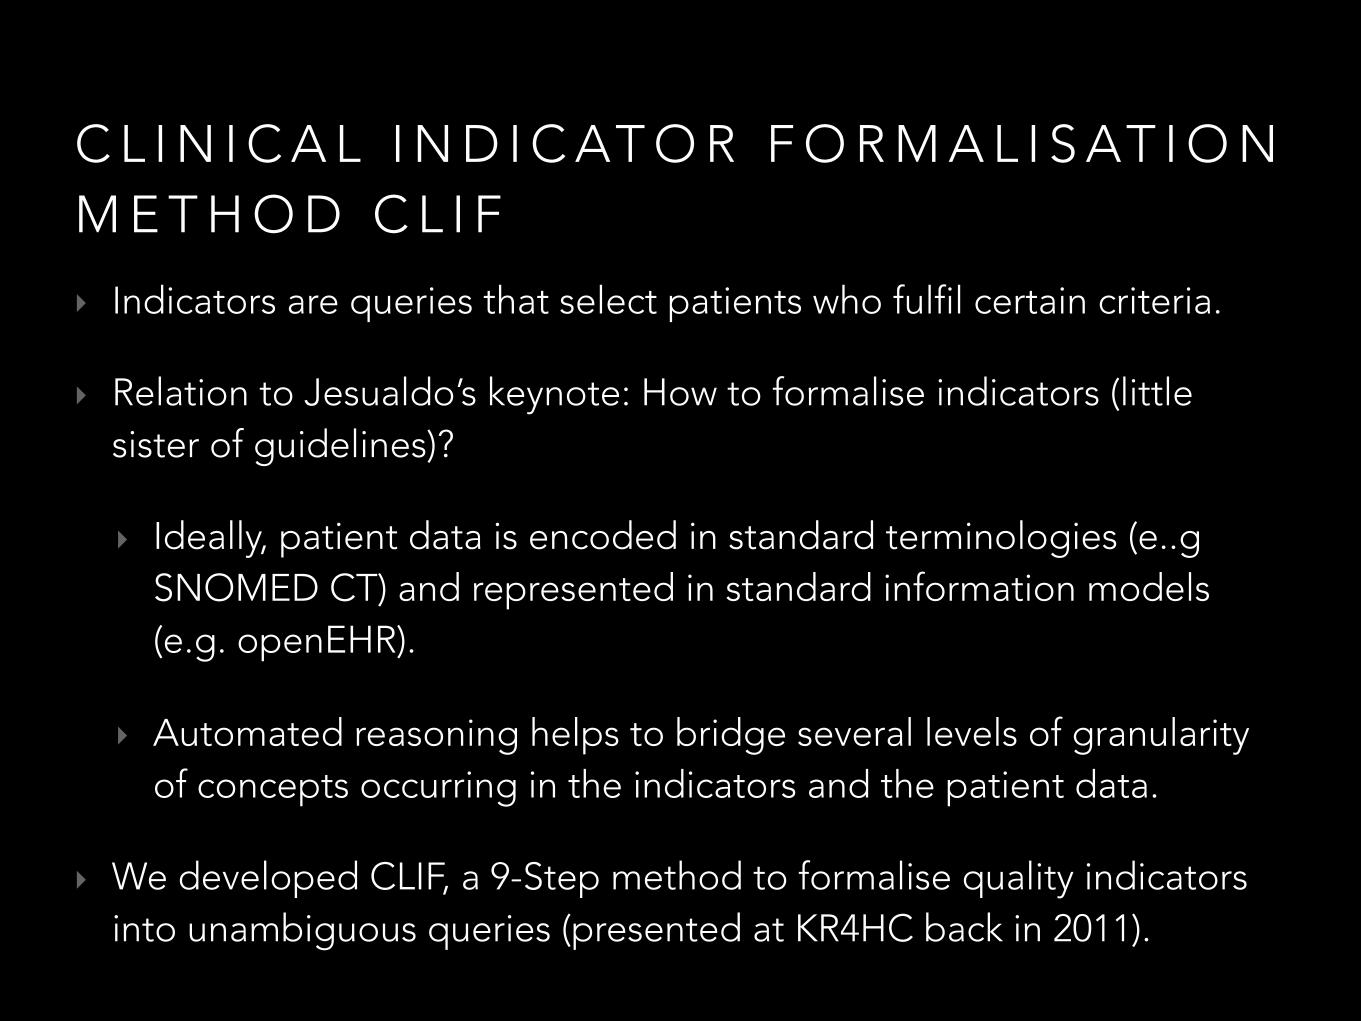
‣ Indicators are queries that select patients who fulfil certain criteria.
‣ Relation to Jesualdo’s keynote: How to formalise indicators (little sister of guidelines)?
‣ Ideally, patient data is encoded in standard terminologies (e..g SNOMED CT) and represented in standard information models (e.g. openEHR).
‣ Automated reasoning helps to bridge several levels of granularity of concepts occurring in the indicators and the patient data.
‣ We developed CLIF, a 9-Step method to formalise quality indicators into unambiguous queries (presented at KR4HC back in 2011).
C L I N I C A L I N D I C AT O R F O R M A L I S AT I O N M E T H O D C L I F
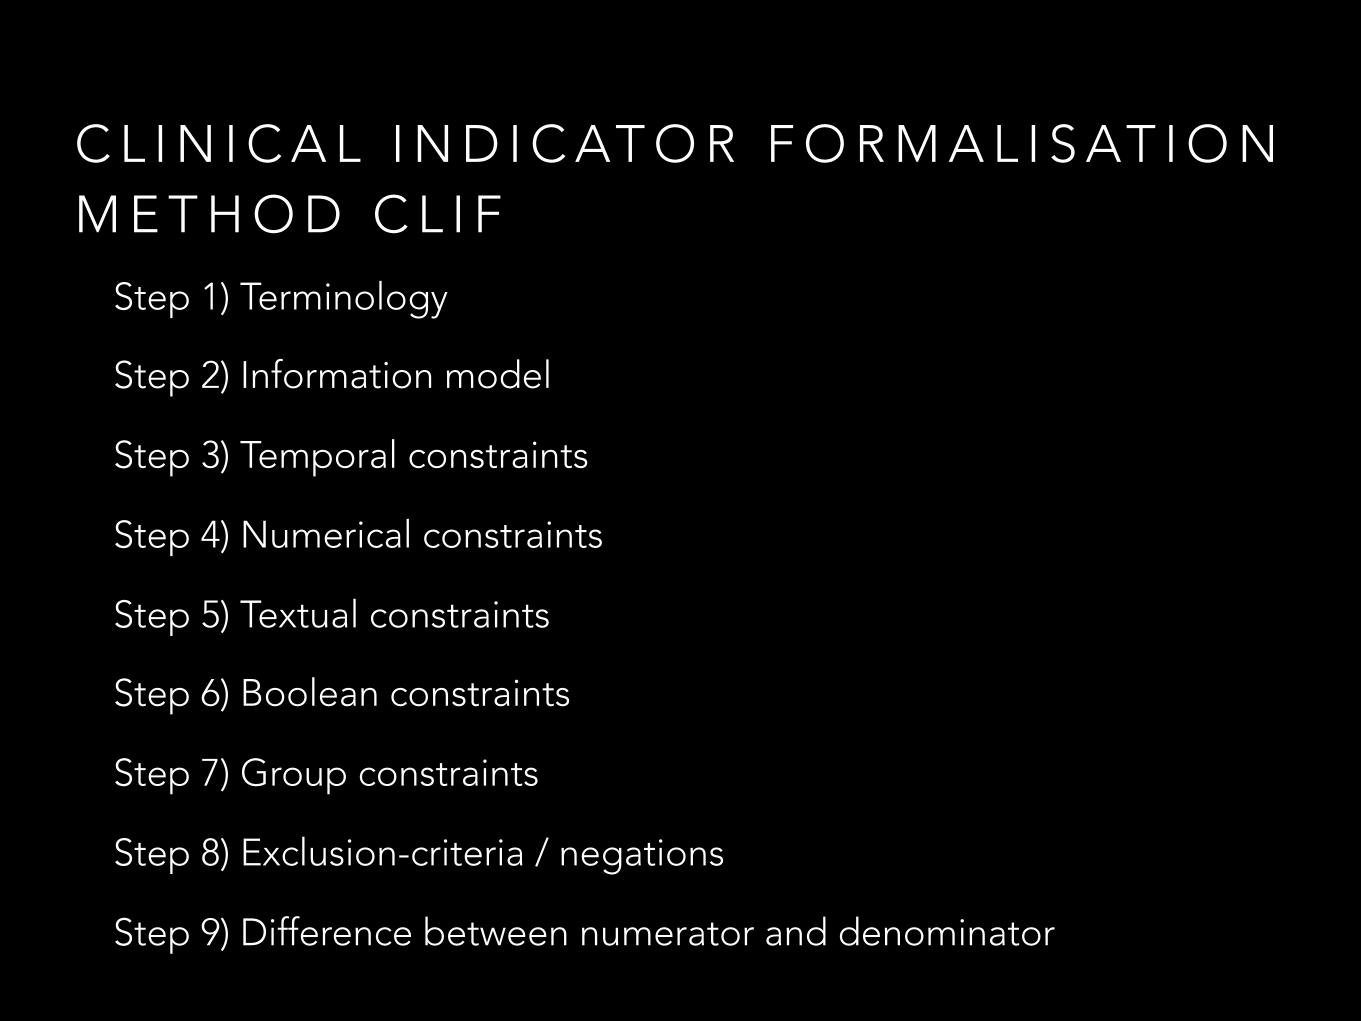
Step 1) Terminology
Step 2) Information model
Step 3) Temporal constraints
Step 4) Numerical constraints
Step 5) Textual constraints
Step 6) Boolean constraints
Step 7) Group constraints
Step 8) Exclusion-criteria / negations
Step 9) Difference between numerator and denominator
C L I N I C A L I N D I C AT O R F O R M A L I S AT I O N M E T H O D C L I F
C L I F T O O L
H T T P : / / C L I F T O O L . O R G / H T T P S : / / G I T H U B . C O M / K AT H R I N R I N / C L I F
• Freely available
• Can be connected to patient databases
• => excursion to website
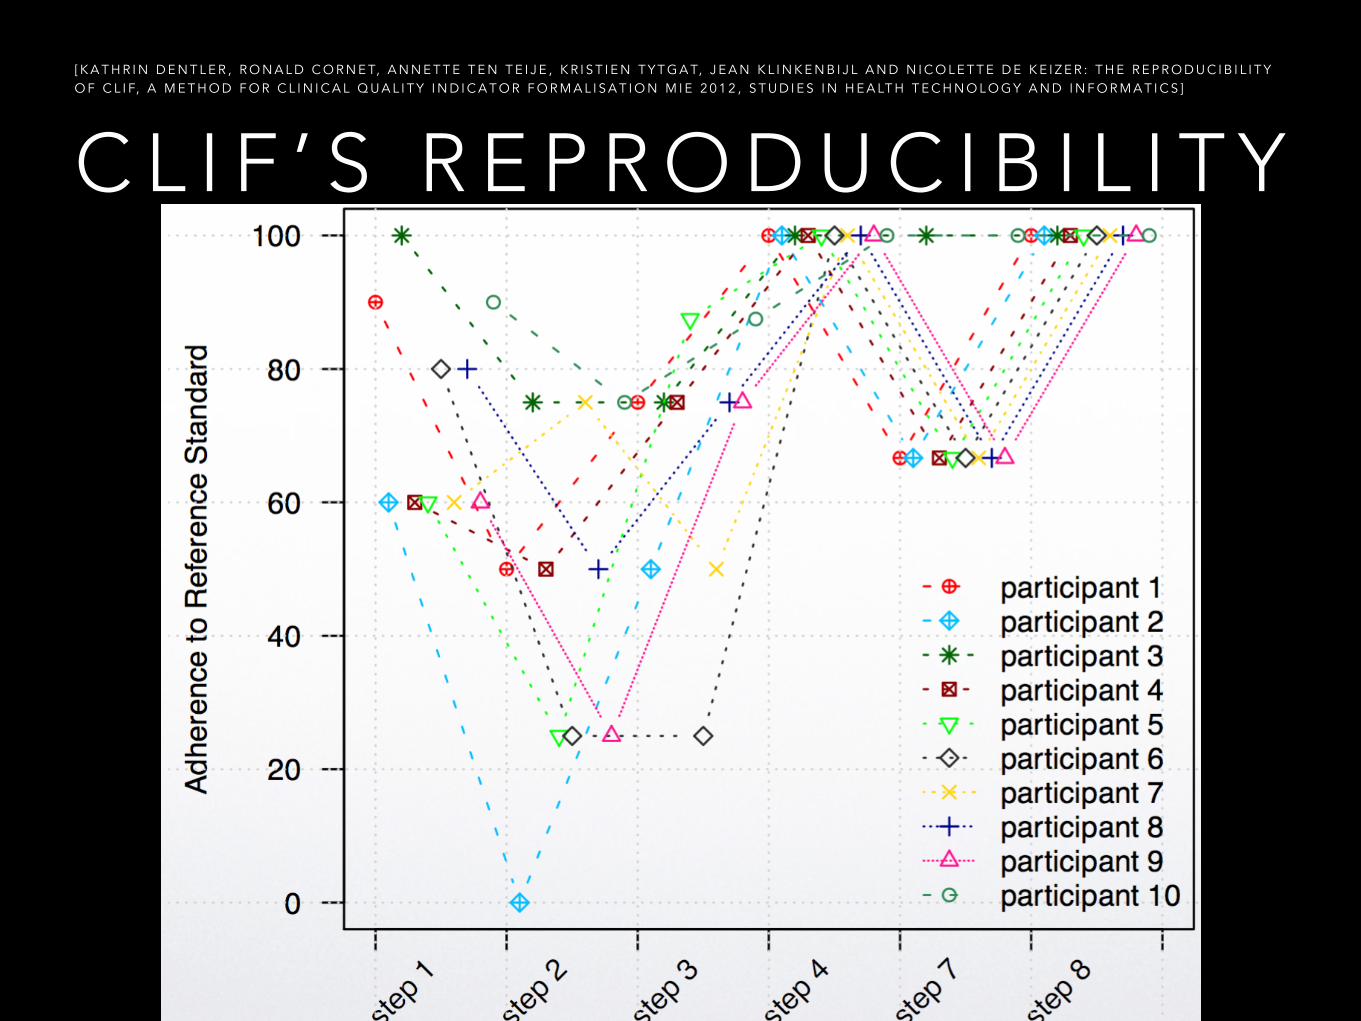
C L I F ’ S R E P R O D U C I B I L I T Y[ K A T H R I N D E N T L E R , R O N A L D C O R N E T, A N N E T T E T E N T E I J E , K R I S T I E N T Y T G A T, J E A N K L I N K E N B I J L A N D N I C O L E T T E D E K E I Z E R : T H E R E P R O D U C I B I L I T Y O F C L I F, A M E T H O D F O R C L I N I C A L Q U A L I T Y I N D I C A T O R F O R M A L I S A T I O N M I E 2 0 1 2 , S T U D I E S I N H E A LT H T E C H N O L O G Y A N D I N F O R M A T I C S ]
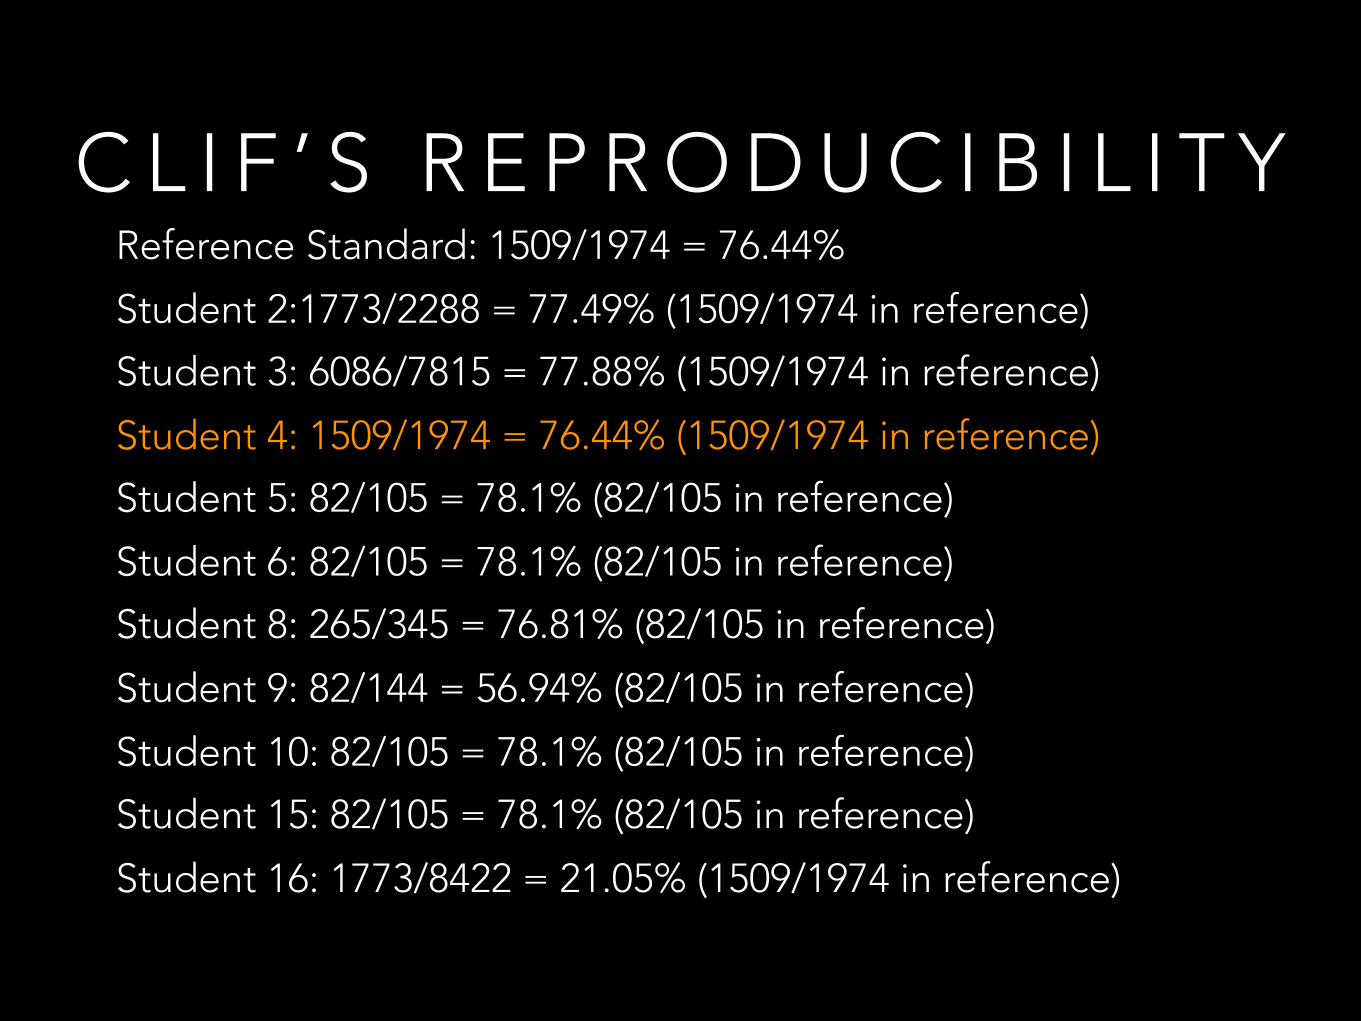
Reference Standard: 1509/1974 = 76.44%
Student 2:1773/2288 = 77.49% (1509/1974 in reference)
Student 3: 6086/7815 = 77.88% (1509/1974 in reference)
Student 4: 1509/1974 = 76.44% (1509/1974 in reference)
Student 5: 82/105 = 78.1% (82/105 in reference)
Student 6: 82/105 = 78.1% (82/105 in reference)
Student 8: 265/345 = 76.81% (82/105 in reference)
Student 9: 82/144 = 56.94% (82/105 in reference)
Student 10: 82/105 = 78.1% (82/105 in reference)
Student 15: 82/105 = 78.1% (82/105 in reference)
Student 16: 1773/8422 = 21.05% (1509/1974 in reference)
C L I F ’ S R E P R O D U C I B I L I T Y
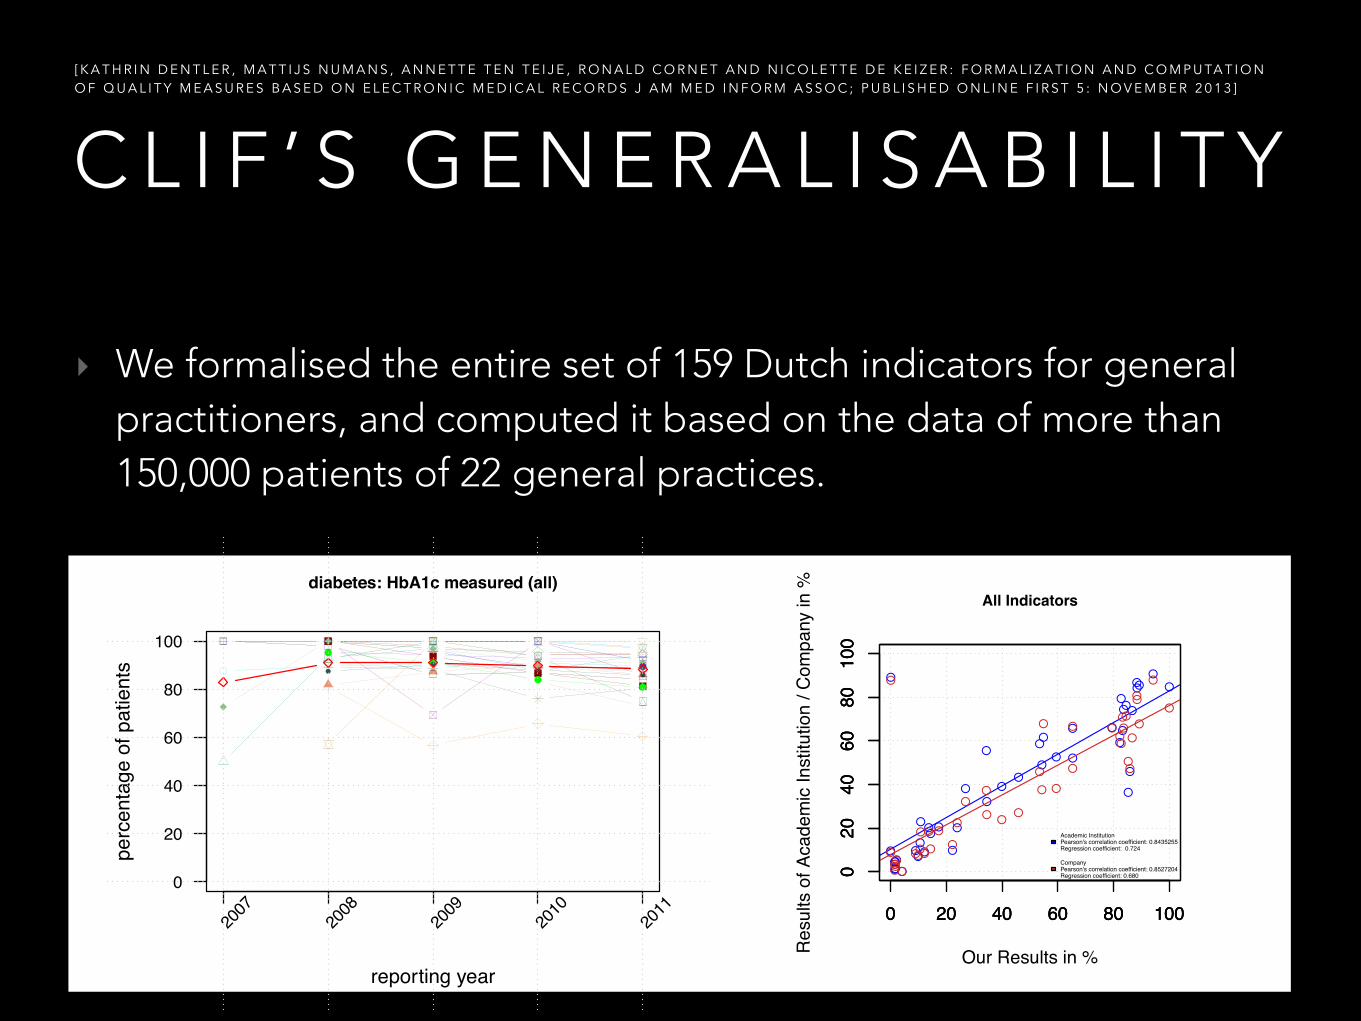
‣ We formalised the entire set of 159 Dutch indicators for general practitioners, and computed it based on the data of more than 150,000 patients of 22 general practices.
C L I F ’ S G E N E R A L I S A B I L I T Y [ K A T H R I N D E N T L E R , M A T T I J S N U M A N S , A N N E T T E T E N T E I J E , R O N A L D C O R N E T A N D N I C O L E T T E D E K E I Z E R : F O R M A L I Z A T I O N A N D C O M P U TA T I O N O F Q U A L I T Y M E A S U R E S B A S E D O N E L E C T R O N I C M E D I C A L R E C O R D S J A M M E D I N F O R M A S S O C ; P U B L I S H E D O N L I N E F I R S T 5 : N O V E M B E R 2 0 1 3 ]
●●
● ●● ● ● ●
● ●●
●●
●●
●●
●●
●●● ● ● ●
reporting year
perc
enta
ge o
f pat
ient
s
diabetes: HbA1c measured (all)
2007
2008
2009
2010
2011
0
20
40
60
80
100
0 20 40 60 80 100
020
4060
8010
0●
●
●
●●
●
●
●
●
●
●
●
●
●
●●
●
●●
●
●
●
●
●
●
●
●
●●
●
●
●●
● ●
●
●
●
●
●
●
●
●
0 20 40 60 80 100
020
4060
8010
0
Our Results in %Resu
lts o
f Aca
dem
ic In
stitu
tion
/ Com
pany
in %
●●
●
●●
●
●
●
●
●
●
●
●
●
● ●
●
●
●
●
●
●
●
●
●
●
●
●●
●
●
●
●
●●
●
●
●
●
●
●
●
●
0 20 40 60 80 100
020
4060
8010
0
All Indicators
Academic InstitutionPearson's correlation coefficient: 0.8435255Regression coefficient: 0.724
CompanyPearson's correlation coefficient: 0.8527204Regression coefficient: 0.680
C L I F ’ S ( R E - ) U S A B I L I T Y A N D G E N E R A L I S A B I L I T Y T O C H I N E S E PAT I E N T D ATA
• Assessment of healthcare quality is drawing attention; but mainly by structure- and outcome-related indicators => Can we also compute process-related quality indicators?
• We used 38 indicators from the Dutch Healthcare Inspectorate (2010): - 23 process-related- 10 outcome-related - 5 demographic
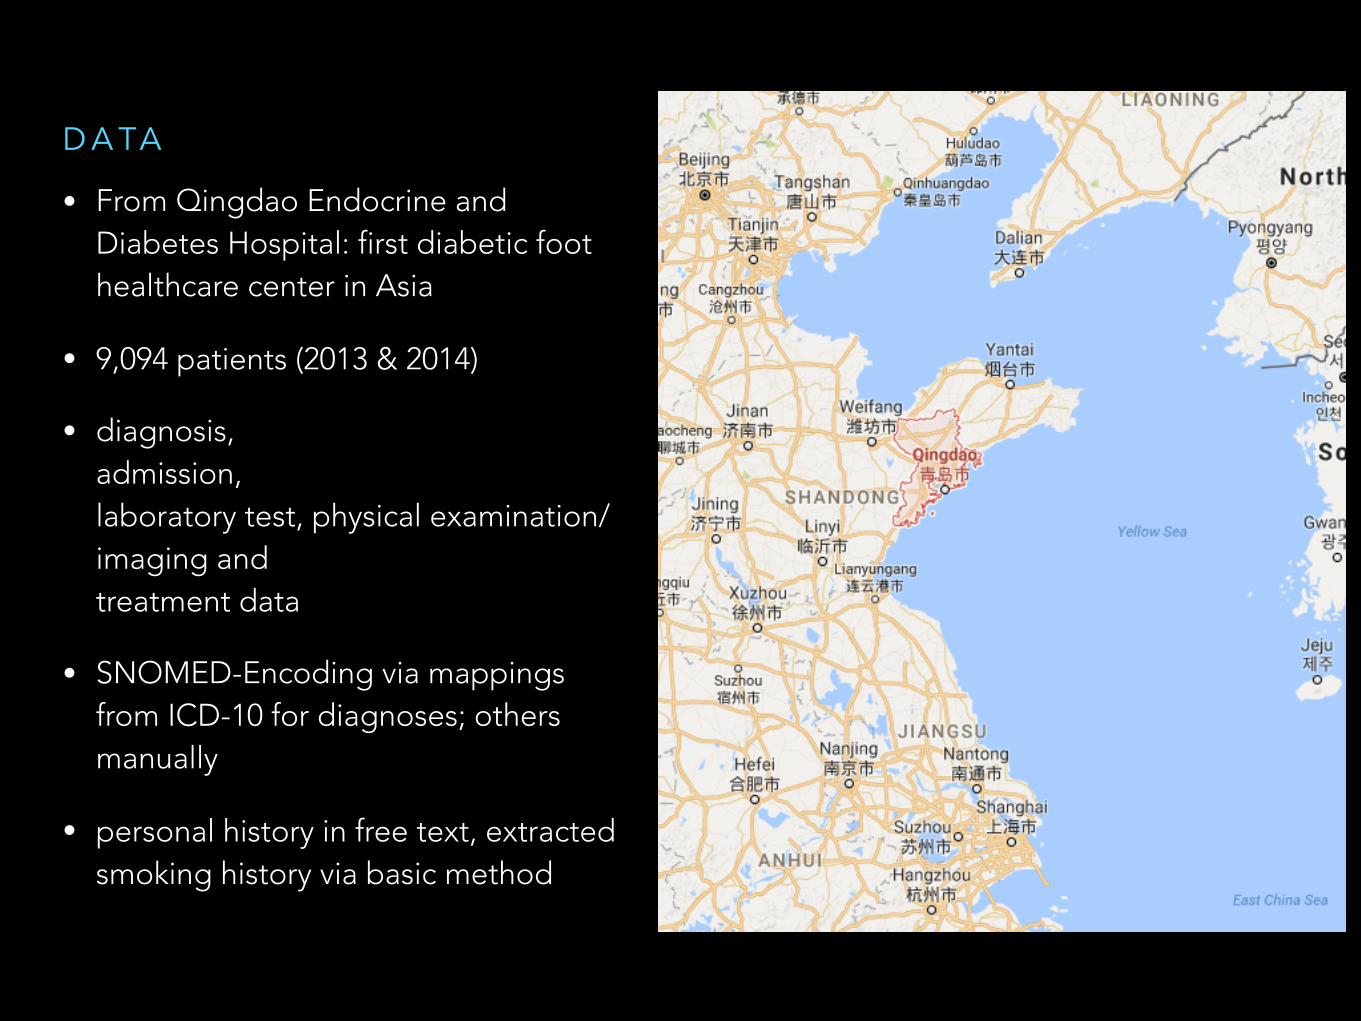
• From Qingdao Endocrine and Diabetes Hospital: first diabetic foot healthcare center in Asia
• 9,094 patients (2013 & 2014)
• diagnosis, admission, laboratory test, physical examination/imaging and treatment data
• SNOMED-Encoding via mappings from ICD-10 for diagnoses; others manually
• personal history in free text, extracted smoking history via basic method
D A TA
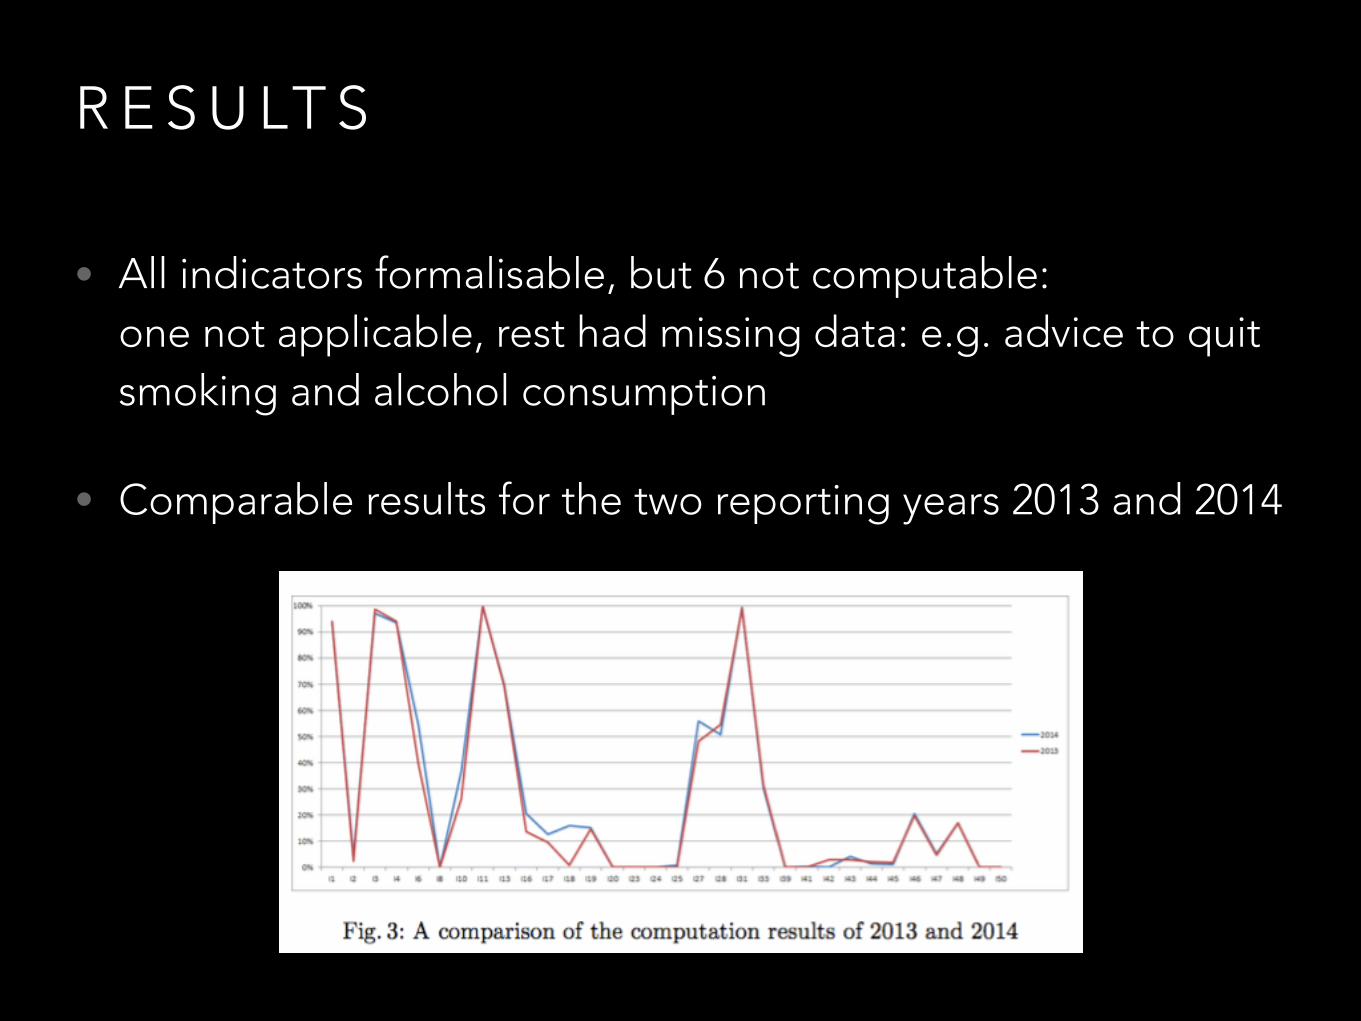
R E S U LT S
• All indicators formalisable, but 6 not computable: one not applicable, rest had missing data: e.g. advice to quit smoking and alcohol consumption
• Comparable results for the two reporting years 2013 and 2014
3 - F O L D E VA L U AT I O N : 1 ) C O M PA R I S O N T O C H I N E S E G U I D E L I N E S
• only 54% patients had HbA1c measured; according to the guideline it should be 100%
• treatment according to the guideline
3 - F O L D E VA L U AT I O N : 2 ) E X P E R T R E V I E W
• Some data not recorded, e.g. foot and funds examinations; therefore misleading indicator results
• Treatment with anti-diabetic drugs lower than expected due to treatment with traditional Chinese medicine which is not classified as oral anti-diabetic drug by SNOMED CT
3 - F O L D E VA L U AT I O N : 3 ) C O M PA R I S O N T O R E S U LT S B A S E D O N D U T C H D ATA
• Negatively correlated
• Possible explanations: - hospital (acute) vs. general practices (chronic) (- different guidelines) (- missing data)(- traditional medicine)

C O N C L U S I O N S
• In this experiment, CLIF was (re-) usable and generalisable to Chinese patient data
• Most of the non-computable indicators were process-related
• Automated computation of indicators feasible to some degree, but much can be improved: - recording of relevant data - encoded in standard terminologies- represented in meaningful data structure- indicators derived by Chinese guidelines
• Current project: try to compute indicators by exploiting additional free text