Embed Size (px)
Citation preview

INTERNAL QUALITY CONTROL
PRESENTED BYSYED BASHEER UDDIN
WHAT IS QUALITY CONTROL Quality control in the medical laboratory is a statistical process used
to monitor and evaluate the analytical process which produces patient results. The purpose of quality control system is to monitor analytic processes, detect analytic errors during analysis and prevent the reporting of incorrect patient results.
Trend: A gradual, often subtle, increase or decrease in control values and possibly patient values.
26-May
27-May
28-May
29-May
30-May
31-May
1-Jun2-Jun3-Jun4-Jun5-Jun6-Jun7-Jun8-Jun9-Jun10-Jun11-Jun12-Jun13-Jun14-Jun15-Jun16-Jun17-Jun18-Jun19-Jun20-Jun21-Jun22-Jun23-Jun24-Jun25-Jun
6.6
6.8
7
7.2
7.4
7.6
7.8
Levey Jennings ChartSeries1Series2Series3Series4Series5Series6Series7Series8
Axis Title
QUALITY CONTROL
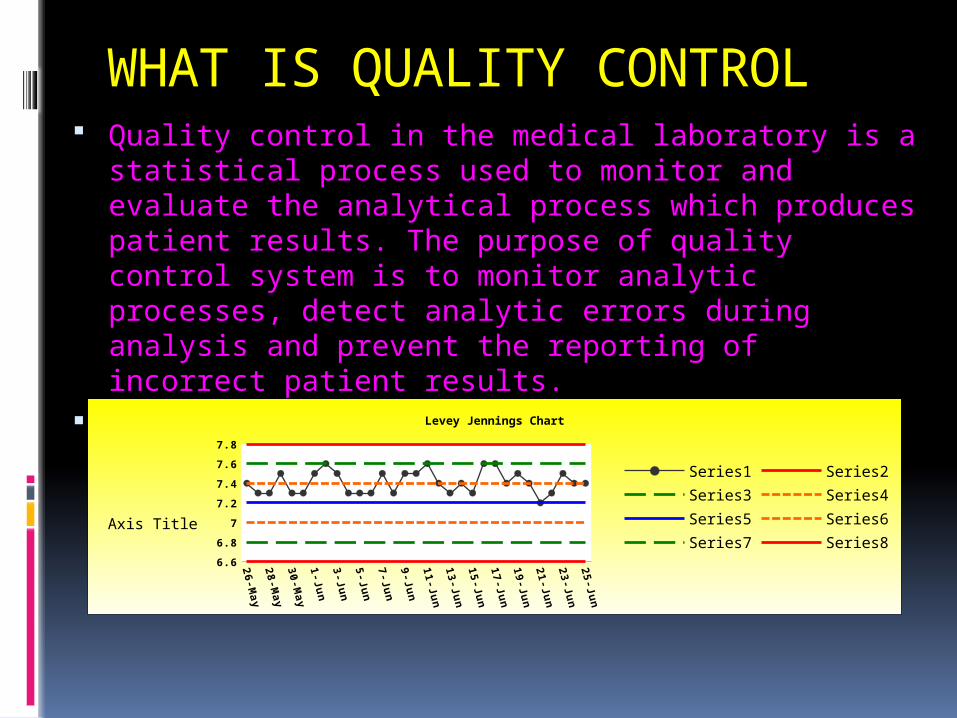
Accuracy of Measurement: Closeness of agreement between the result of a measurement and a true value of a measurand.
Analyte: A substance or constituent for which the laboratory conducts testing.
Bias: The systematic deviation of the test results from the accepted reference value.
Calibration: Calibration is the set of operations that establish, under specified conditions, the relationship between reagent system/instrument response and the corresponding concentration/activity values of an analyte.
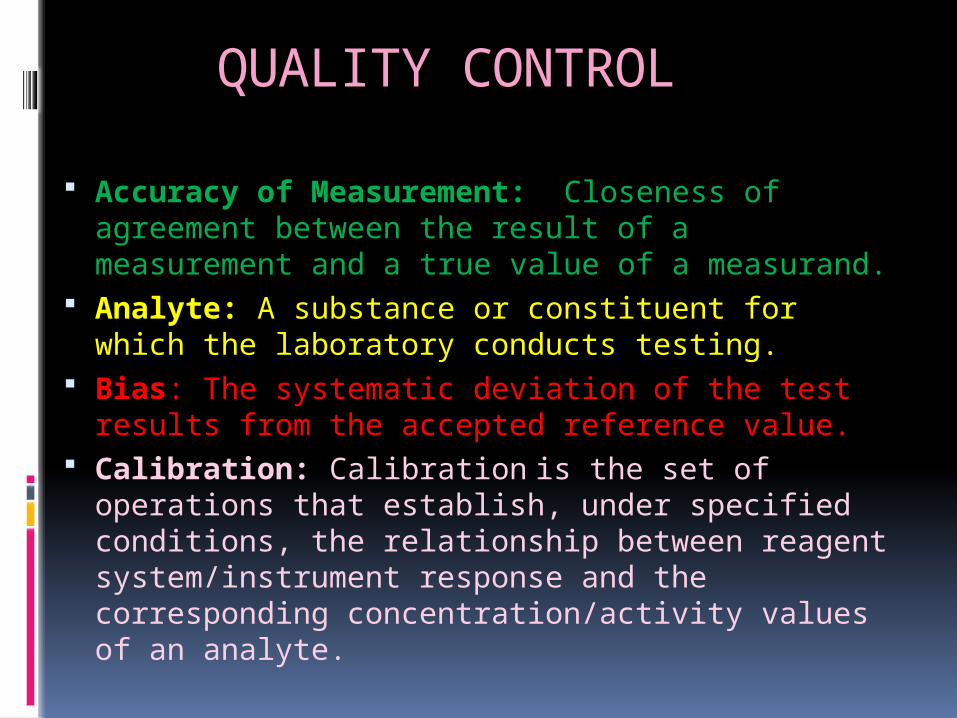
QUALITY CONTROL Calibration Verification: Denotes the process of confirming that the
current calibration settings remain valid for a method. Coefficient of Variation (CV %): The Coefficient of Variation is the
ratio of the standard deviation to the mean and is expressed as percentage.
Imprecision: The random dispersion of a set of replicate measurements and/or values expressed quantitatively by a statistic such as standard deviation or coefficient of variation.
Mean: The mean of a group of data points is simply their arithmetic average.
Precision: Closeness of agreement between indications or measured quantity values obtained by replicate measurements on the same or similar objects under specified conditions.
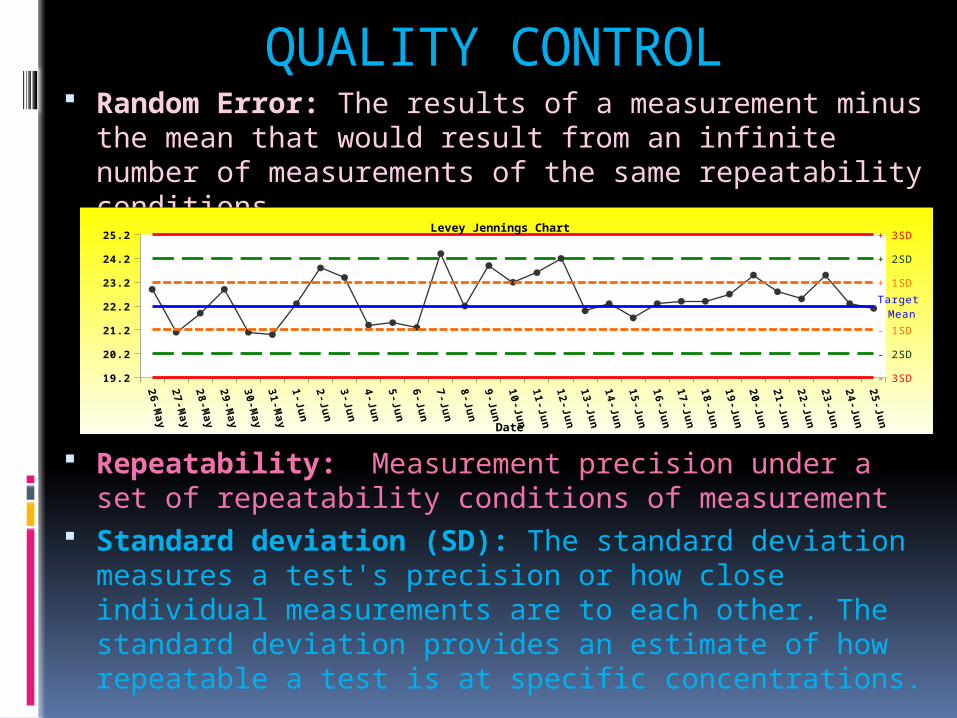
QUALITY CONTROL Random Error: The results of a measurement minus the mean
that would result from an infinite number of measurements of the same repeatability conditions.
Repeatability: Measurement precision under a set of repeatability conditions of measurement
Standard deviation (SD): The standard deviation measures a test's precision or how close individual measurements are to each other. The standard deviation provides an estimate of how repeatable a test is at specific concentrations.
26-May
27-May
28-May
29-May
30-May
31-May
1-Jun2-Jun3-Jun4-Jun5-Jun6-Jun7-Jun8-Jun9-Jun10-Jun11-Jun12-Jun13-Jun14-Jun15-Jun16-Jun17-Jun18-Jun19-Jun20-Jun21-Jun22-Jun23-Jun24-Jun25-Jun
19.2
20.2
21.2
22.2
23.2
24.2
25.2 + 3SD
+ 2SD
+ 1SD
Target Mean
- 1SD
- 2SD
- 3SD
Levey Jennings Chart
Date
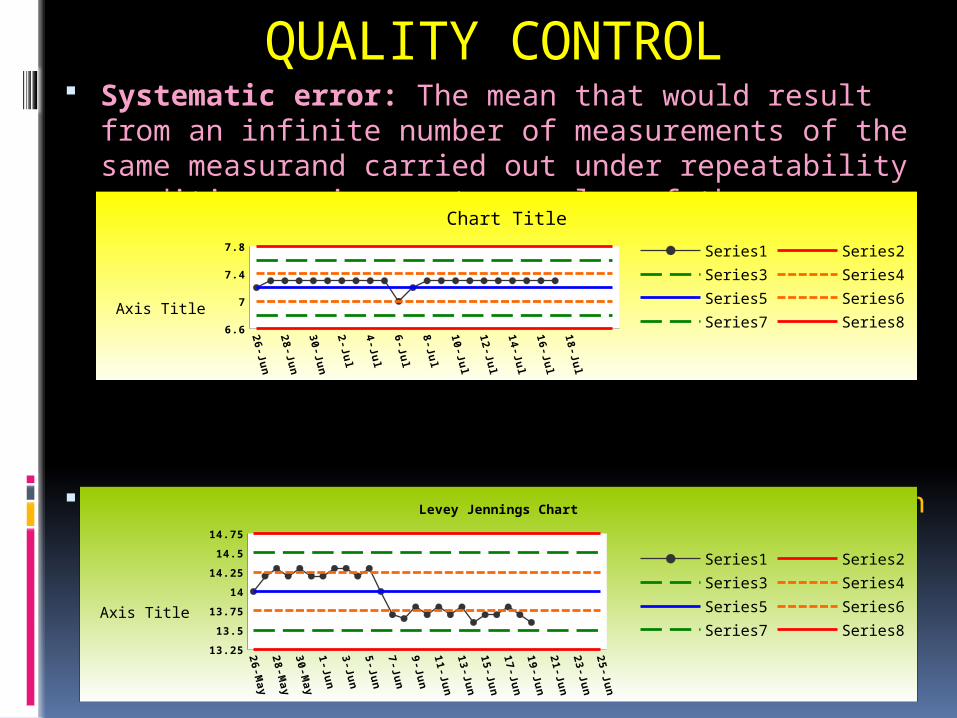
QUALITY CONTROL Systematic error: The mean that would result from an infinite
number of measurements of the same measurand carried out under repeatability conditions, minus a true value of the measurand.
Shift: A sudden and eventually stable change in control values and possibly patient values.
26-Jun27-Jun28-Jun29-Jun30-Jun1-Jul2-Jul3-Jul4-Jul5-Jul6-Jul7-Jul8-Jul9-Jul10-Jul11-Jul12-Jul13-Jul14-Jul15-Jul16-Jul17-Jul18-Jul
6.66.8
77.27.47.67.8
Chart Title
Series1 Series2Series3 Series4Series5 Series6Series7 Series8
Axis Title
26-May
27-May
28-May
29-May
30-May
31-May
1-Jun2-Jun3-Jun4-Jun5-Jun6-Jun7-Jun8-Jun9-Jun10-Jun11-Jun12-Jun13-Jun14-Jun15-Jun16-Jun17-Jun18-Jun19-Jun20-Jun21-Jun22-Jun23-Jun24-Jun25-Jun
13.25
13.5
13.75
14
14.25
14.5
14.75
Levey Jennings ChartSeries1Series2Series3Series4Series5Series6Series7Series8
Axis Title
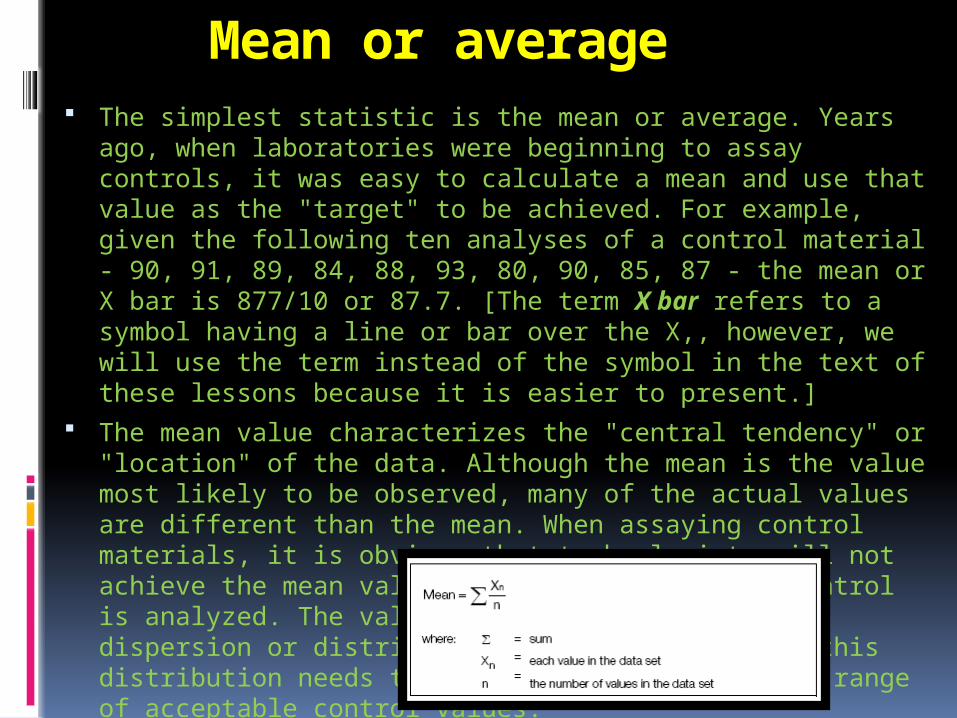
Mean or average The simplest statistic is the mean or average. Years ago, when laboratories
were beginning to assay controls, it was easy to calculate a mean and use that value as the "target" to be achieved. For example, given the following ten analyses of a control material - 90, 91, 89, 84, 88, 93, 80, 90, 85, 87 - the mean or X bar is 877/10 or 87.7. [The term X bar refers to a symbol having a line or bar over the X,, however, we will use the term instead of the symbol in the text of these lessons because it is easier to present.]
The mean value characterizes the "central tendency" or "location" of the data. Although the mean is the value most likely to be observed, many of the actual values are different than the mean. When assaying control materials, it is obvious that technologists will not achieve the mean value each and every time a control is analyzed. The values observed will show a dispersion or distribution about the mean, and this distribution needs to be characterized to set a range of acceptable control values.
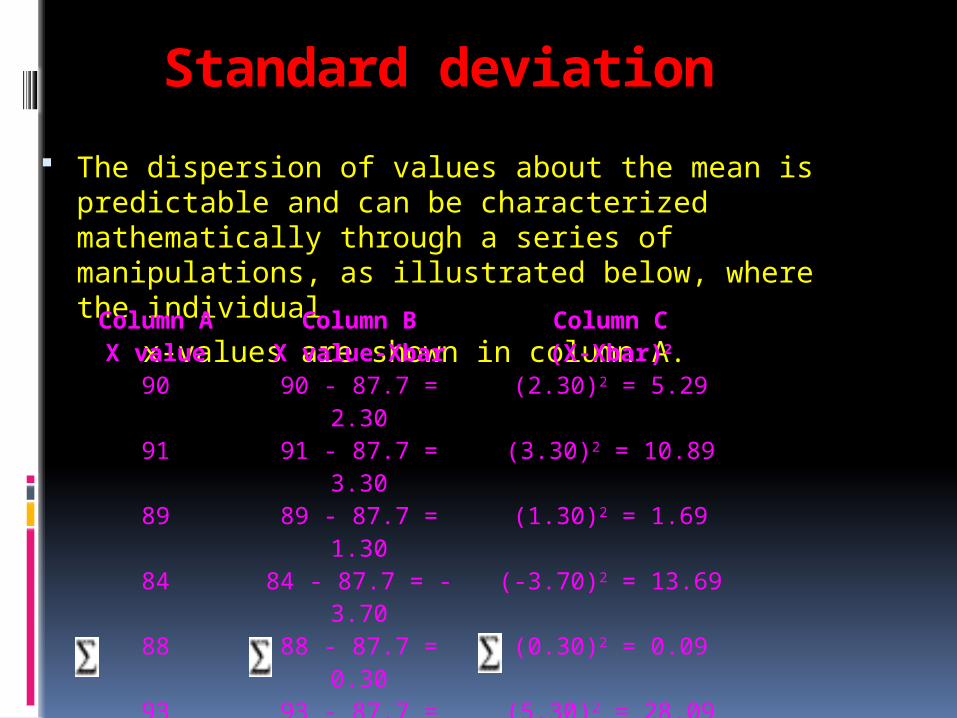
Standard deviation The dispersion of values about the mean is predictable and can
be characterized mathematically through a series of manipulations, as illustrated below, where the individual
x-values are shown in column A.Column A Column B Column CX value X value-Xbar (X-Xbar)2
90 90 - 87.7 = 2.30 (2.30)2 = 5.2991 91 - 87.7 = 3.30 (3.30)2 = 10.8989 89 - 87.7 = 1.30 (1.30)2 = 1.6984 84 - 87.7 = -3.70 (-3.70)2 = 13.6988 88 - 87.7 = 0.30 (0.30)2 = 0.0993 93 - 87.7 = 5.30 (5.30)2 = 28.0980 80 - 87.7 = -7.70 (-7.70)2 = 59.2990 90 - 87.7 = 2.30 (2.30)2 = 5.2985 85 - 87.7 = -2.70 (-2.70)2 = 7.2987 87 - 87.7 = -0.70 (-0.70)2 = 0.49
X = 877 (X-Xbar) = 0 (X-Xbar)² = 132.10
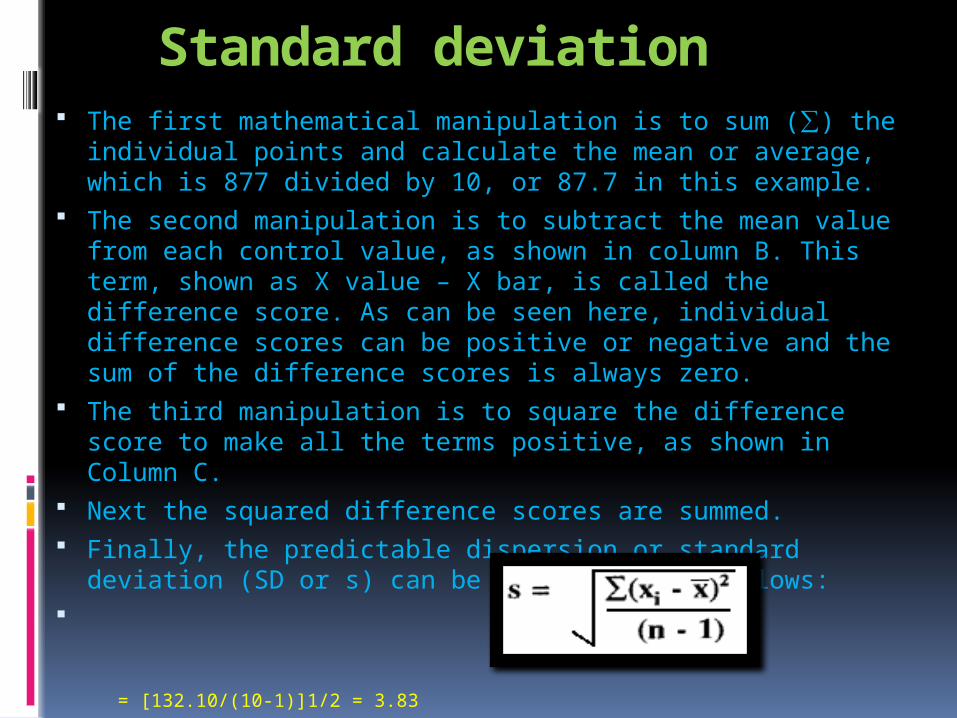
Standard deviation The first mathematical manipulation is to sum (∑) the individual
points and calculate the mean or average, which is 877 divided by 10, or 87.7 in this example.
The second manipulation is to subtract the mean value from each control value, as shown in column B. This term, shown as X value – X bar, is called the difference score. As can be seen here, individual difference scores can be positive or negative and the sum of the difference scores is always zero.
The third manipulation is to square the difference score to make all the terms positive, as shown in Column C.
Next the squared difference scores are summed. Finally, the predictable dispersion or standard deviation (SD or s) can
be calculated as follows:
= [132.10/(10-1)]1/2 = 3.83
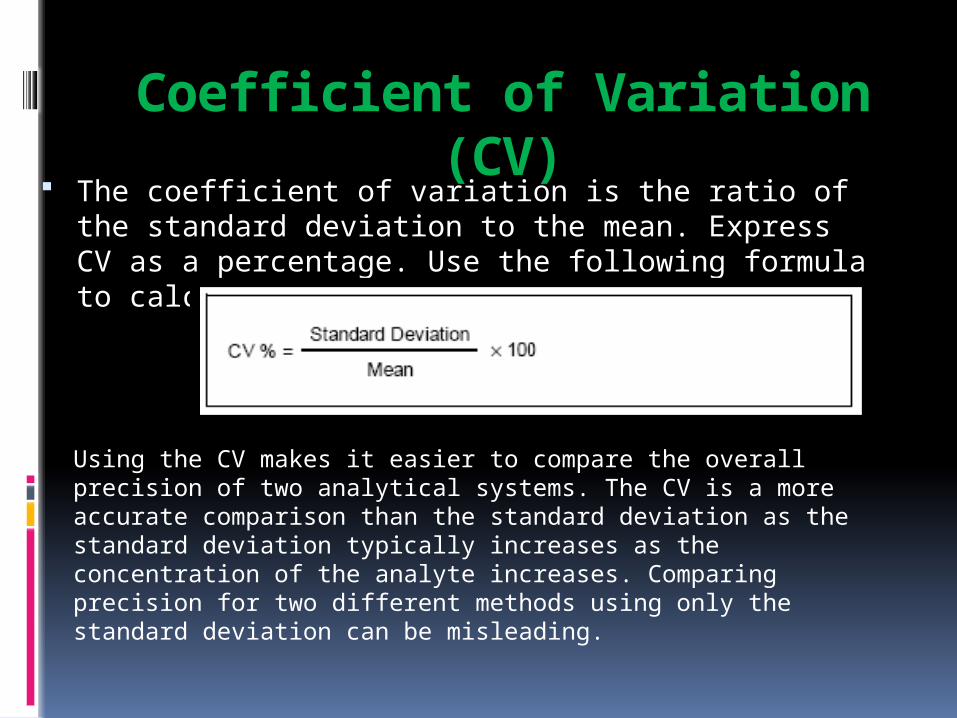
Coefficient of Variation (CV) The coefficient of variation is the ratio of the standard deviation to
the mean. Express CV as a percentage. Use the following formula to calculate the CV:
Using the CV makes it easier to compare the overall precision of two analytical systems. The CV is a more accurate comparison than the standard deviation as the standard deviation typically increases as the concentration of the analyte increases. Comparing precision for two different methods using only the standard deviation can be misleading.
Standard Deviation Index (SDI) or z-score
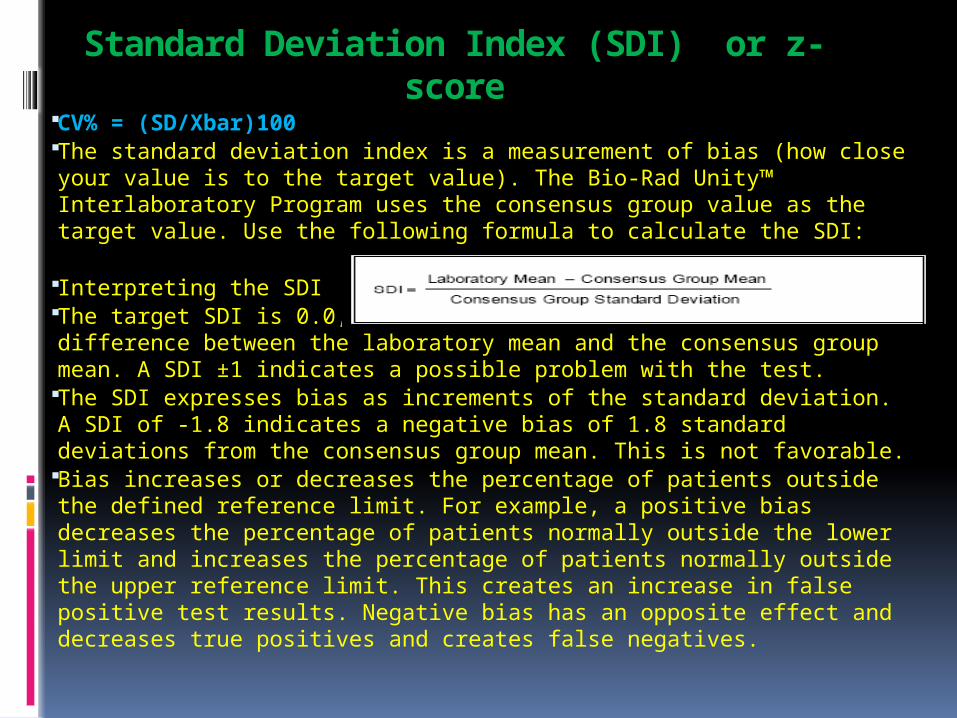
CV% = (SD/Xbar)100 The standard deviation index is a measurement of bias (how close your value is
to the target value). The Bio-Rad Unity™ Interlaboratory Program uses the consensus group value as the target value. Use the following formula to calculate the SDI:
Interpreting the SDI The target SDI is 0.0, which indicates there is not any difference between the
laboratory mean and the consensus group mean. A SDI ±1 indicates a possible problem with the test.
The SDI expresses bias as increments of the standard deviation. A SDI of -1.8 indicates a negative bias of 1.8 standard deviations from the consensus group mean. This is not favorable.
Bias increases or decreases the percentage of patients outside the defined reference limit. For example, a positive bias decreases the percentage of patients normally outside the lower limit and increases the percentage of patients normally outside the upper reference limit. This creates an increase in false positive test results. Negative bias has an opposite effect and decreases true positives and creates false negatives.
Standard Deviation Index (SDI) or z-score
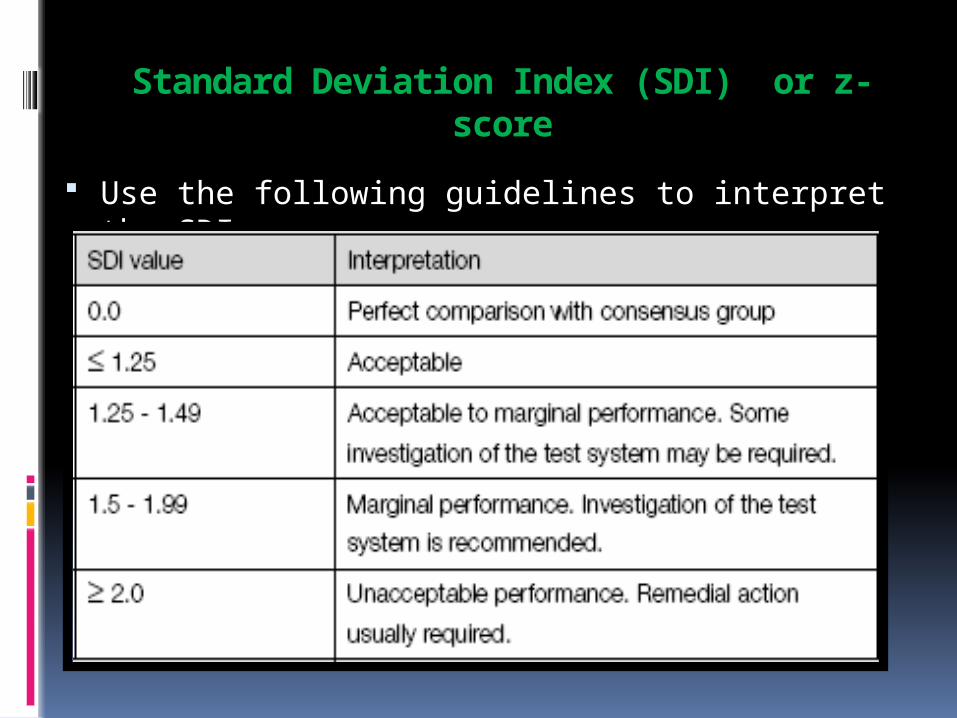
Use the following guidelines to interpret the SDI:
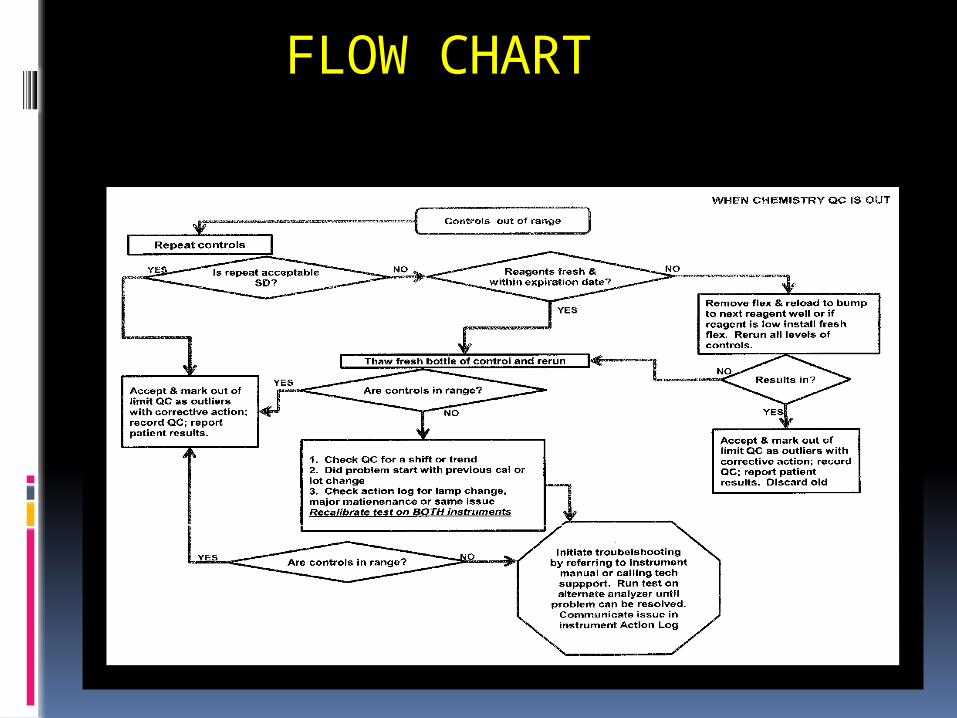
FLOW CHART
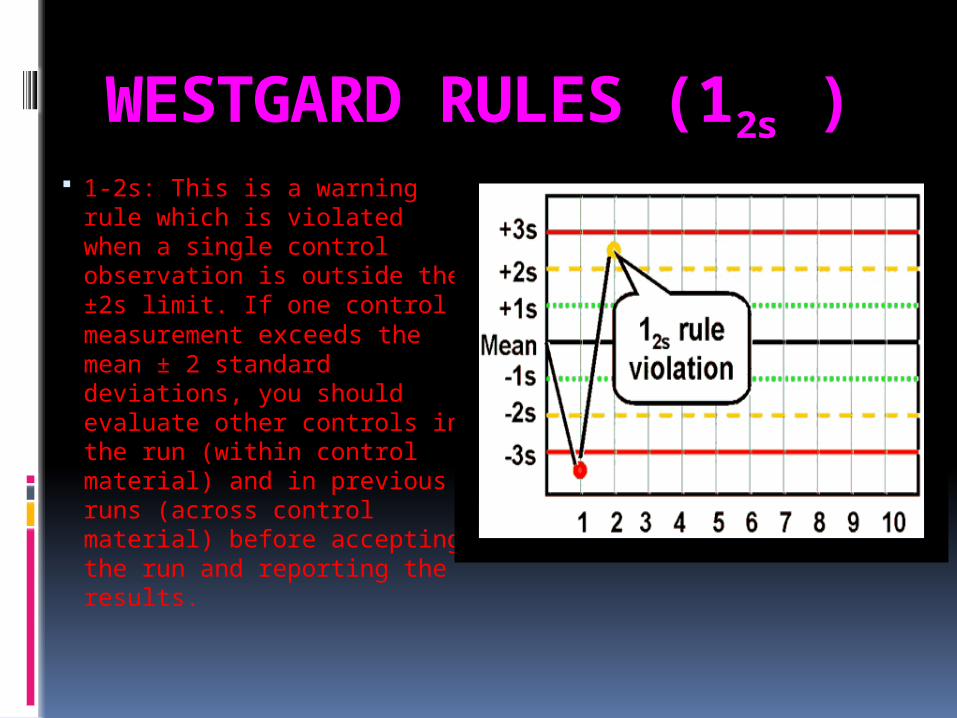
WESTGARD RULES (12s ) 1-2s: This is a warning rule
which is violated when a single control observation is outside the ±2s limit. If one control measurement exceeds the mean ± 2 standard deviations, you should evaluate other controls in the run (within control material) and in previous runs (across control material) before accepting the run and reporting the results.
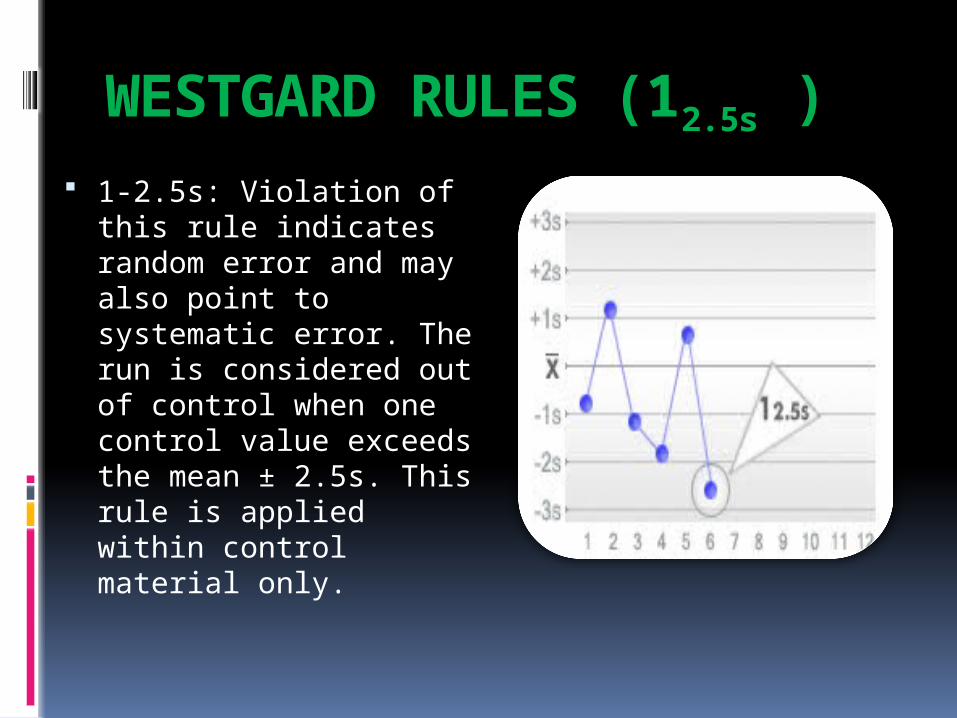
WESTGARD RULES (12.5s ) 1-2.5s: Violation of this rule
indicates random error and may also point to systematic error. The run is considered out of control when one control value exceeds the mean ± 2.5s. This rule is applied within control material only.
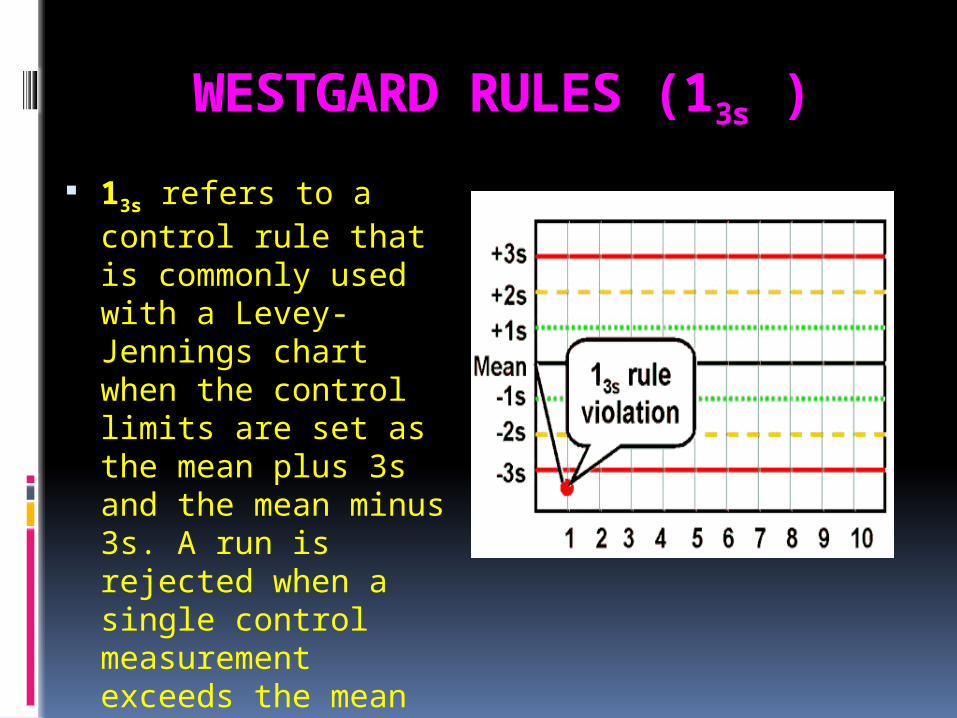
WESTGARD RULES (13s )
13s refers to a control rule that is commonly used with a Levey-Jennings chart when the control limits are set as the mean plus 3s and the mean minus 3s. A run is rejected when a single control measurement exceeds the mean plus 3s or the mean minus 3s control limit.
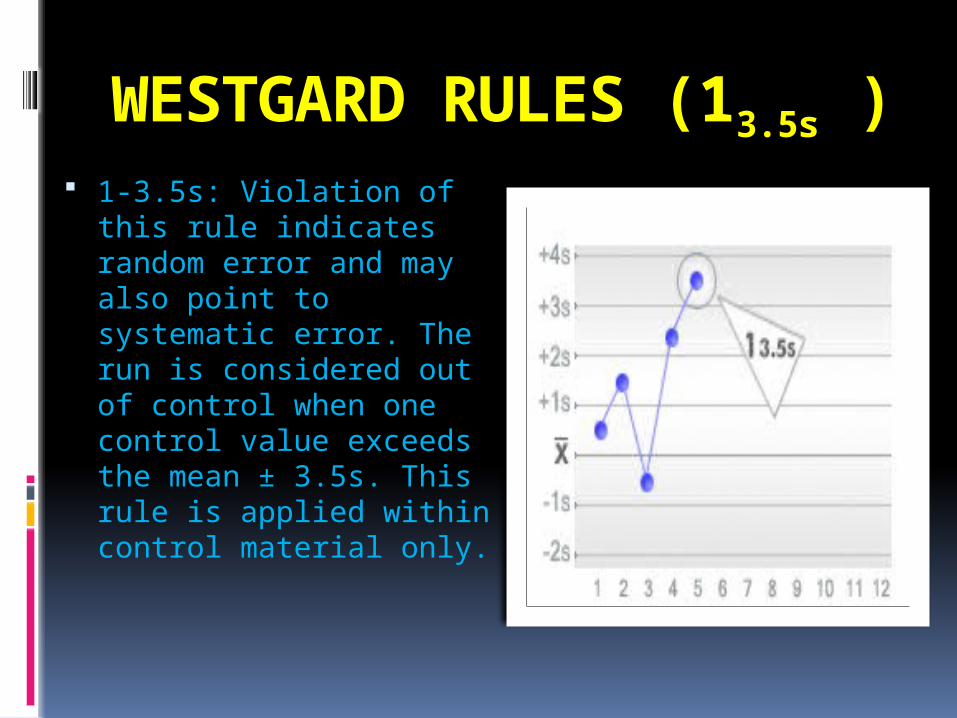
WESTGARD RULES (13.5s ) 1-3.5s: Violation of this rule
indicates random error and may also point to systematic error. The run is considered out of control when one control value exceeds the mean ± 3.5s. This rule is applied within control material only.
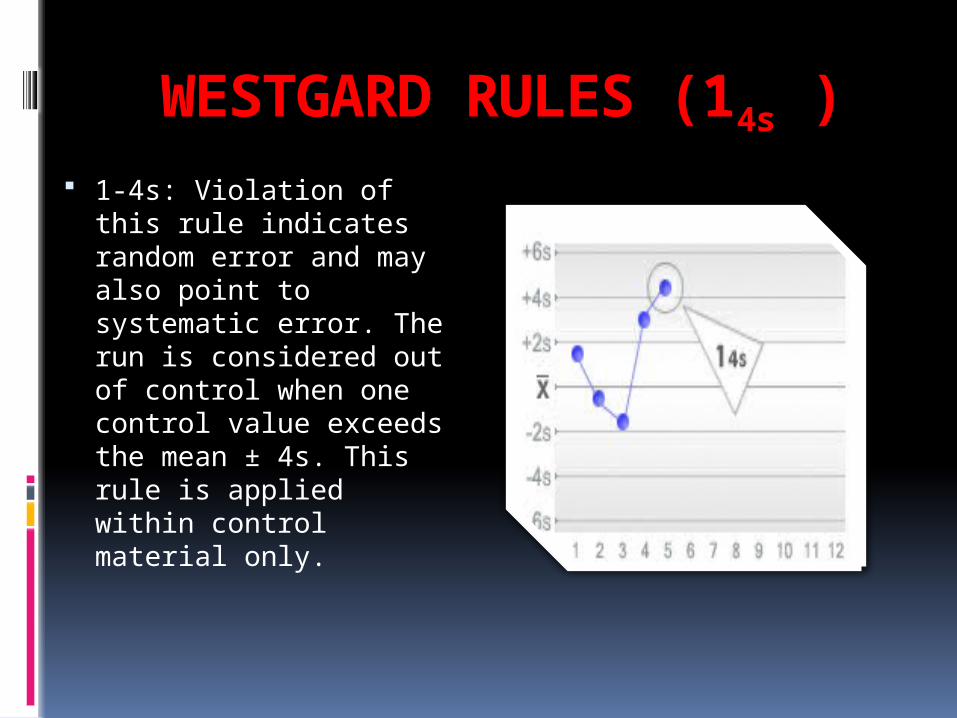
WESTGARD RULES (14s ) 1-4s: Violation of this rule
indicates random error and may also point to systematic error. The run is considered out of control when one control value exceeds the mean ± 4s. This rule is applied within control material only.
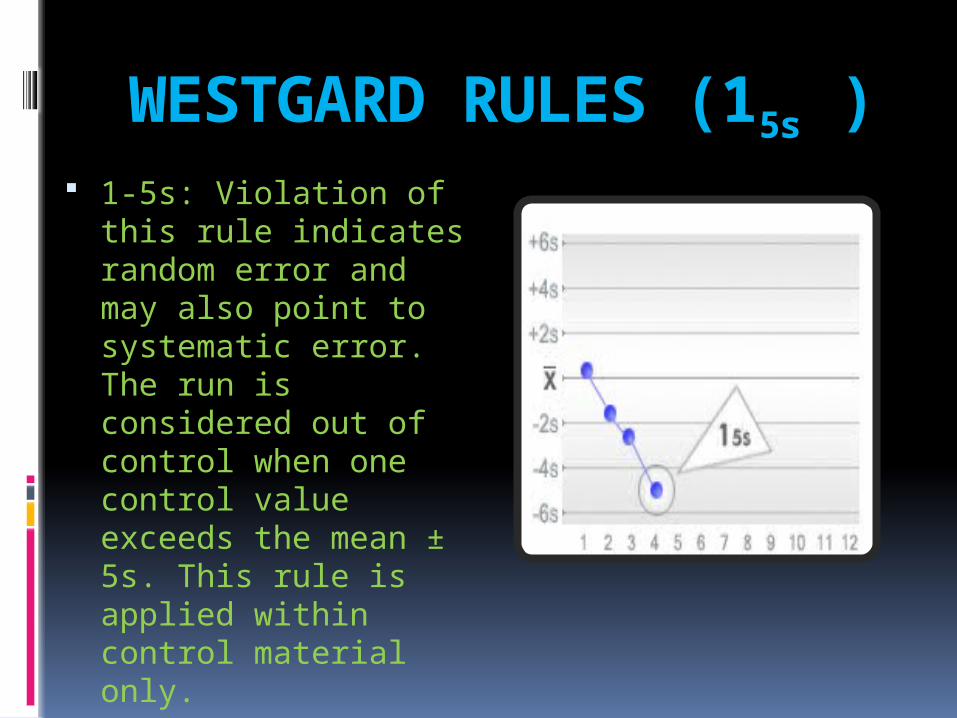
WESTGARD RULES (15s ) 1-5s: Violation of this rule
indicates random error and may also point to systematic error. The run is considered out of control when one control value exceeds the mean ± 5s. This rule is applied within control material only.
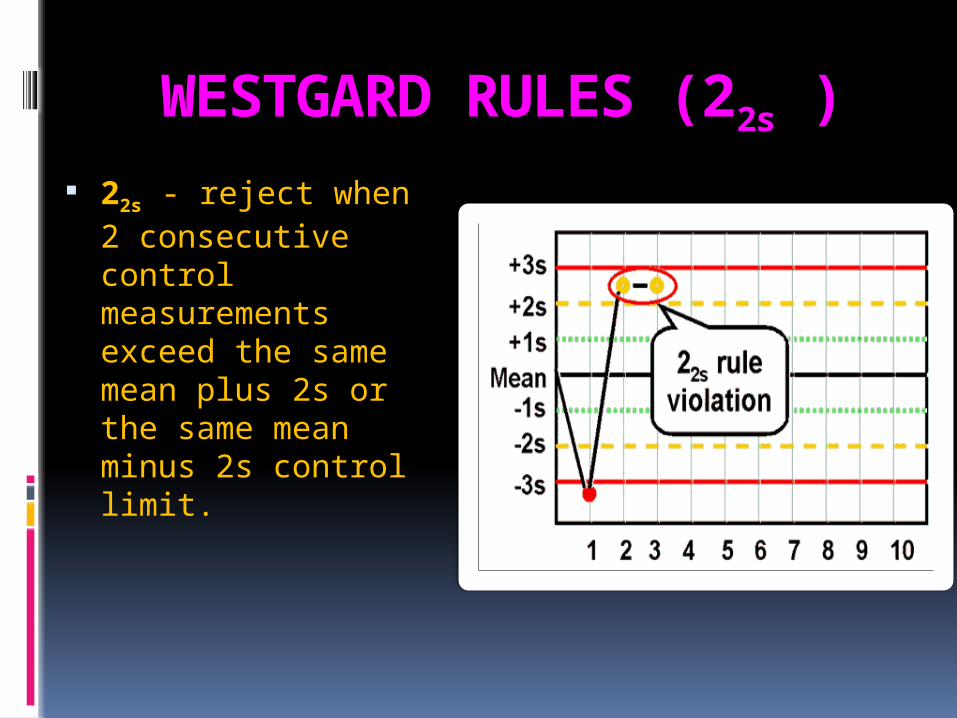
WESTGARD RULES (22s ) 22s - reject when 2
consecutive control measurements exceed the same mean plus 2s or the same mean minus 2s control limit.
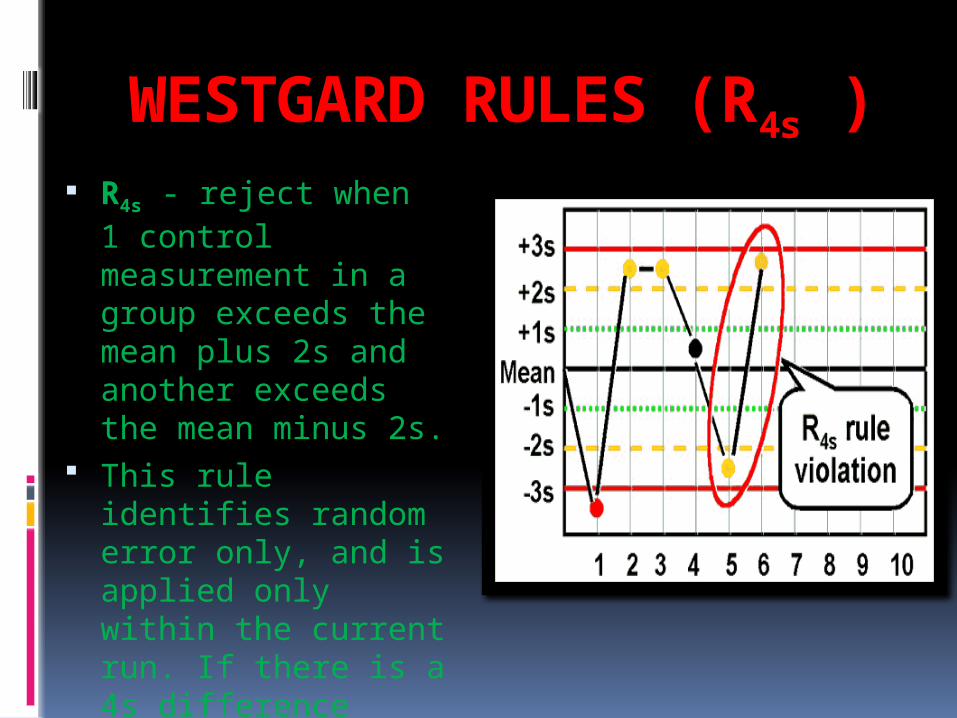
WESTGARD RULES (R4s ) R4s - reject when 1 control
measurement in a group exceeds the mean plus 2s and another exceeds the mean minus 2s.
This rule identifies random error only, and is applied only within the current run. If there is a 4s difference between control values within a single run, the rule is violated for random error.
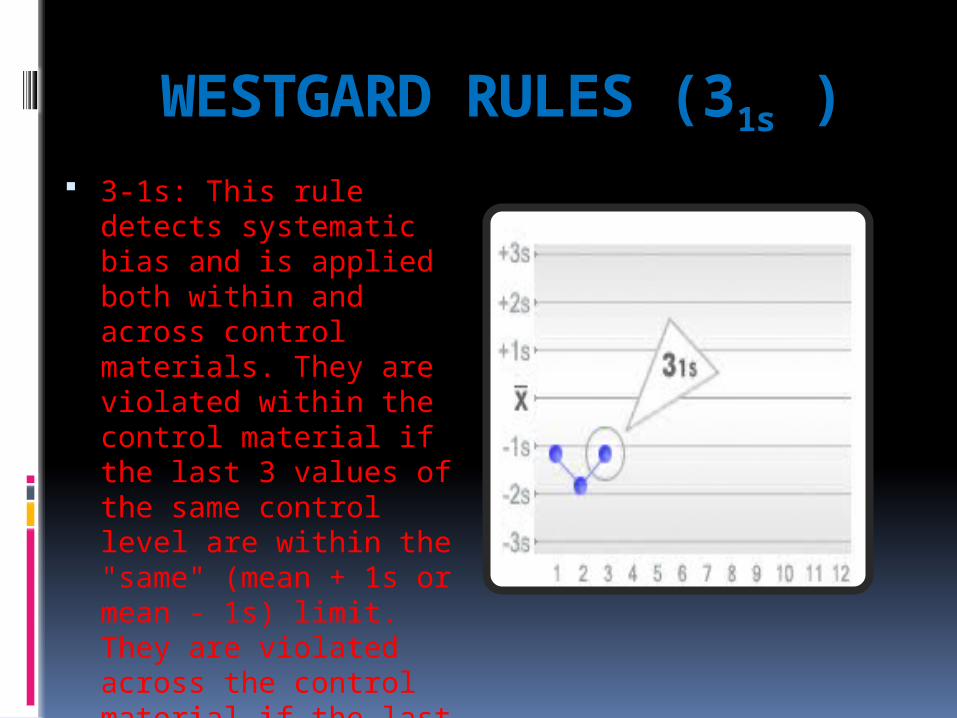
WESTGARD RULES (31s ) 3-1s: This rule detects
systematic bias and is applied both within and across control materials. They are violated within the control material if the last 3 values of the same control level are within the "same" (mean + 1s or mean - 1s) limit. They are violated across the control material if the last 3 consecutive control values for different control levels are within the "same" (mean + 1s or mean - 1s) limit.
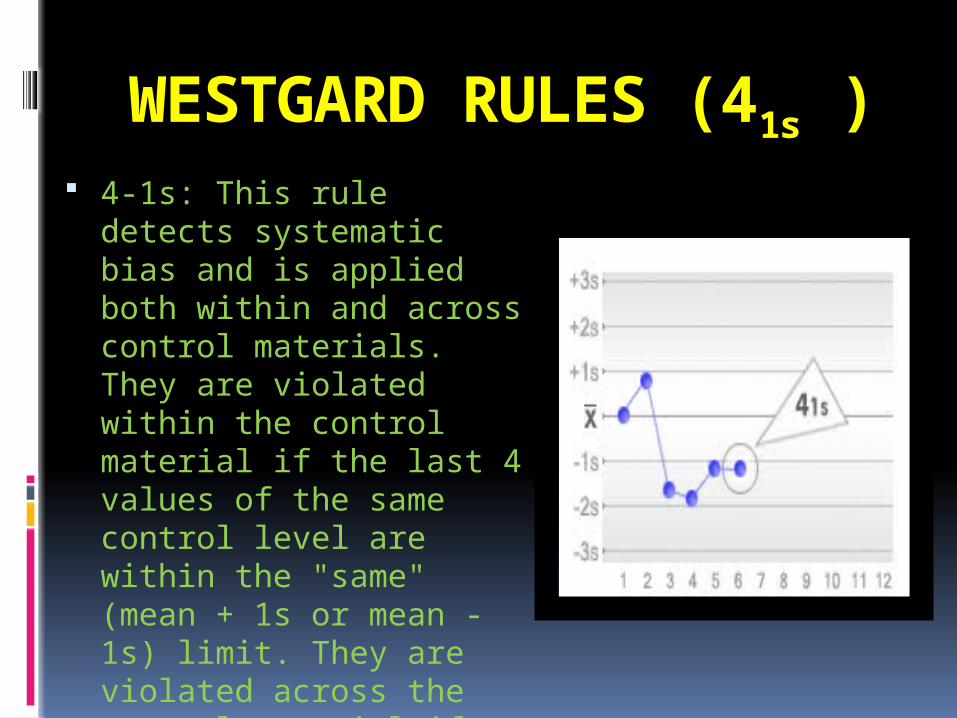
WESTGARD RULES (41s ) 4-1s: This rule detects systematic
bias and is applied both within and across control materials. They are violated within the control material if the last 4 values of the same control level are within the "same" (mean + 1s or mean - 1s) limit. They are violated across the control material if the last 4 consecutive control values for different control levels are within the "same" (mean + 1s or mean - 1s) limit.
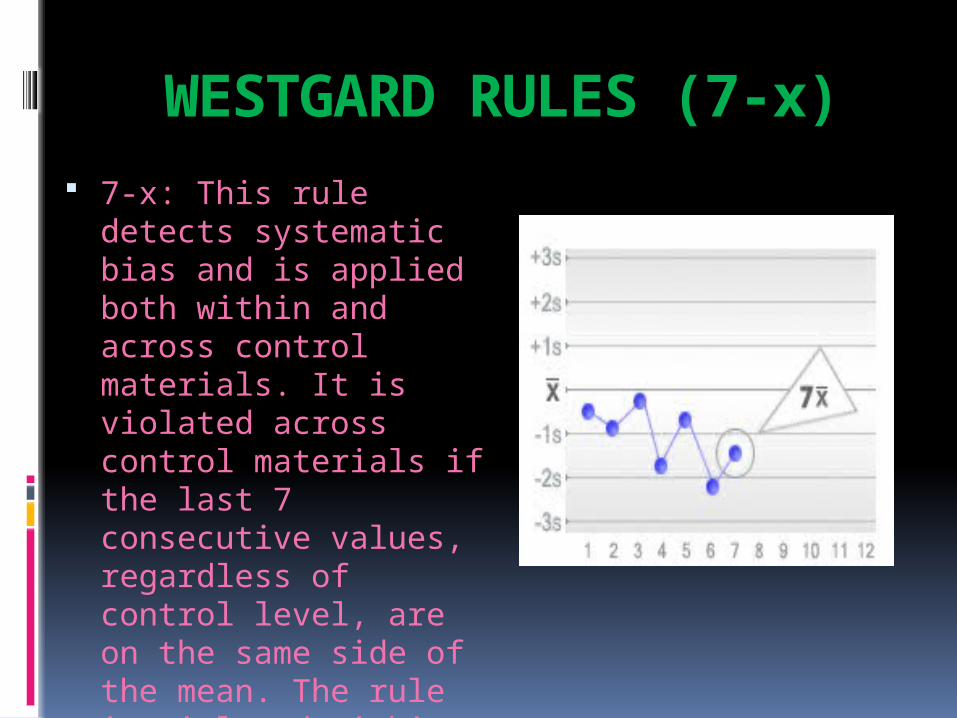
WESTGARD RULES (7-x) 7-x: This rule detects
systematic bias and is applied both within and across control materials. It is violated across control materials if the last 7 consecutive values, regardless of control level, are on the same side of the mean. The rule is violated within the control materials if the last 7 values for the same control level are on the same side of the mean.
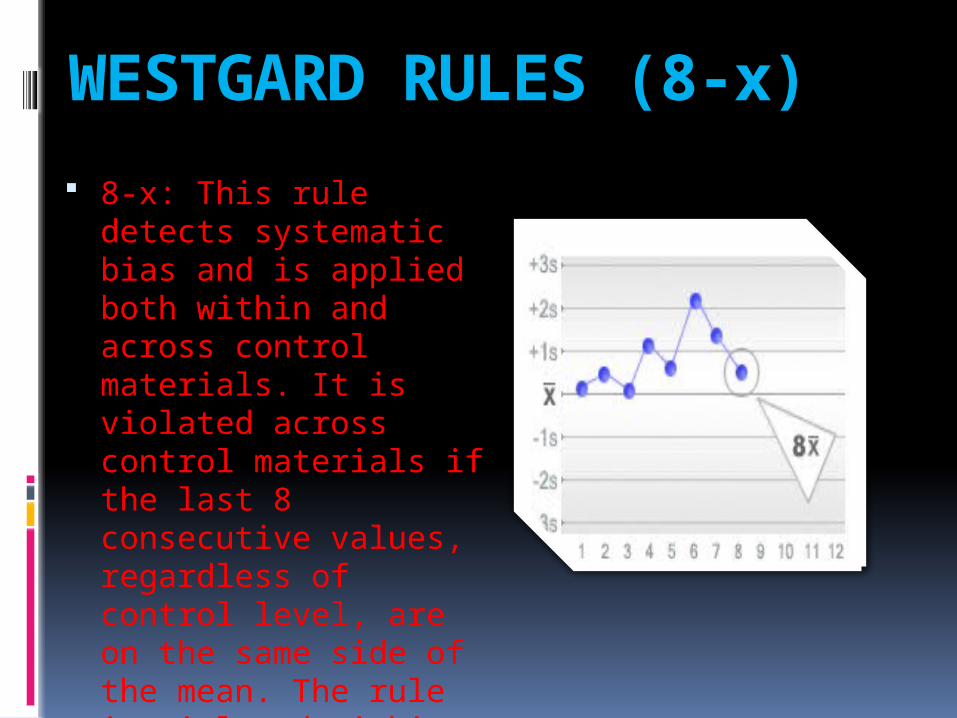
WESTGARD RULES (8-x) 8-x: This rule detects
systematic bias and is applied both within and across control materials. It is violated across control materials if the last 8 consecutive values, regardless of control level, are on the same side of the mean. The rule is violated within the control materials if the last 8 values for the same control level are on the same side of the mean.

WESTGARD RULES (9-x) 9-x: This rule detects
systematic bias and is applied both within and across control materials. It is violated across control materials if the last 9 consecutive values, regardless of control level, are on the same side of the mean. The rule is violated within the control materials if the last 9 values for the same control level are on the same side of the mean.
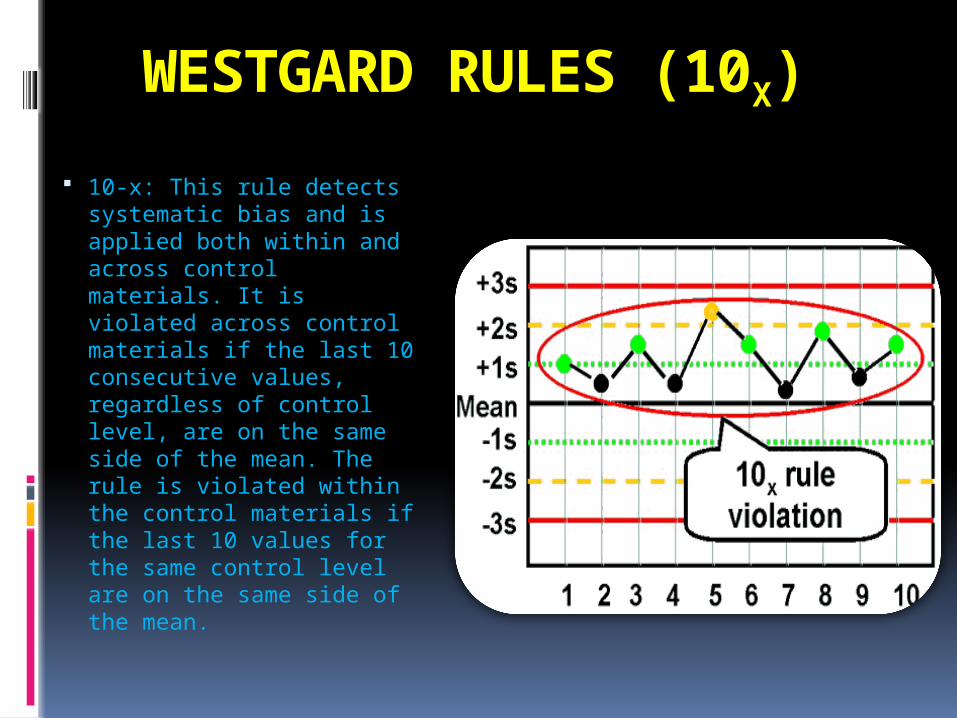
WESTGARD RULES (10X)
10-x: This rule detects systematic bias and is applied both within and across control materials. It is violated across control materials if the last 10 consecutive values, regardless of control level, are on the same side of the mean. The rule is violated within the control materials if the last 10 values for the same control level are on the same side of the mean.

WESTGARD RULES (12X) 12-x: This rule detects
systematic bias and is applied both within and across control materials. It is violated across control materials if the last 12 consecutive values, regardless of control level, are on the same side of the mean. The rule is violated within the control materials if the last 12 values for the same control level are on the same side of the mean.
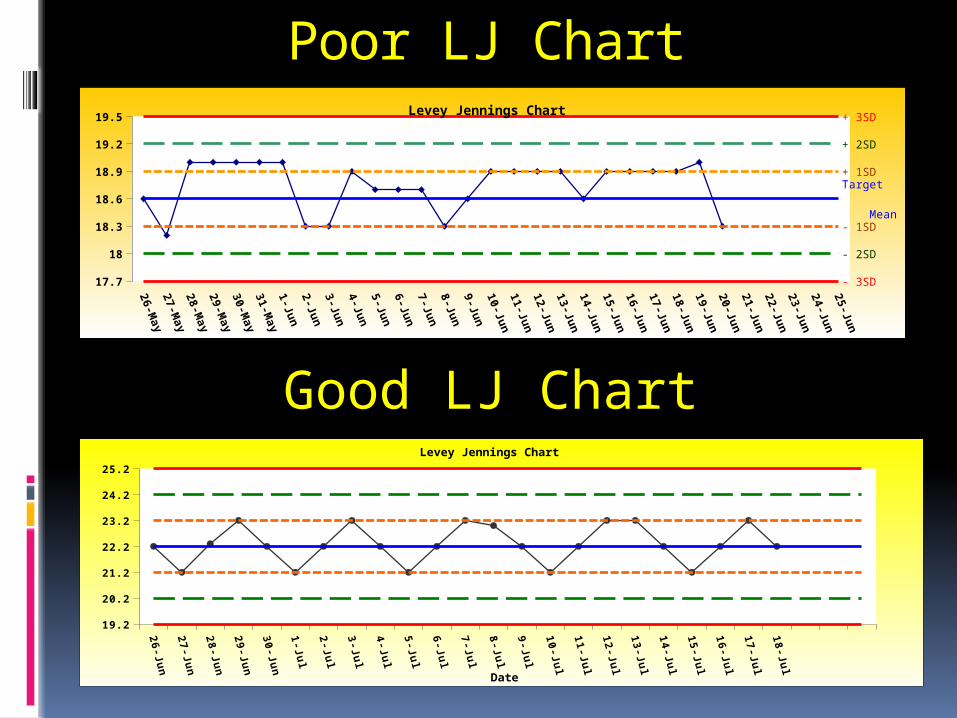
Poor LJ Chart
26-May
27-May
28-May
29-May
30-May
31-May
1-Jun2-Jun3-Jun4-Jun5-Jun6-Jun7-Jun8-Jun9-Jun10-Jun11-Jun12-Jun13-Jun14-Jun15-Jun16-Jun17-Jun18-Jun19-Jun20-Jun21-Jun22-Jun23-Jun24-Jun25-Jun
17.7
18
18.3
18.6
18.9
19.2
19.5 + 3SD
+ 2SD
+ 1SD
Target Mean
- 1SD
- 2SD
- 3SD
Levey Jennings Chart
Good LJ Chart
26-Jun
27-Jun
28-Jun
29-Jun
30-Jun
1-Jul
2-Jul
3-Jul
4-Jul
5-Jul
6-Jul
7-Jul
8-Jul
9-Jul
10-Jul
11-Jul
12-Jul
13-Jul
14-Jul
15-Jul
16-Jul
17-Jul
18-Jul
19.2
20.2
21.2
22.2
23.2
24.2
25.2Levey Jennings Chart
Date

To Technologist Make a practice to monitor a Quality control data
on daily basis it will be useful for month end review for evaluation of Quality control data points & LJ chart.
Right now we have a Unity web software which is very useful to evaluate our Internal Quality control data.
example: Monthly evaluation sheet, Laboratory comparison data, Laboratory histogram & Laboratory performance overview.
Note: Please utilize this unity software which is helpful in your future as well as to our Laboratory quality

THANK YOU
SYED BASHEER UDDIN