Embed Size (px)
Citation preview

1
Confidential, for internal planning purposes only. Not to be shared ordistributed outside of the BMS/AZ saxagliptin/dapagliflozin collaborative teams.
Performance ReportExecutive Summary
Timeframe: 4/1/10 – 4/30/10
Presented May 19, 2010

2
Executive Summary
March'10
April Visit Volume Improved Both visit volume and daily average visits improved over March (Slide #3)
Optimized Search Spend Ups Branding Increased spend and flat CTR brought more clicks; fewer bounces upped engagement (Slide #7)
Directs Dominate Registration Sources Registration rate doubled, volume also up; almost all traffic sources had more regs (Slide #8)
Most Web Activators Are Current Onglyza Users
Redemptions Per Redeemer Reaches Two
Half The Redemptions Occur Within Two Weeks
Recommendations (Slide #22)
April Visit Volume Improved
Visits Volume improved in April by +9%– Avg. Daily Visits were up by +5% over March– Paid Search at 82% Share +11% in April– Display at 2% was up by +303%; Referreds at 1% down -40% (due to HCP ad tracking)
Traffic>>Source by Month
Source: Google Analytics, NetInsight.
4,730 4,312 4,076 4,073 3,996
2,896 3,827 3,798 3,860 3,501
18,983
38,987 38,885 37,620 41,629
0
10,000
20,000
30,000
40,000
50,000
Dec Jan Feb Mar Apr
Monthly Visits
Display Ads Paid Search Email
Organic Search Referred Direct
3
HCP Banners

Directs Dominate Registrations
92% from Unpaid Sources– 70% Direct Brand Access– 16% Organic Search but branded– 6% Referral of which 3% from InternetDrugCoupons.com
8% from Paid Search
DTC CRM>>Value Card Registration Rate & Sources Trend
Source: Google Analytics, NetInsight.
Direct70%
InternetDrugCoupons
3%
Needymeds.org1%
Other Referring2%
Paid Search8%
www.onglyza.com7%
onglyza3%
onglyza.com2%
onglyza saxagliptin
1%
Other KW3%
Organic Search16%
4
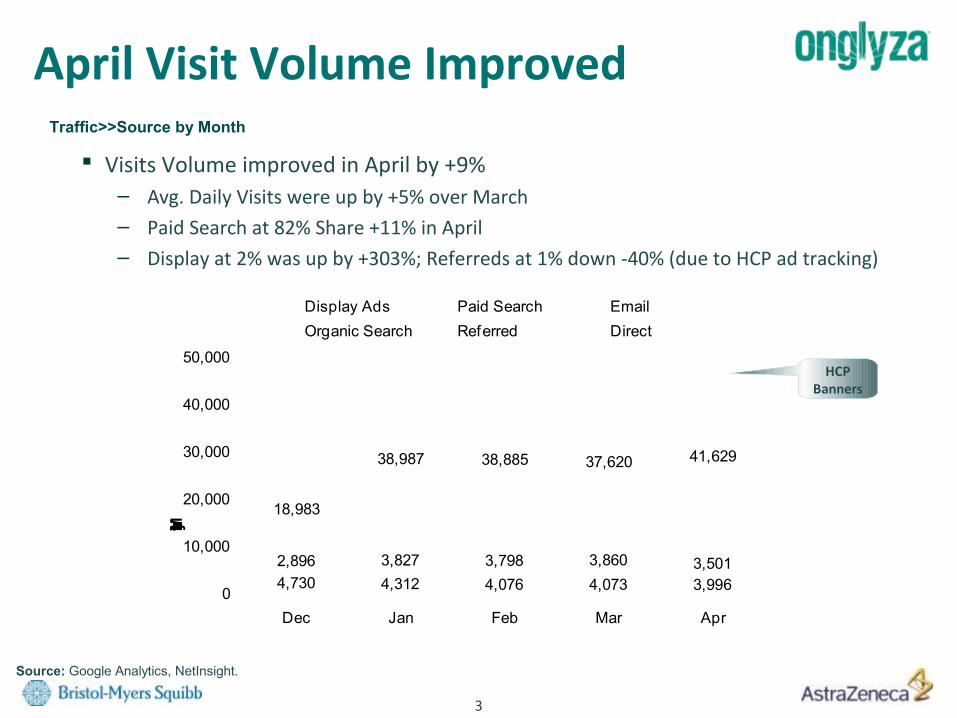
IDC Is A Growing Reg Source
An +80% Increase in Visitors from InternetDrugCoupons.com since January– +100% Increase in Registrants
Amazing 22% Registration Rate from Engaged Users (2.7 PVs/Visit)– 59 Registrations YTD: Cost = $0– Using Paid Search converters as a baseline, over $50,000 in CPA value (YTD)– Implications for Free Trial Program strategy
DTC CRM>>Value Card Registration Sources
Source: NetInsight.
24%
8%
28% 27%
0%
20%
40%
60%
80%
0
20
40
60
80
100
Jan-10 Feb-10 Mar-10 Apr-10
Monthly Percentage
Monthly Visitors
Visitors Bounce Rate Reg Rate
5
Direct Growth!

6
7,500 Redeemed-To-Date
55% of activated cards have been redeemed, compared to 53% last month.
Same day redemptions increased very slightly (36% to 37%).
After 4th Week 1st redemptions increased from 3% to 4%.
Total Cards Activated = 13,480
Total Cards Redeemed = 7,359
Key: Time to first redemption
card count
card count %
DTC CRM >>Overall first redemptions by time interval
No Redemption612145%
Same Day492637%
1st Week11438%
2nd Week3613%
3rd and 4th Weeks4043% After 4th Week
5254%
7
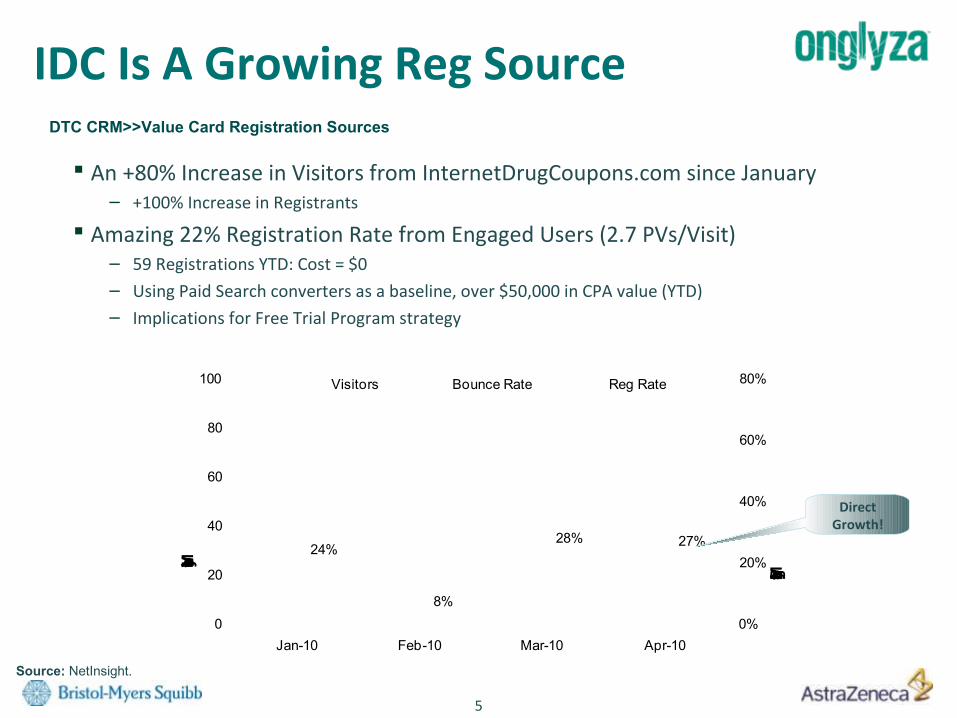
Time To Redemption Percentages SteadyPercentage of cards making first redemption on the same day and within one week of activation
Apart from Jan and Apr, redemption proportions have held steady:
Same day 35-40%
Through 1st Week 44-49%
The dip in Apr is likely to be at least partially due to redemption data which has not yet been received.
37% 40% 38% 38%29%
35% 37%30%
10%9% 10% 8%
7%
9% 9%
6%
0%
10%
20%
30%
40%
50%
60%
Sep-09 Oct-09 Nov-09 Dec-09 Jan-10 Feb-10 Mar-10 Apr-10
Same Day 1st Week

8
Steady Growth Across All Value Card Metrics Cumulative Activity by Month
Redemptions per redeemer greater than 2.
Redemptions per activation greater than 1.
Redeemer rate holding steady at just above 50%
0.0
0.5
1.0
1.5
2.0
2.5
-
2,000
4,000
6,000
8,000
10,000
12,000
14,000
16,000
18,000
Aug-09 Sep-09 Oct-09 Nov-09 Dec-09 Jan-10 Feb-10 Mar-10 Apr-10
Rate/Ratio
Activations Redeemers Redemptions
Reedemer Rate Redemptions per Activation Redemptions per Redeemer

9
Reminder Program Notes And Assumptions
Through Apr-10, the time from mailing to first redemption ranges from 1 to 71 days.
Just over 50% of these first redemptions occur within 14 days of the mailing.
For the purposes of this analysis, any first redemptions that occur after a reminder mailing was sent are being counted as influenced by the mailing.
Is there a desire to exclude from the reminder program count first redemptions which occur more than a specified number of days from mailing?

1010
First Redemptions From Reminders SteadyFirst Redemptions by Reminder Mail Type by Week
5% of those who received a timely reminder have made their first redemption.
Apart from the jump in early to mid-April, total weekly redemptions have been relatively steady, ranging from 24 to 37.
Jump in redeemers on 10-Apr and 17-Apr primarily due to high numbers of reminders sent on 3-Apr and 10-Apr (2nd catch up).
Total Redeemers
Direct Mail: 194
Email: 159
2 15 16 16 1122
15
4027
14 16
12 11 8 16
15
14
31
23
19 10
0
10
20
30
40
50
60
70
80
20-Feb 27-Feb 06-Mar 13-Mar 20-Mar 27-Mar 03-Apr 10-Apr 17-Apr 24-Apr 01-May
Redeemers
Week Ending
Direct Mail Email

DTC Recommendations
Confidential, for internal planning purposes only. Not to be shared ordistributed outside of the BMS/AZ saxagliptin/dapagliflozin collaborative teams.
March'10
1. Web Sitea) Integrate AZ OnglyzaCampaign data into site tracking [DMS]b) Implement tracking across DTC/HCP/Nutrition Tracker/Ad Server Tags [DMS]
2. DTC Advertising/Mediaa) Paid Search [MV]
i. Optimization or bidding changes that led to higher bounce rateii. Ascertain Branded vs. Unbranded ad copy test viabilityiii. Define automated reporting also for Organic Search [Rosetta, DMS, MV]
3. CRM Control Groupa) A small percentage of potential recipients in each mailing should be held aside as a
control group; this will allow us to directly and statistically calculate lift in time to first redemption, redemption percentage, and redemption frequency. [DMS]
4. Researcha) Track Januvia activity via Compete data [DMS]b) Monitor Demographic/lookalike behavior (Quantcast) [DMS]
11

12
Proportions of WEB* activated by card type
Most WEB Activated Are Current Onglyza Users
Over 60% of both Physician and Web card activators indicated that they are current Onglyza users.
Proportions are nearly the same for both card types.
1,694 672
935 432
0%
10%
20%
30%
40%
50%
60%
70%
80%
90%
100%
Physician Card Webcard
No
Yes
Current Onglyza
User
* No question about current Onglyza use appears in the TM scripts and no “Yes” responses to such a question appear in the database for the TM activation channel.