Embed Size (px)
Citation preview
1
Weighted Total
PneuVUE®
Adult Pneumonia Vaccine Understanding in Europe
Prepared for Pfizer Prepared by: Ipsos Healthcare UK Reference: 15-059573-01 © 2016 Ipsos. All rights reserved. Contains Ipsos' Confidential and Proprietary information and may not be disclosed or reproduced without the prior written consent of Ipsos.
2
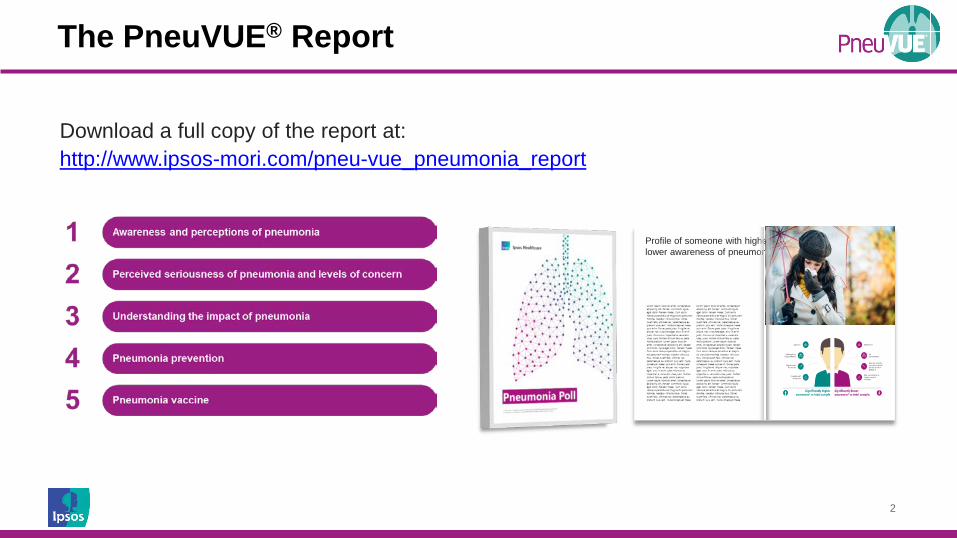
The PneuVUE® Report
Download a full copy of the report at: http://www.ipsos-mori.com/pneu-vue_pneumonia_report
Profile of someone with higher/ lower awareness of pneumonia
4
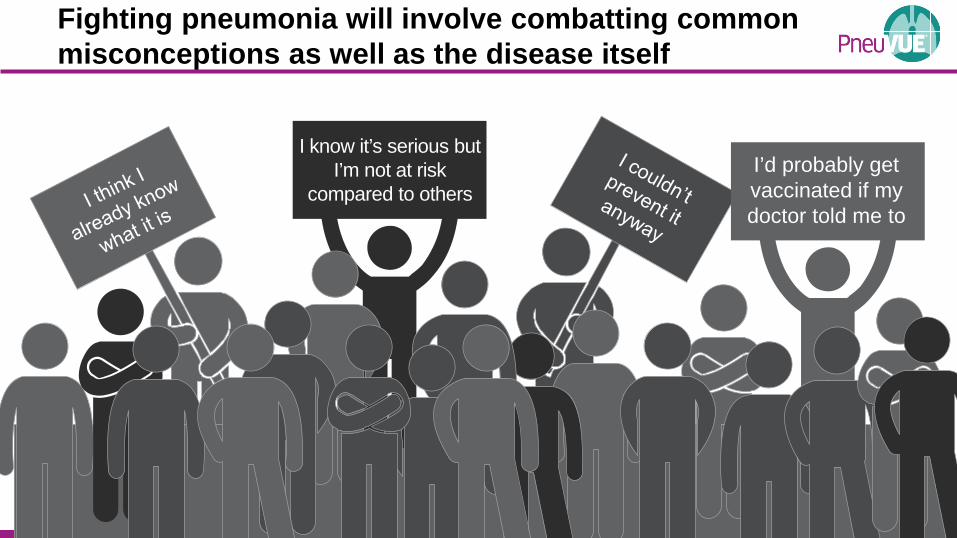
I know it’s serious but I’m not at risk
compared to others I’d probably get vaccinated if my doctor told me to
Fighting pneumonia will involve combatting common misconceptions as well as the disease itself
5
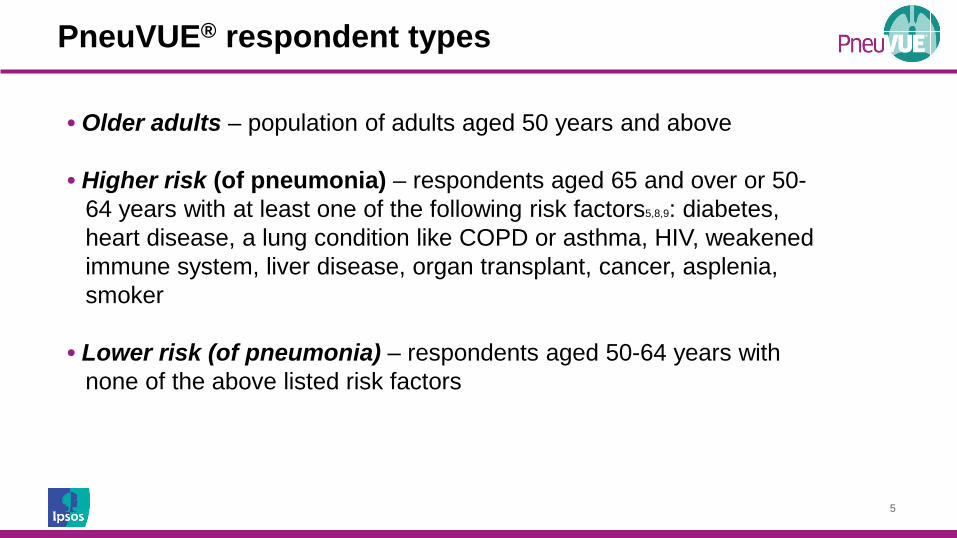
PneuVUE® respondent types
• Older adults – population of adults aged 50 years and above • Higher risk (of pneumonia) – respondents aged 65 and over or 50-
64 years with at least one of the following risk factors5,8,9: diabetes, heart disease, a lung condition like COPD or asthma, HIV, weakened immune system, liver disease, organ transplant, cancer, asplenia, smoker
• Lower risk (of pneumonia) – respondents aged 50-64 years with
none of the above listed risk factors
6
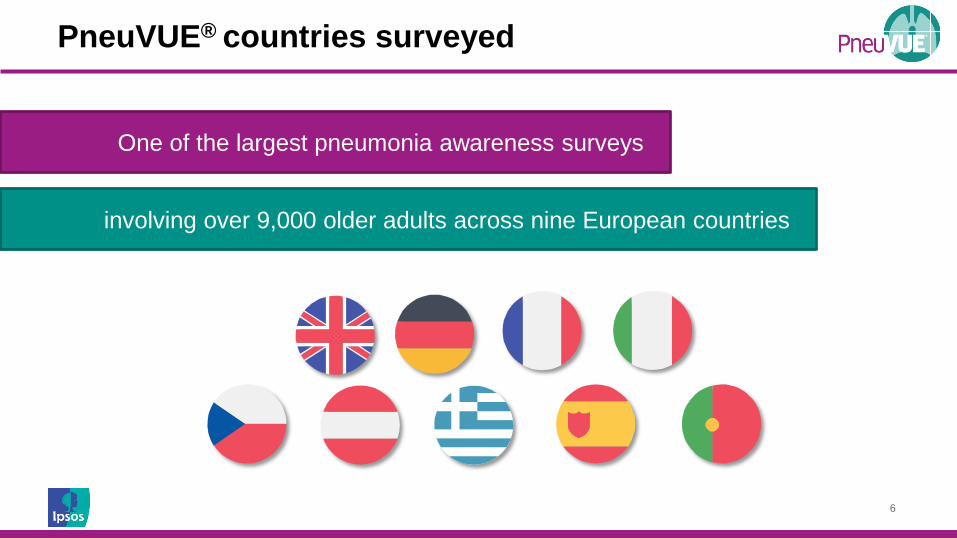
PneuVUE® countries surveyed
One of the largest pneumonia awareness surveys
involving over 9,000 older adults across nine European countries
7
Awareness and Perceptions of Pneumonia
When it comes to pneumonia, the problem is not with awareness but with understanding
8
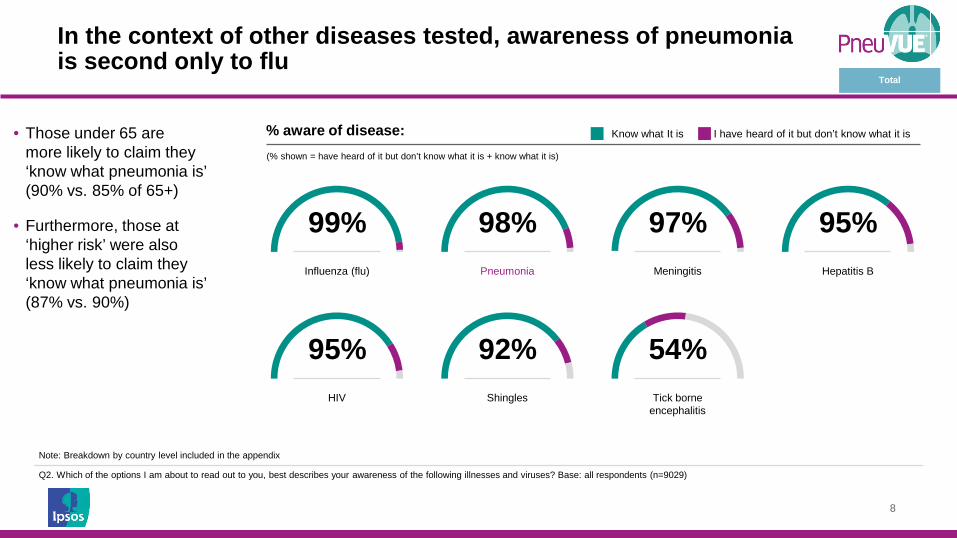
In the context of other diseases tested, awareness of pneumonia is second only to flu
98% Pneumonia
99% Influenza (flu)
97% Meningitis
95% Hepatitis B
92% Shingles
54% Tick borne
encephalitis
95% HIV
Know what It is I have heard of it but don’t know what it is
(% shown = have heard of it but don’t know what it is + know what it is)
Note: Breakdown by country level included in the appendix
Q2. Which of the options I am about to read out to you, best describes your awareness of the following illnesses and viruses? Base: all respondents (n=9029)
Total
• Those under 65 are more likely to claim they ‘know what pneumonia is’ (90% vs. 85% of 65+)
• Furthermore, those at ‘higher risk’ were also less likely to claim they ‘know what pneumonia is’ (87% vs. 90%)
% aware of disease:
9
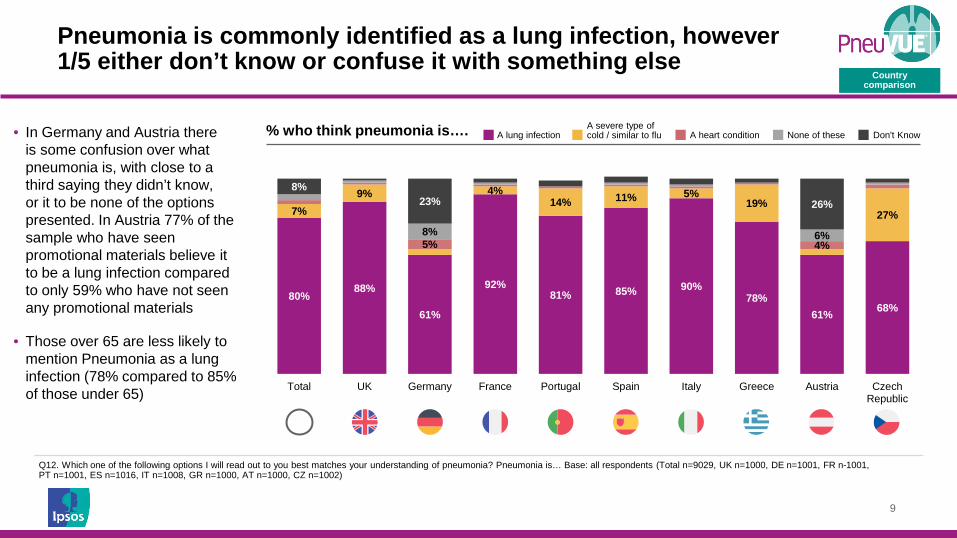
Pneumonia is commonly identified as a lung infection, however 1/5 either don’t know or confuse it with something else
80% 88%
61%
92% 81% 85% 90%
78% 61% 68%
7% 9% 4%
14% 11% 5% 19%
27%
5% 4% 8% 6%
8% 23% 26%
Total UK Germany France Portugal Spain Italy Greece Austria CzechRepublic
A severe type of cold / similar to flu A heart condition A lung infection None of these Don't Know
Country comparison
Q12. Which one of the following options I will read out to you best matches your understanding of pneumonia? Pneumonia is… Base: all respondents (Total n=9029, UK n=1000, DE n=1001, FR n-1001, PT n=1001, ES n=1016, IT n=1008, GR n=1000, AT n=1000, CZ n=1002)
• In Germany and Austria there is some confusion over what pneumonia is, with close to a third saying they didn’t know, or it to be none of the options presented. In Austria 77% of the sample who have seen promotional materials believe it to be a lung infection compared to only 59% who have not seen any promotional materials
• Those over 65 are less likely to mention Pneumonia as a lung infection (78% compared to 85% of those under 65)
% who think pneumonia is….
10
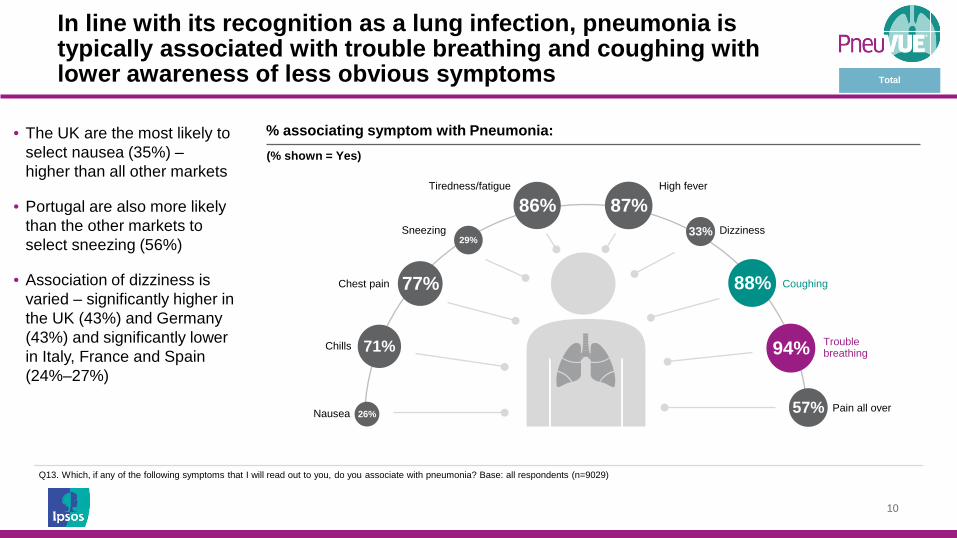
In line with its recognition as a lung infection, pneumonia is typically associated with trouble breathing and coughing with lower awareness of less obvious symptoms
(% shown = Yes)
Nausea
Chills
High fever
Trouble breathing
Tiredness/fatigue
Chest pain
Sneezing Dizziness
94%
88%
87% 86%
77%
71%
33% 29%
26%
Coughing
Pain all over 57%
Total
• The UK are the most likely to select nausea (35%) – higher than all other markets
• Portugal are also more likely than the other markets to select sneezing (56%)
• Association of dizziness is varied – significantly higher in the UK (43%) and Germany (43%) and significantly lower in Italy, France and Spain (24%–27%)
Q13. Which, if any of the following symptoms that I will read out to you, do you associate with pneumonia? Base: all respondents (n=9029)
% associating symptom with Pneumonia:
11
44%
25%
58% 47%
60% 42% 36% 43%
64%
44%
38% 62%
28%
28% 20%
34% 46% 30%
26%
45%
18% 13% 14% 25% 19% 24% 19%
28% 10% 11%
Total UK Germany France Portugal Spain Italy Greece Austria CzechRepublic
Some forms of pneumonia may be contagious, meaning it can easily be passed on from one person to another
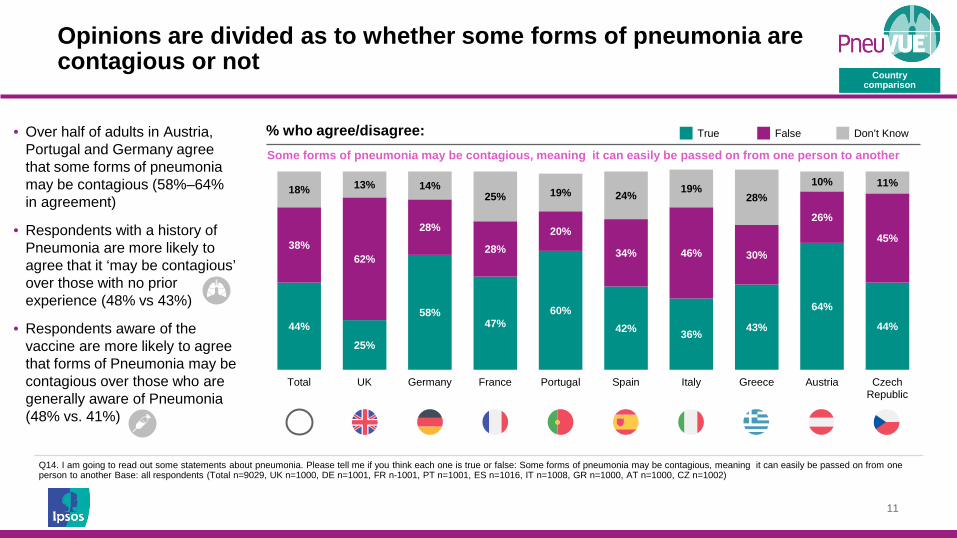
Opinions are divided as to whether some forms of pneumonia are contagious or not
Country comparison
Q14. I am going to read out some statements about pneumonia. Please tell me if you think each one is true or false: Some forms of pneumonia may be contagious, meaning it can easily be passed on from one person to another Base: all respondents (Total n=9029, UK n=1000, DE n=1001, FR n-1001, PT n=1001, ES n=1016, IT n=1008, GR n=1000, AT n=1000, CZ n=1002)
• Over half of adults in Austria, Portugal and Germany agree that some forms of pneumonia may be contagious (58%–64% in agreement)
• Respondents with a history of Pneumonia are more likely to agree that it ‘may be contagious’ over those with no prior experience (48% vs 43%)
• Respondents aware of the vaccine are more likely to agree that forms of Pneumonia may be contagious over those who are generally aware of Pneumonia (48% vs. 41%)
True False Don’t Know % who agree/disagree:
12
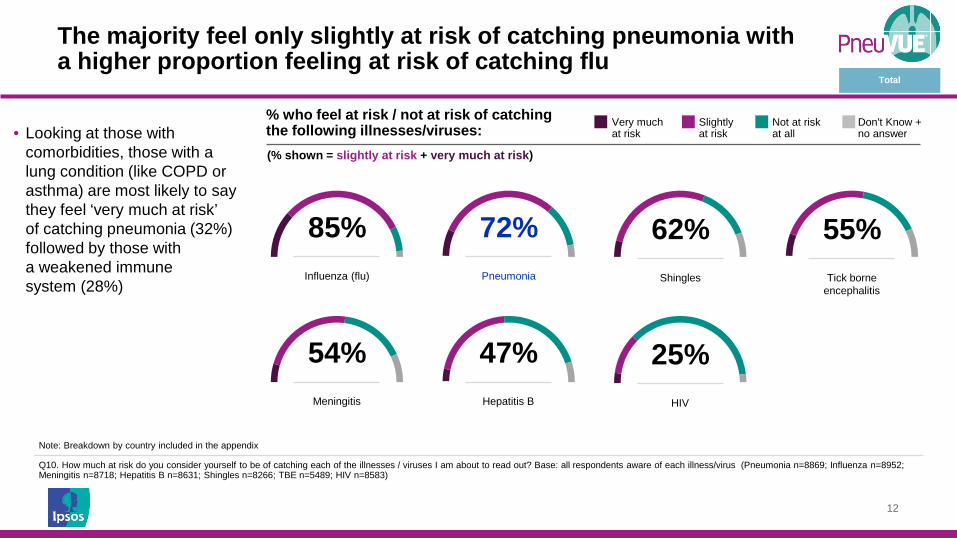
The majority feel only slightly at risk of catching pneumonia with a higher proportion feeling at risk of catching flu
Very much at risk
Slightly at risk
Don't Know + no answer
Not at risk at all
72% Pneumonia
85% Influenza (flu)
54% Meningitis
47% Hepatitis B
62% Shingles
55% Tick borne
encephalitis
25% HIV
Note: Breakdown by country included in the appendix
Q10. How much at risk do you consider yourself to be of catching each of the illnesses / viruses I am about to read out? Base: all respondents aware of each illness/virus (Pneumonia n=8869; Influenza n=8952; Meningitis n=8718; Hepatitis B n=8631; Shingles n=8266; TBE n=5489; HIV n=8583)
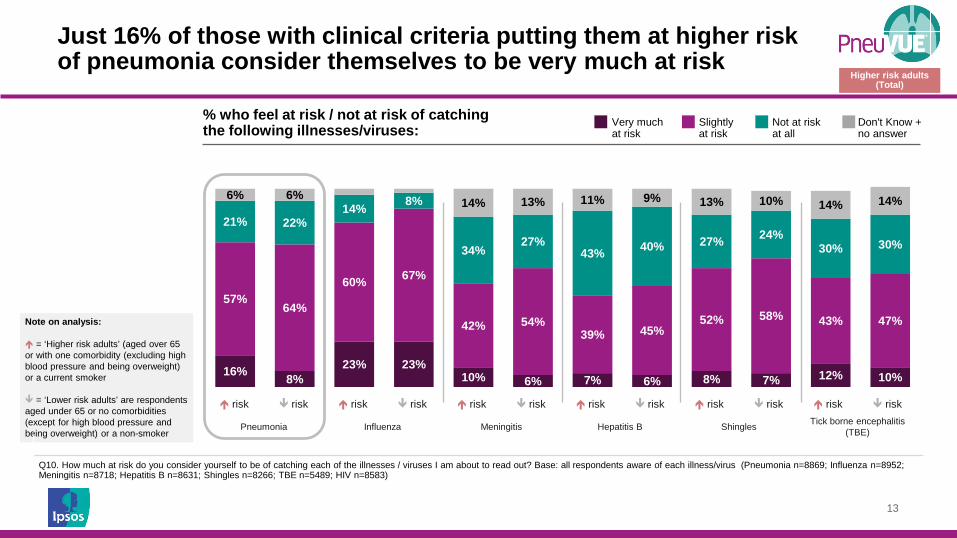
• Looking at those with comorbidities, those with a lung condition (like COPD or asthma) are most likely to say they feel ‘very much at risk’ of catching pneumonia (32%) followed by those with a weakened immune system (28%)
Total
% who feel at risk / not at risk of catching the following illnesses/viruses: (% shown = slightly at risk + very much at risk)
13
16% 8% 23% 23%
10% 6% 7% 6% 8% 7% 12% 10%
57% 64%
60% 67%
42% 54% 39% 45%
52% 58% 43% 47%
21% 22% 14% 8%
34% 27%
43% 40% 27% 24% 30% 30%
6% 6% 14% 13% 11% 9% 13% 10% 14% 14%
risk risk risk risk risk risk risk risk risk risk risk risk
Pneumonia Influenza Meningitis Hepatitis B Shingles Tick borne encephalitis (TBE)
Changes made: • Heading adjusted the percentages
Note on analysis: = ‘Higher risk adults’ (aged over 65 or with one comorbidity (excluding high blood pressure and being overweight) or a current smoker = ‘Lower risk adults’ are respondents aged under 65 or no comorbidities (except for high blood pressure and being overweight) or a non-smoker
Q10. How much at risk do you consider yourself to be of catching each of the illnesses / viruses I am about to read out? Base: all respondents aware of each illness/virus (Pneumonia n=8869; Influenza n=8952; Meningitis n=8718; Hepatitis B n=8631; Shingles n=8266; TBE n=5489; HIV n=8583)
% who feel at risk / not at risk of catching the following illnesses/viruses:
Just 16% of those with clinical criteria putting them at higher risk of pneumonia consider themselves to be very much at risk
Very much at risk
Slightly at risk
Don't Know + no answer
Not at risk at all
Higher risk adults (Total)
14
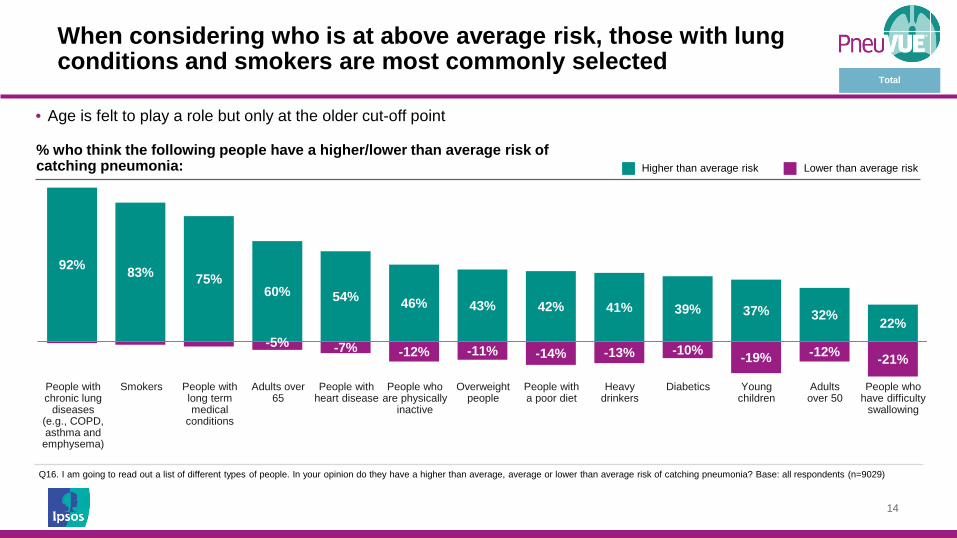
92% 83% 75% 60% 54% 46% 43% 42% 41% 39% 37% 32% 22% -5% -7% -12% -11% -14% -13% -10% -19% -12% -21%
People with chronic lung
diseases (e.g., COPD, asthma and
emphysema)
Smokers People with long term medical
conditions
Adults over 65
People with heart disease
People who are physically
inactive
Overweight people
People with a poor diet
Heavy drinkers
Diabetics Young children
Adults over 50
People who have difficulty
swallowing
When considering who is at above average risk, those with lung conditions and smokers are most commonly selected
Higher than average risk Lower than average risk
Total
Q16. I am going to read out a list of different types of people. In your opinion do they have a higher than average, average or lower than average risk of catching pneumonia? Base: all respondents (n=9029)
% who think the following people have a higher/lower than average risk of catching pneumonia:
• Age is felt to play a role but only at the older cut-off point
15
Perceived seriousness of Pneumonia and levels of concern
Pneumonia is acknowledged to be serious but more something that happens to other people
16
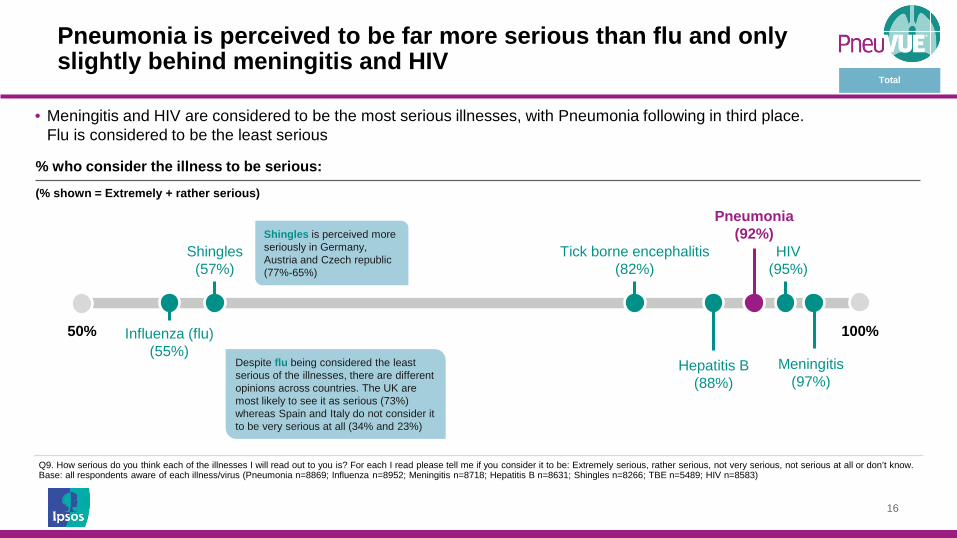
Pneumonia is perceived to be far more serious than flu and only slightly behind meningitis and HIV
100% 50% Influenza (flu) (55%)
Shingles (57%)
Tick borne encephalitis (82%)
Pneumonia (92%)
Hepatitis B (88%)
Meningitis (97%)
Despite flu being considered the least serious of the illnesses, there are different opinions across countries. The UK are most likely to see it as serious (73%) whereas Spain and Italy do not consider it to be very serious at all (34% and 23%)
Shingles is perceived more seriously in Germany, Austria and Czech republic (77%-65%)
HIV (95%)
Q9. How serious do you think each of the illnesses I will read out to you is? For each I read please tell me if you consider it to be: Extremely serious, rather serious, not very serious, not serious at all or don’t know. Base: all respondents aware of each illness/virus (Pneumonia n=8869; Influenza n=8952; Meningitis n=8718; Hepatitis B n=8631; Shingles n=8266; TBE n=5489; HIV n=8583)
Total
% who consider the illness to be serious:
• Meningitis and HIV are considered to be the most serious illnesses, with Pneumonia following in third place. Flu is considered to be the least serious
(% shown = Extremely + rather serious)
17
70% 84%
70%
39%
87% 79% 80%
70% 64% 60%
18%
10%
20%
35%
5% 9% 12%
15% 24% 28%
12% 5% 9% 25%
9% 12% 8% 15% 12% 12%
Total UK Germany France Portugal Spain Italy Greece Austria CzechRepublic
Q14. I am going to read out some statements about pneumonia. Please tell me if you think each one is true or false: Pneumonia is more deadly than flu. Base: all respondents (Total n=9029, UK n=1000, DE n=1001, FR n-1001, PT n=1001, ES n=1016, IT n=1008, GR n=1000, AT n=1000, CZ n=1002)
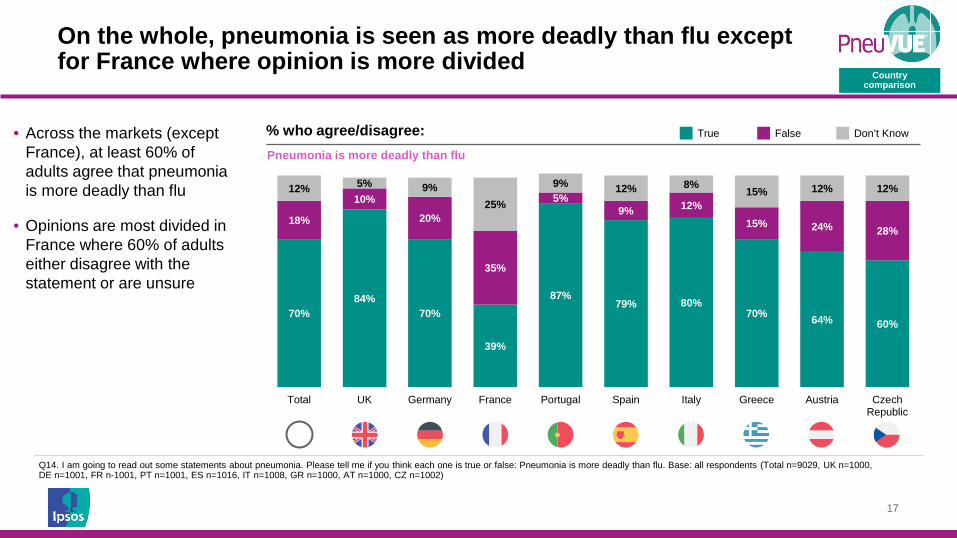
• Across the markets (except France), at least 60% of adults agree that pneumonia is more deadly than flu
• Opinions are most divided in France where 60% of adults either disagree with the statement or are unsure
% who agree/disagree: Pneumonia is more deadly than flu
True False Don’t Know
Country comparison
On the whole, pneumonia is seen as more deadly than flu except for France where opinion is more divided
18
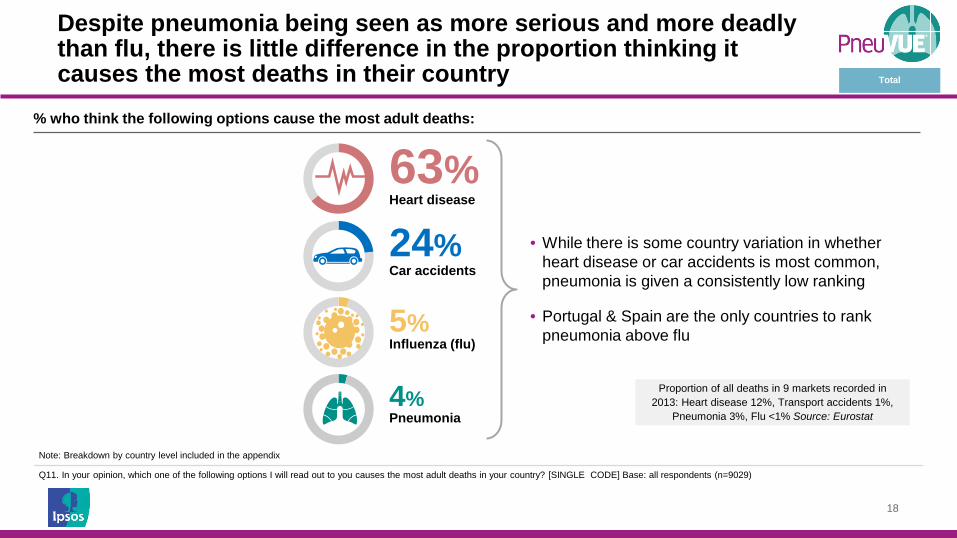
Despite pneumonia being seen as more serious and more deadly than flu, there is little difference in the proportion thinking it causes the most deaths in their country
63% Heart disease
4% Pneumonia
5% Influenza (flu)
24% Car accidents
Proportion of all deaths in 9 markets recorded in 2013: Heart disease 12%, Transport accidents 1%,
Pneumonia 3%, Flu <1% Source: Eurostat
Total
Note: Breakdown by country level included in the appendix
Q11. In your opinion, which one of the following options I will read out to you causes the most adult deaths in your country? [SINGLE CODE] Base: all respondents (n=9029)
% who think the following options cause the most adult deaths:
• While there is some country variation in whether heart disease or car accidents is most common, pneumonia is given a consistently low ranking
• Portugal & Spain are the only countries to rank pneumonia above flu
19
20% 23% 12% 12% 22% 42%
22% 31% 12% 19%
-78% -75% -86% -88% -76%
-54% -75% -68%
-88% -78%
Total UK Germany France Portugal Spain Italy Greece Austria Czech Republic
Q17. To what extent are you personally concerned or not about the risk of catching pneumonia yourself? ? . Base: all respondents (Total n=9029, UK n=1000, DE n=1001, FR n-1001, PT n=1001, ES n=1016, IT n=1008, GR n=1000, AT n=1000, CZ n=1002)
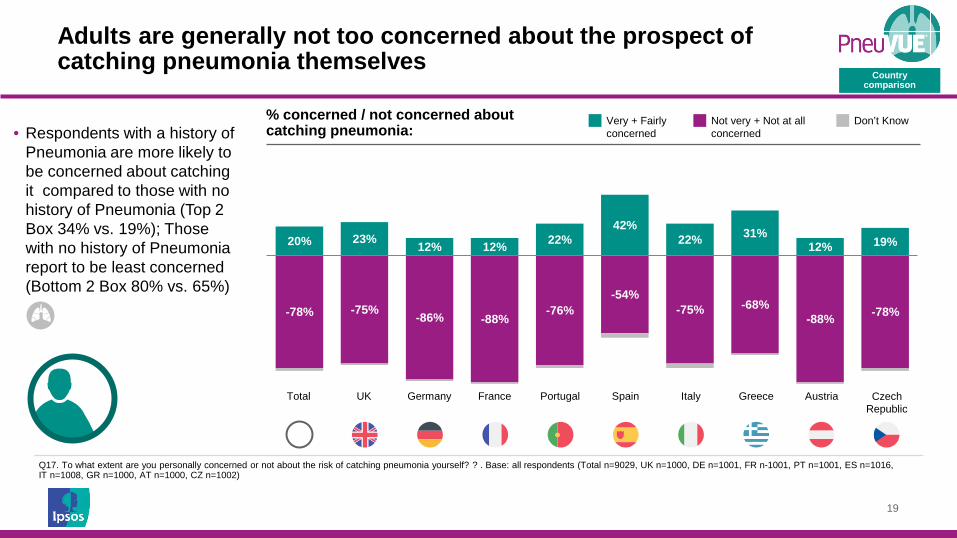
• Respondents with a history of Pneumonia are more likely to be concerned about catching it compared to those with no history of Pneumonia (Top 2 Box 34% vs. 19%); Those with no history of Pneumonia report to be least concerned (Bottom 2 Box 80% vs. 65%)
% concerned / not concerned about catching pneumonia:
Very + Fairly concerned
Not very + Not at all concerned
Don’t Know
Country comparison
Adults are generally not too concerned about the prospect of catching pneumonia themselves
20
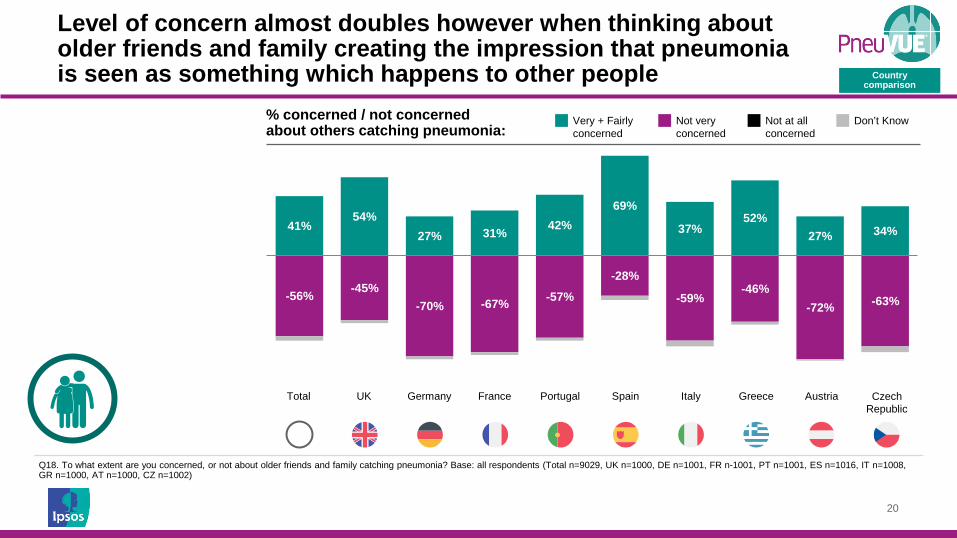
Level of concern almost doubles however when thinking about older friends and family creating the impression that pneumonia is seen as something which happens to other people
41% 54%
27% 31% 42% 69%
37% 52%
27% 34%
-56% -45% -70% -67% -57%
-28%
-59% -46%
-72% -63%
Total UK Germany France Portugal Spain Italy Greece Austria Czech Republic
Q18. To what extent are you concerned, or not about older friends and family catching pneumonia? Base: all respondents (Total n=9029, UK n=1000, DE n=1001, FR n-1001, PT n=1001, ES n=1016, IT n=1008, GR n=1000, AT n=1000, CZ n=1002)
% concerned / not concerned about others catching pneumonia:
Very + Fairly concerned
Not very concerned
Don’t Know
Country comparison
Not at all concerned
21
Understanding the impact of Pneumonia
If pneumonia does strike, it tends to be worse than anticipated
22
13% 13%
18%
6%
11% 9%
12% 12%
21%
28%
Total UK Germany France Portugal Spain Italy Greece Austria CzechRepublic
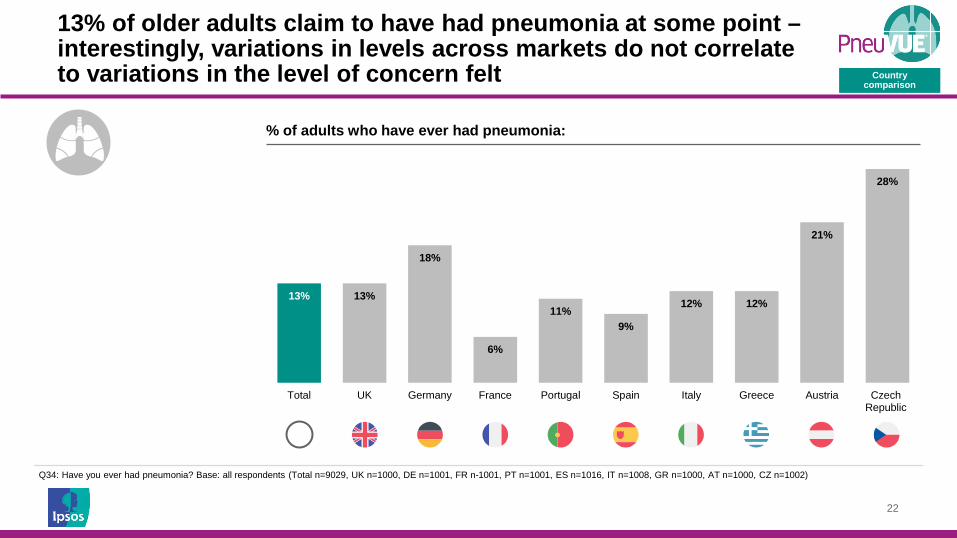
Q34: Have you ever had pneumonia? Base: all respondents (Total n=9029, UK n=1000, DE n=1001, FR n-1001, PT n=1001, ES n=1016, IT n=1008, GR n=1000, AT n=1000, CZ n=1002)
13% of older adults claim to have had pneumonia at some point – interestingly, variations in levels across markets do not correlate to variations in the level of concern felt Country
comparison
% of adults who have ever had pneumonia:
23
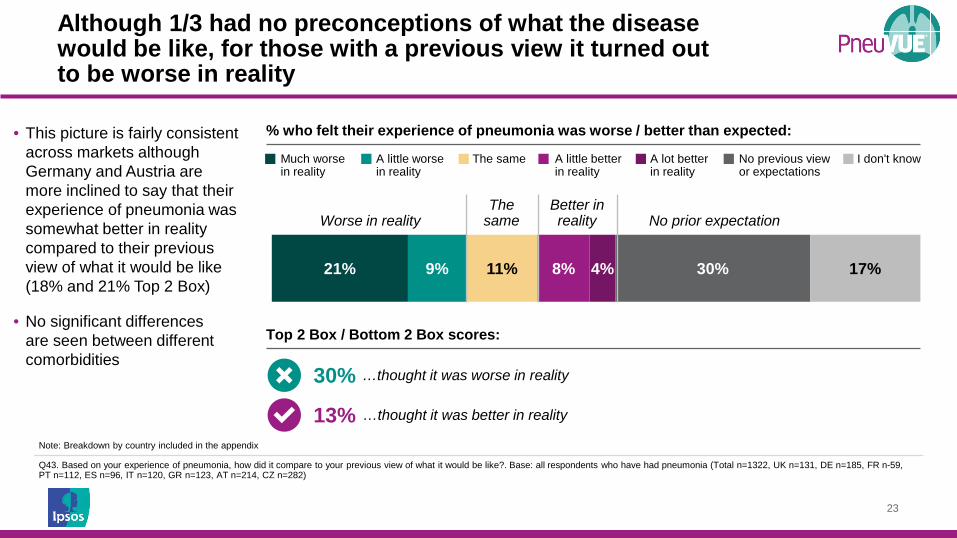
21% 9% 11% 8% 4% 30% 17%
Much worse in reality
A little worse in reality
The same A little better in reality
A lot better in reality
No previous view or expectations
I I don't know
Worse in reality The
same Better in reality No prior expectation
30%
13%
…thought it was worse in reality
…thought it was better in reality
Note: Breakdown by country included in the appendix
Q43. Based on your experience of pneumonia, how did it compare to your previous view of what it would be like?. Base: all respondents who have had pneumonia (Total n=1322, UK n=131, DE n=185, FR n-59, PT n=112, ES n=96, IT n=120, GR n=123, AT n=214, CZ n=282)
• This picture is fairly consistent across markets although Germany and Austria are more inclined to say that their experience of pneumonia was somewhat better in reality compared to their previous view of what it would be like (18% and 21% Top 2 Box)
• No significant differences are seen between different comorbidities
% who felt their experience of pneumonia was worse / better than expected:
Although 1/3 had no preconceptions of what the disease would be like, for those with a previous view it turned out to be worse in reality
Top 2 Box / Bottom 2 Box scores:
24
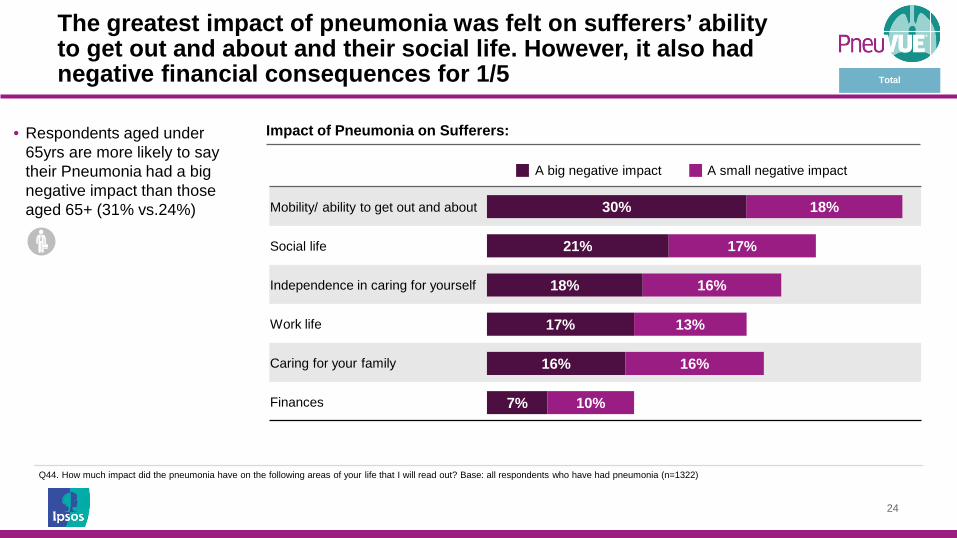
Mobility/ ability to get out and about
Social life
Independence in caring for yourself
Work life
Caring for your family
Finances
The greatest impact of pneumonia was felt on sufferers’ ability to get out and about and their social life. However, it also had negative financial consequences for 1/5
30%
21%
18%
17%
16%
7%
18%
17%
16%
13%
16%
10%
A big negative impact A small negative impact
Total
Impact of Pneumonia on Sufferers:
Q44. How much impact did the pneumonia have on the following areas of your life that I will read out? Base: all respondents who have had pneumonia (n=1322)
• Respondents aged under 65yrs are more likely to say their Pneumonia had a big negative impact than those aged 65+ (31% vs.24%)
25
Supported
Confident it would pass soon
Not bothered by it
Surprised
Powerless
Poorly informed
Scared
Anxious
Annoyed with myself
Angry
Supported Confident it would pass soon
Annoyed with myself
Surprised Powerless
Scared
Anxious
Poorly informed
Not bothered by it
Angry
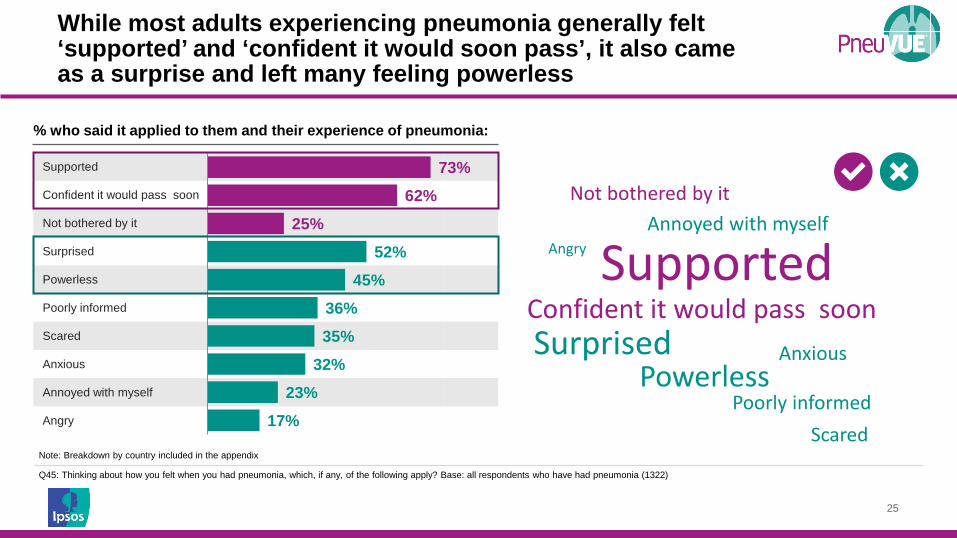
While most adults experiencing pneumonia generally felt ‘supported’ and ‘confident it would soon pass’, it also came as a surprise and left many feeling powerless
52%
45%
36%
35%
32%
23%
17%
73%
62%
25%
Note: Breakdown by country included in the appendix
Q45: Thinking about how you felt when you had pneumonia, which, if any, of the following apply? Base: all respondents who have had pneumonia (1322)
% who said it applied to them and their experience of pneumonia:
26
Pneumonia Prevention
Vaccination is not commonly seen as an effective means of preventing pneumonia, falling behind simple lifestyle measures
27
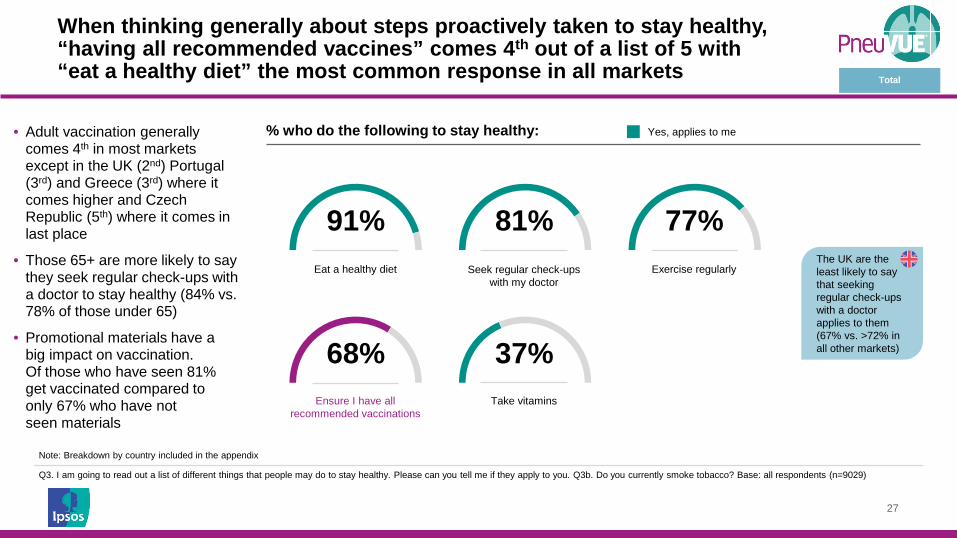
When thinking generally about steps proactively taken to stay healthy, “having all recommended vaccines” comes 4th out of a list of 5 with “eat a healthy diet” the most common response in all markets
37% Take vitamins Ensure I have all
recommended vaccinations
Yes, applies to me
Eat a healthy diet
91% Exercise regularly
77% Seek regular check-ups
with my doctor
81%
68%
The UK are the least likely to say that seeking regular check-ups with a doctor applies to them (67% vs. >72% in all other markets)
Total
% who do the following to stay healthy: • Adult vaccination generally comes 4th in most markets except in the UK (2nd) Portugal (3rd) and Greece (3rd) where it comes higher and Czech Republic (5th) where it comes in last place
• Those 65+ are more likely to say they seek regular check-ups with a doctor to stay healthy (84% vs. 78% of those under 65)
• Promotional materials have a big impact on vaccination. Of those who have seen 81% get vaccinated compared to only 67% who have not seen materials
Note: Breakdown by country included in the appendix
Q3. I am going to read out a list of different things that people may do to stay healthy. Please can you tell me if they apply to you. Q3b. Do you currently smoke tobacco? Base: all respondents (n=9029)
28
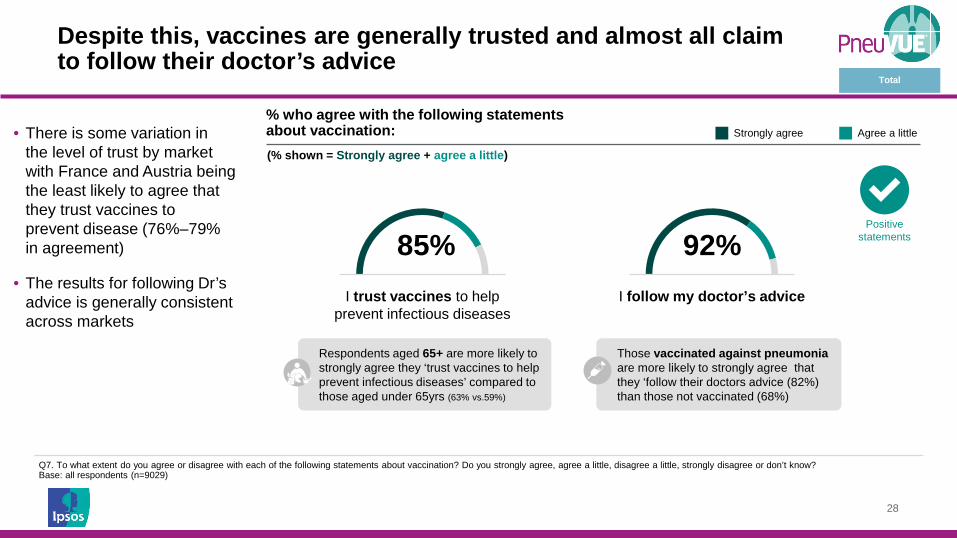
85% 92% I trust vaccines to help
prevent infectious diseases I follow my doctor’s advice
Strongly agree Agree a little
Positive statements
Respondents aged 65+ are more likely to strongly agree they ‘trust vaccines to help prevent infectious diseases’ compared to those aged under 65yrs (63% vs.59%)
Those vaccinated against pneumonia are more likely to strongly agree that they ‘follow their doctors advice (82%) than those not vaccinated (68%)
Q7. To what extent do you agree or disagree with each of the following statements about vaccination? Do you strongly agree, agree a little, disagree a little, strongly disagree or don’t know? Base: all respondents (n=9029)
• There is some variation in the level of trust by market with France and Austria being the least likely to agree that they trust vaccines to prevent disease (76%–79% in agreement)
• The results for following Dr’s advice is generally consistent across markets
Despite this, vaccines are generally trusted and almost all claim to follow their doctor’s advice
Total
% who agree with the following statements about vaccination: (% shown = Strongly agree + agree a little)
29
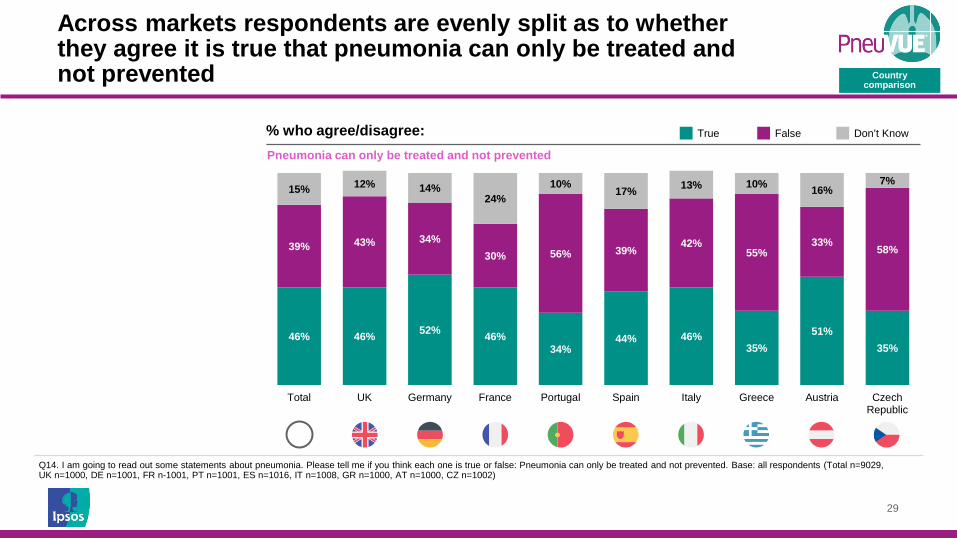
46% 46% 52% 46% 34%
44% 46% 35%
51% 35%
39% 43% 34% 30% 56% 39% 42%
55% 33% 58%
15% 12% 14% 24%
10% 17% 13% 10% 16% 7%
Total UK Germany France Portugal Spain Italy Greece Austria CzechRepublic
Country comparison
Q14. I am going to read out some statements about pneumonia. Please tell me if you think each one is true or false: Pneumonia can only be treated and not prevented. Base: all respondents (Total n=9029, UK n=1000, DE n=1001, FR n-1001, PT n=1001, ES n=1016, IT n=1008, GR n=1000, AT n=1000, CZ n=1002)
Pneumonia can only be treated and not prevented
True False Don’t Know % who agree/disagree:
Across markets respondents are evenly split as to whether they agree it is true that pneumonia can only be treated and not prevented
30
Top 2 Box: (Very + slightly effective)
Bottom 2 Box: (Not at all + not very effective)
Don't Know + Prefer not to answer
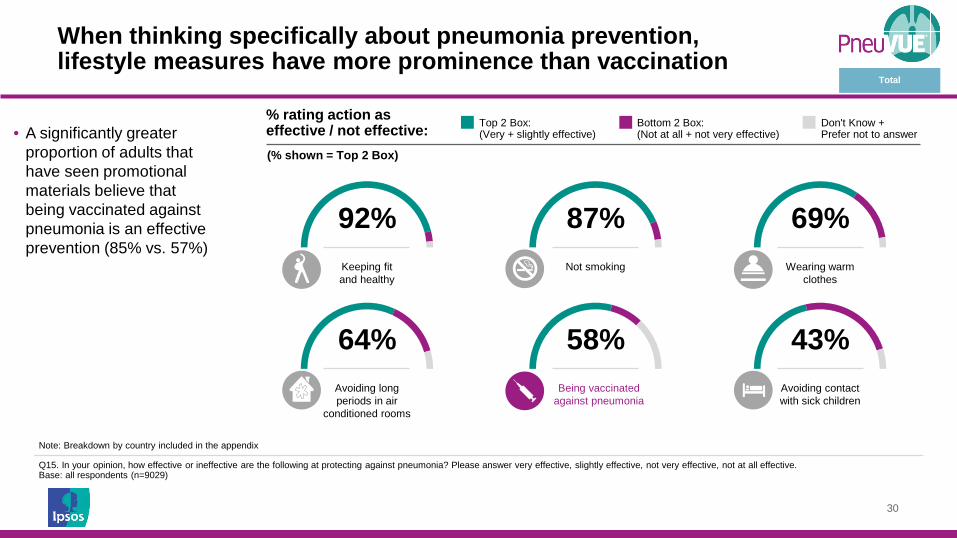
87% Not smoking
64% Avoiding long periods in air
conditioned rooms
58% Being vaccinated
against pneumonia
92% Keeping fit and healthy
69% Wearing warm
clothes
43% Avoiding contact with sick children
Note: Breakdown by country included in the appendix
Q15. In your opinion, how effective or ineffective are the following at protecting against pneumonia? Please answer very effective, slightly effective, not very effective, not at all effective. Base: all respondents (n=9029)
Total
• A significantly greater proportion of adults that have seen promotional materials believe that being vaccinated against pneumonia is an effective prevention (85% vs. 57%)
% rating action as effective / not effective: (% shown = Top 2 Box)
When thinking specifically about pneumonia prevention, lifestyle measures have more prominence than vaccination
31
Pneumonia vaccination
Awareness of the vaccine is low and there is a poor conversion rate from being aware to taking action with even lower levels of vaccination
32
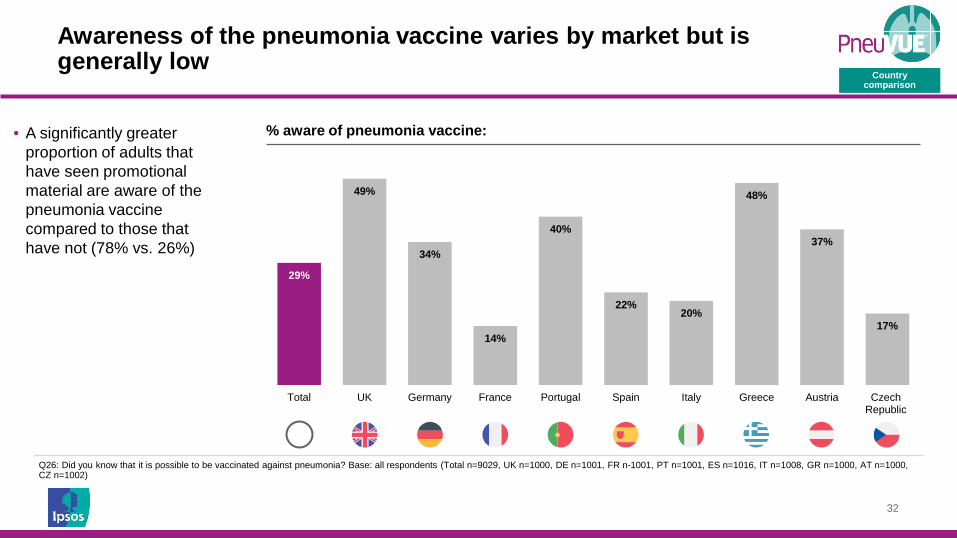
29%
49%
34%
14%
40%
22% 20%
48%
37%
17%
Total UK Germany France Portugal Spain Italy Greece Austria CzechRepublic
Country comparison
Q26: Did you know that it is possible to be vaccinated against pneumonia? Base: all respondents (Total n=9029, UK n=1000, DE n=1001, FR n-1001, PT n=1001, ES n=1016, IT n=1008, GR n=1000, AT n=1000, CZ n=1002)
% aware of pneumonia vaccine:
Awareness of the pneumonia vaccine varies by market but is generally low
• A significantly greater proportion of adults that have seen promotional material are aware of the pneumonia vaccine compared to those that have not (78% vs. 26%)
33
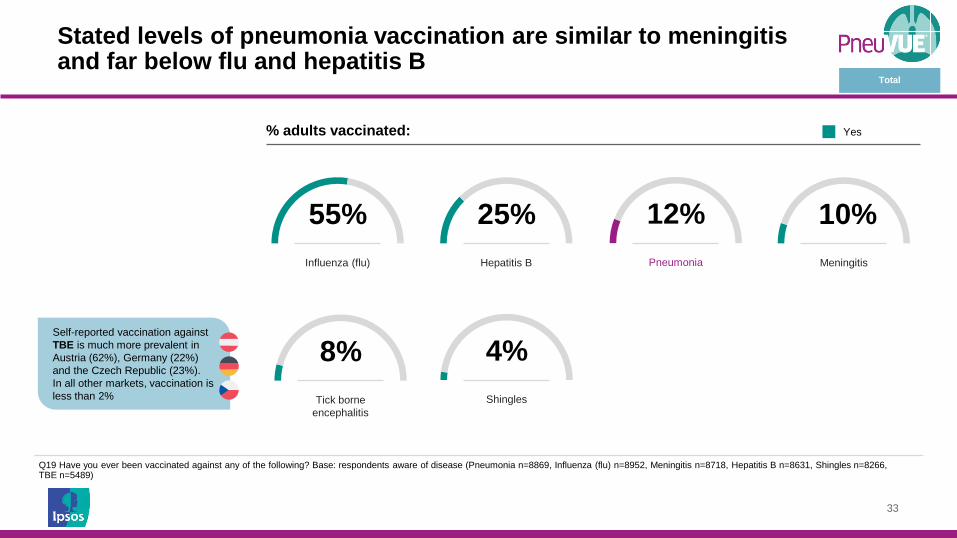
55% Influenza (flu)
Stated levels of pneumonia vaccination are similar to meningitis and far below flu and hepatitis B
Pneumonia
12% 10% Meningitis
25% Hepatitis B
4% Shingles
8% Tick borne
encephalitis
Self-reported vaccination against TBE is much more prevalent in Austria (62%), Germany (22%) and the Czech Republic (23%). In all other markets, vaccination is less than 2%
Q19 Have you ever been vaccinated against any of the following? Base: respondents aware of disease (Pneumonia n=8869, Influenza (flu) n=8952, Meningitis n=8718, Hepatitis B n=8631, Shingles n=8266, TBE n=5489)
Total
Yes % adults vaccinated:
34
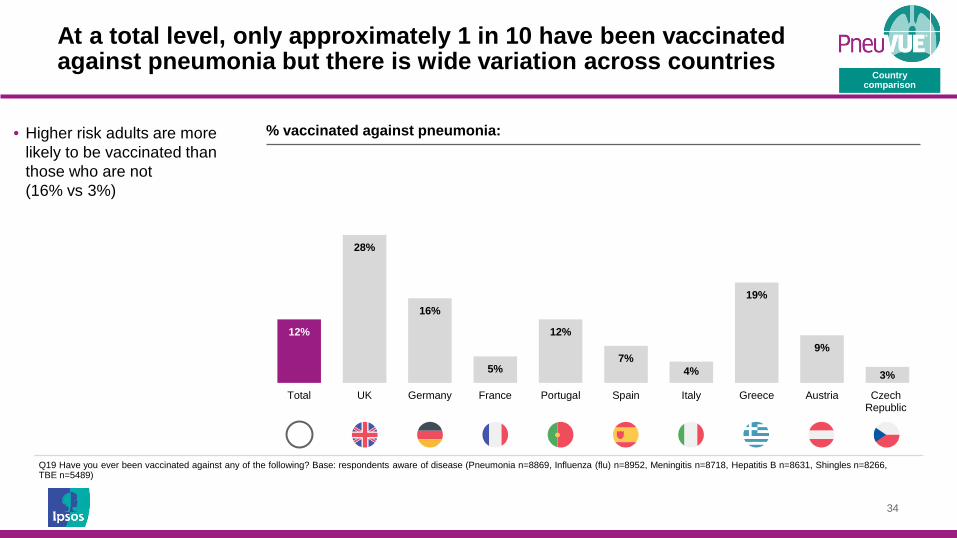
12%
28%
16%
5%
12%
7% 4%
19%
9%
3%
Total UK Germany France Portugal Spain Italy Greece Austria CzechRepublic
Country comparison
Q19 Have you ever been vaccinated against any of the following? Base: respondents aware of disease (Pneumonia n=8869, Influenza (flu) n=8952, Meningitis n=8718, Hepatitis B n=8631, Shingles n=8266, TBE n=5489)
% vaccinated against pneumonia: • Higher risk adults are more likely to be vaccinated than those who are not (16% vs 3%)
At a total level, only approximately 1 in 10 have been vaccinated against pneumonia but there is wide variation across countries
35
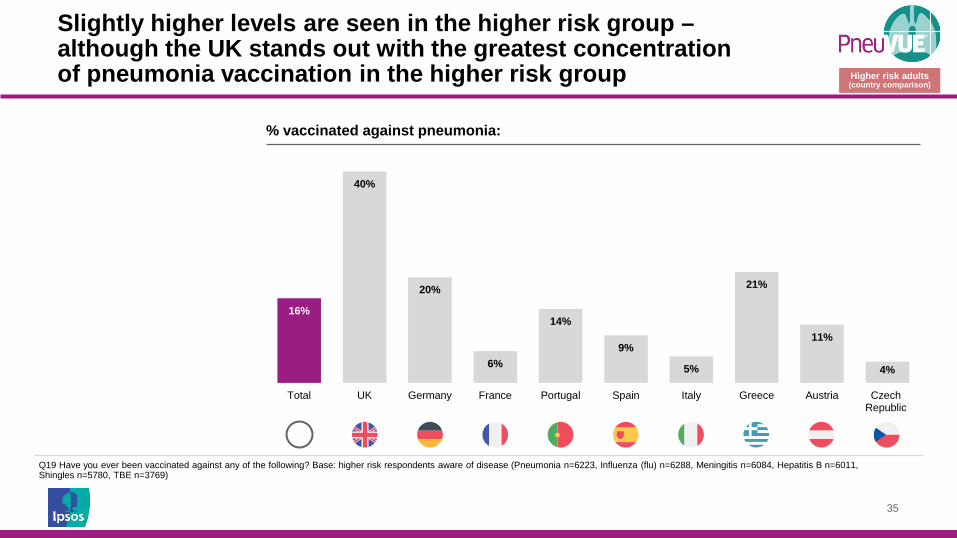
16%
40%
20%
6%
14%
9%
5%
21%
11%
4%
Total UK Germany France Portugal Spain Italy Greece Austria CzechRepublic
Q19 Have you ever been vaccinated against any of the following? Base: higher risk respondents aware of disease (Pneumonia n=6223, Influenza (flu) n=6288, Meningitis n=6084, Hepatitis B n=6011, Shingles n=5780, TBE n=3769)
% vaccinated against pneumonia:
Slightly higher levels are seen in the higher risk group – although the UK stands out with the greatest concentration of pneumonia vaccination in the higher risk group Higher risk adults
(country comparison)
36
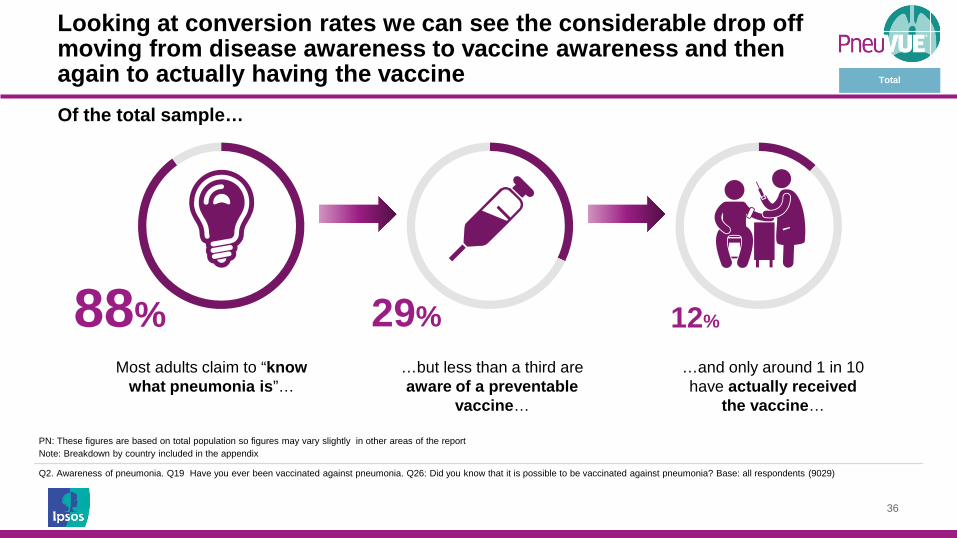
29% 12%
Most adults claim to “know what pneumonia is”…
…but less than a third are aware of a preventable
vaccine…
…and only around 1 in 10 have actually received
the vaccine…
88%
Of the total sample…
Total
PN: These figures are based on total population so figures may vary slightly in other areas of the report Note: Breakdown by country included in the appendix
Q2. Awareness of pneumonia. Q19 Have you ever been vaccinated against pneumonia. Q26: Did you know that it is possible to be vaccinated against pneumonia? Base: all respondents (9029)
Looking at conversion rates we can see the considerable drop off moving from disease awareness to vaccine awareness and then again to actually having the vaccine
37
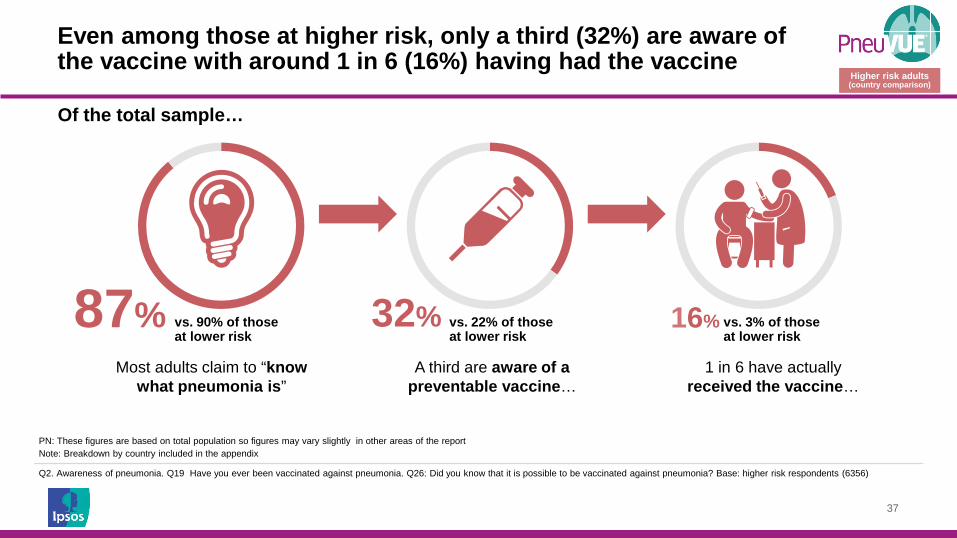
32% 16%
Most adults claim to “know what pneumonia is”
A third are aware of a preventable vaccine…
1 in 6 have actually received the vaccine…
87% vs. 90% of those at lower risk
vs. 22% of those at lower risk
vs. 3% of those at lower risk
Higher risk adults (country comparison)
Of the total sample…
PN: These figures are based on total population so figures may vary slightly in other areas of the report Note: Breakdown by country included in the appendix
Q2. Awareness of pneumonia. Q19 Have you ever been vaccinated against pneumonia. Q26: Did you know that it is possible to be vaccinated against pneumonia? Base: higher risk respondents (6356)
Even among those at higher risk, only a third (32%) are aware of the vaccine with around 1 in 6 (16%) having had the vaccine
38
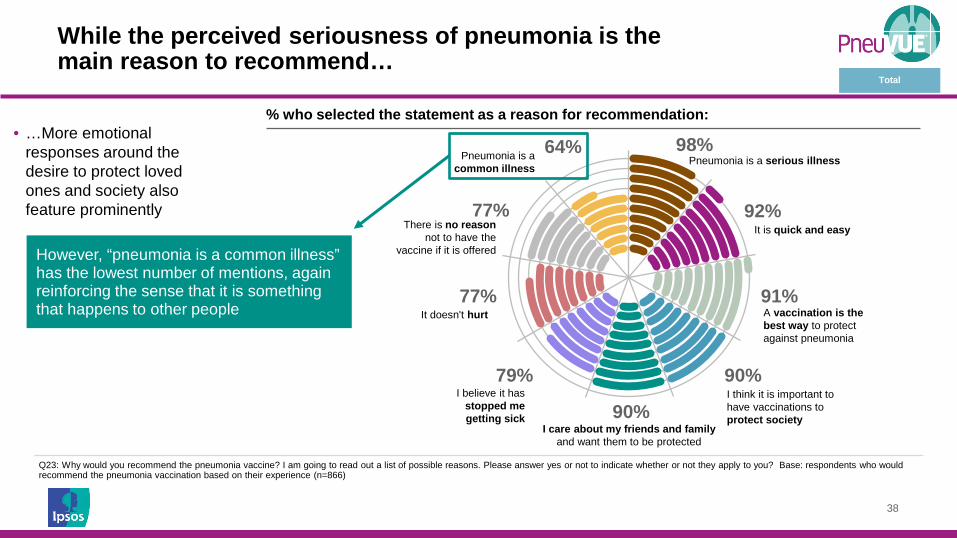
Q23: Why would you recommend the pneumonia vaccine? I am going to read out a list of possible reasons. Please answer yes or not to indicate whether or not they apply to you? Base: respondents who would recommend the pneumonia vaccination based on their experience (n=866)
While the perceived seriousness of pneumonia is the main reason to recommend…
98% 64%
92% 77%
91% 77%
90% 79%
90%
Pneumonia is a serious illness
It is quick and easy
A vaccination is the best way to protect against pneumonia
I think it is important to have vaccinations to protect society
I care about my friends and family and want them to be protected
I believe it has stopped me getting sick
It doesn't hurt
There is no reason not to have the
vaccine if it is offered
Pneumonia is a common illness
Total
% who selected the statement as a reason for recommendation: • …More emotional
responses around the desire to protect loved ones and society also feature prominently
However, “pneumonia is a common illness” has the lowest number of mentions, again reinforcing the sense that it is something that happens to other people
39
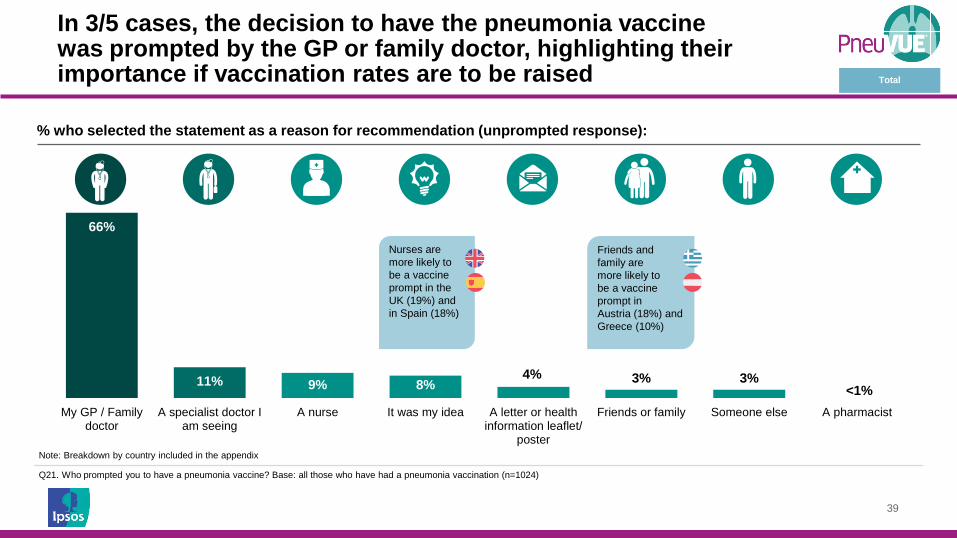
66%
11% 9% 8% 4% 3% 3%
My GP / Familydoctor
A specialist doctor Iam seeing
A nurse It was my idea A letter or healthinformation leaflet/
poster
Friends or family Someone else A pharmacist
Nurses are more likely to be a vaccine prompt in the UK (19%) and in Spain (18%)
Friends and family are more likely to be a vaccine prompt in Austria (18%) and Greece (10%)
<1%
Note: Breakdown by country included in the appendix
Q21. Who prompted you to have a pneumonia vaccine? Base: all those who have had a pneumonia vaccination (n=1024)
Total
In 3/5 cases, the decision to have the pneumonia vaccine was prompted by the GP or family doctor, highlighting their importance if vaccination rates are to be raised
% who selected the statement as a reason for recommendation (unprompted response):
40
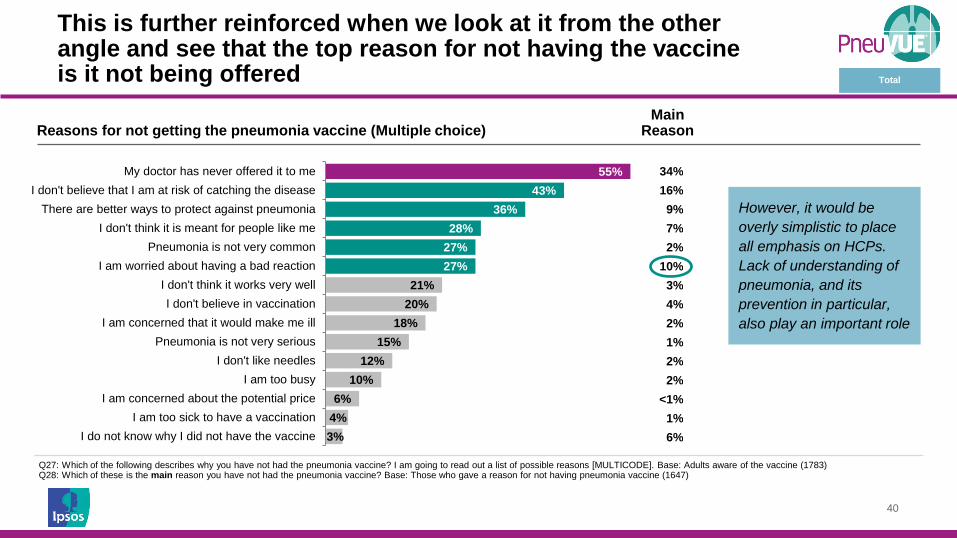
Q27: Which of the following describes why you have not had the pneumonia vaccine? I am going to read out a list of possible reasons [MULTICODE]. Base: Adults aware of the vaccine (1783) Q28: Which of these is the main reason you have not had the pneumonia vaccine? Base: Those who gave a reason for not having pneumonia vaccine (1647)
55% 43%
36% 28%
27% 27%
21% 20%
18% 15%
12% 10%
6% 4% 3%
My doctor has never offered it to meI don't believe that I am at risk of catching the disease
There are better ways to protect against pneumoniaI don't think it is meant for people like me
Pneumonia is not very commonI am worried about having a bad reaction
I don't think it works very wellI don't believe in vaccination
I am concerned that it would make me illPneumonia is not very serious
I don't like needlesI am too busy
I am concerned about the potential priceI am too sick to have a vaccination
I do not know why I did not have the vaccine
34% 16%
9% 7% 2%
10% 3% 4% 2% 1% 2% 2%
<1% 1% 6%
However, it would be overly simplistic to place all emphasis on HCPs. Lack of understanding of pneumonia, and its prevention in particular, also play an important role
Total
This is further reinforced when we look at it from the other angle and see that the top reason for not having the vaccine is it not being offered
Reasons for not getting the pneumonia vaccine (Multiple choice) Main
Reason
41
26% 25% 27% 30% 23% 26% 22% 22% 22% 25%
27% 50%
19% 13%
52% 37% 25%
47%
15% 17%
-19% -11% -29%
-19% -10% -14% -19% -7%
-30% -27%
-23%
-13%
-22% -33%
-11% -15%
-28%
-21%
-29% -27%
% li
kely
%
unl
ikel
y
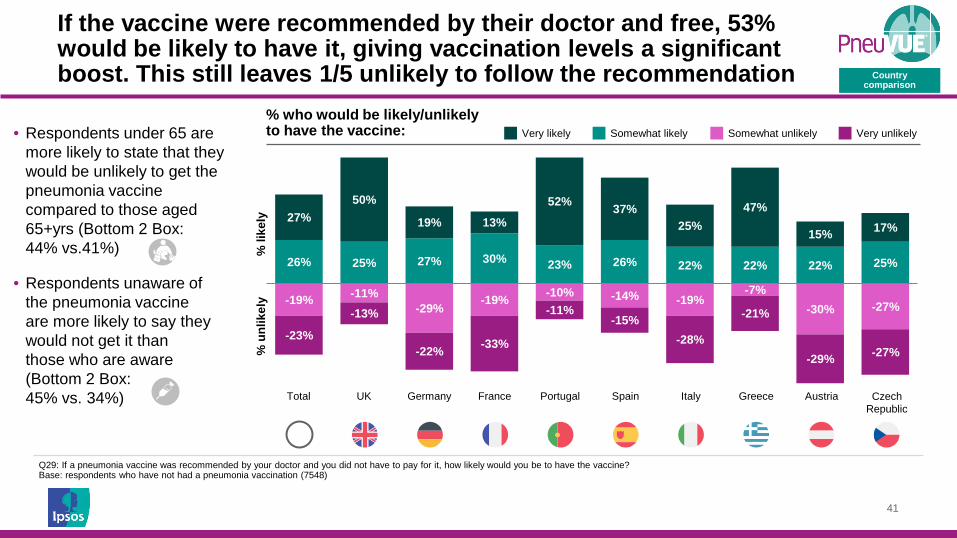
Q29: If a pneumonia vaccine was recommended by your doctor and you did not have to pay for it, how likely would you be to have the vaccine? Base: respondents who have not had a pneumonia vaccination (7548)
Country comparison
• Respondents under 65 are more likely to state that they would be unlikely to get the pneumonia vaccine compared to those aged 65+yrs (Bottom 2 Box: 44% vs.41%)
• Respondents unaware of the pneumonia vaccine are more likely to say they would not get it than those who are aware (Bottom 2 Box: 45% vs. 34%)
If the vaccine were recommended by their doctor and free, 53% would be likely to have it, giving vaccination levels a significant boost. This still leaves 1/5 unlikely to follow the recommendation
Very likely % who would be likely/unlikely to have the vaccine:
Total UK Germany France Portugal Spain Italy Greece Austria Czech Republic
Somewhat likely Somewhat unlikely Very unlikely
42
27% 29% I try to avoid vaccines because I think they are
not safe
I don’t need vaccines because I don’t think I am
at risk of getting ill
Negative statements
Note: Breakdown for other diseases included in the appendix
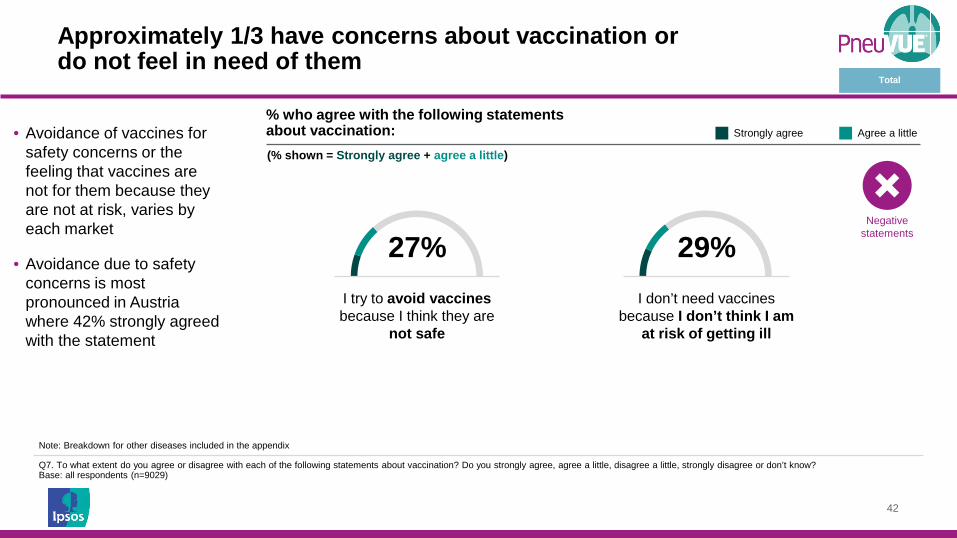
Q7. To what extent do you agree or disagree with each of the following statements about vaccination? Do you strongly agree, agree a little, disagree a little, strongly disagree or don’t know? Base: all respondents (n=9029)
• Avoidance of vaccines for safety concerns or the feeling that vaccines are not for them because they are not at risk, varies by each market
• Avoidance due to safety concerns is most pronounced in Austria where 42% strongly agreed with the statement
% who agree with the following statements about vaccination:
Total
Approximately 1/3 have concerns about vaccination or do not feel in need of them
(% shown = Strongly agree + agree a little)
Strongly agree Agree a little
43
Pneumonia as a disease in general
Risk factors for catching pneumonia
Vaccination against pneumonia
% that would like to see more information about this topic:
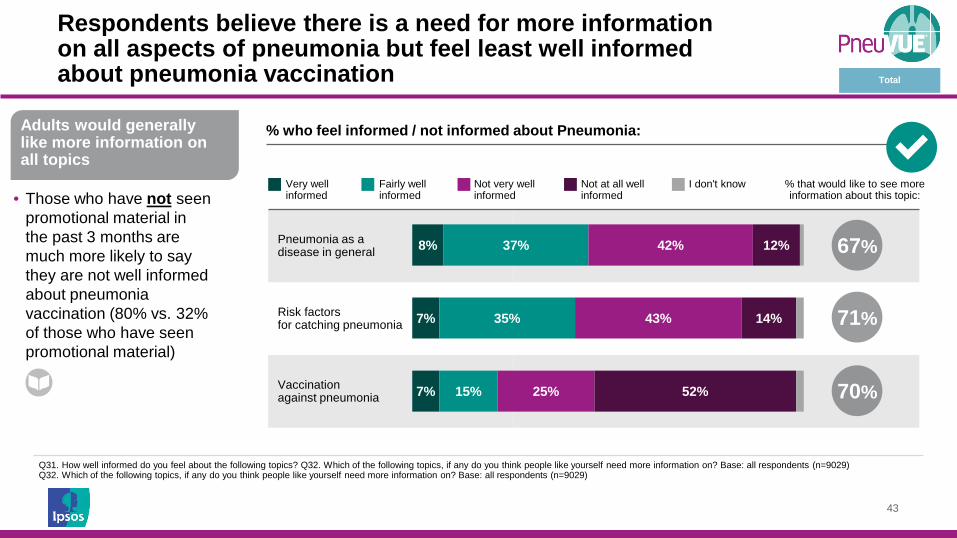
Respondents believe there is a need for more information on all aspects of pneumonia but feel least well informed about pneumonia vaccination
8%
7%
7%
37%
35%
15%
42%
43%
25%
12%
14%
52%
Very well informed
Fairly well informed
Not very well informed
Not at all well informed
I don't know
67%
71%
70%
Adults would generally like more information on all topics
Total
• Those who have not seen promotional material in the past 3 months are much more likely to say they are not well informed about pneumonia vaccination (80% vs. 32% of those who have seen promotional material)
Q31. How well informed do you feel about the following topics? Q32. Which of the following topics, if any do you think people like yourself need more information on? Base: all respondents (n=9029) Q32. Which of the following topics, if any do you think people like yourself need more information on? Base: all respondents (n=9029)
% who feel informed / not informed about Pneumonia:
44
92%
65% 65%
53% 53% 51% 50% 50%
37% 37%
Doctor TV Pharmacist Healthcarewebsites
Radio Nurse Newspapers Googlesearches
Lifestylemagazines
Friends andfamily
Note: Breakdown for other diseases included in the appendix
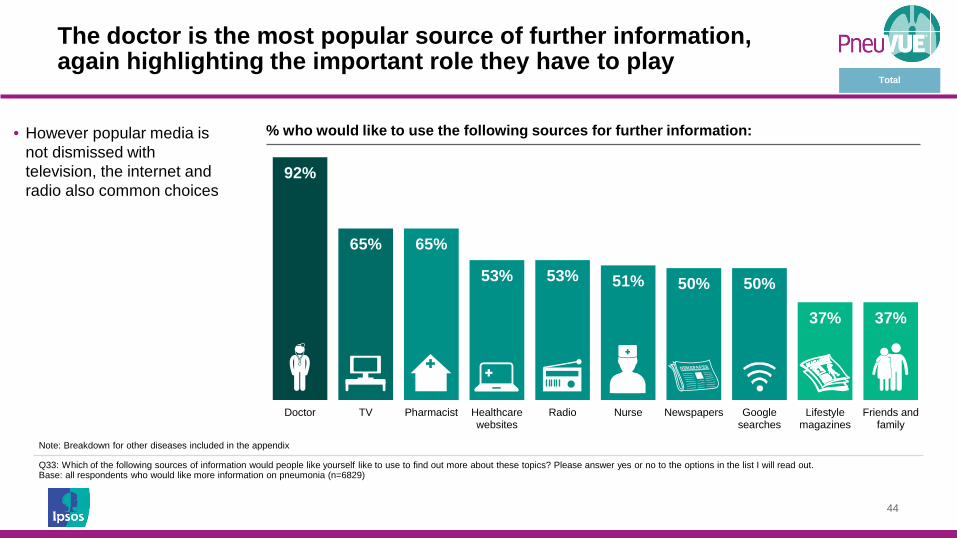
Q33: Which of the following sources of information would people like yourself like to use to find out more about these topics? Please answer yes or no to the options in the list I will read out. Base: all respondents who would like more information on pneumonia (n=6829)
Total
% who would like to use the following sources for further information: • However popular media is not dismissed with television, the internet and radio also common choices
The doctor is the most popular source of further information, again highlighting the important role they have to play

45
Conclusions & Recommendations
46
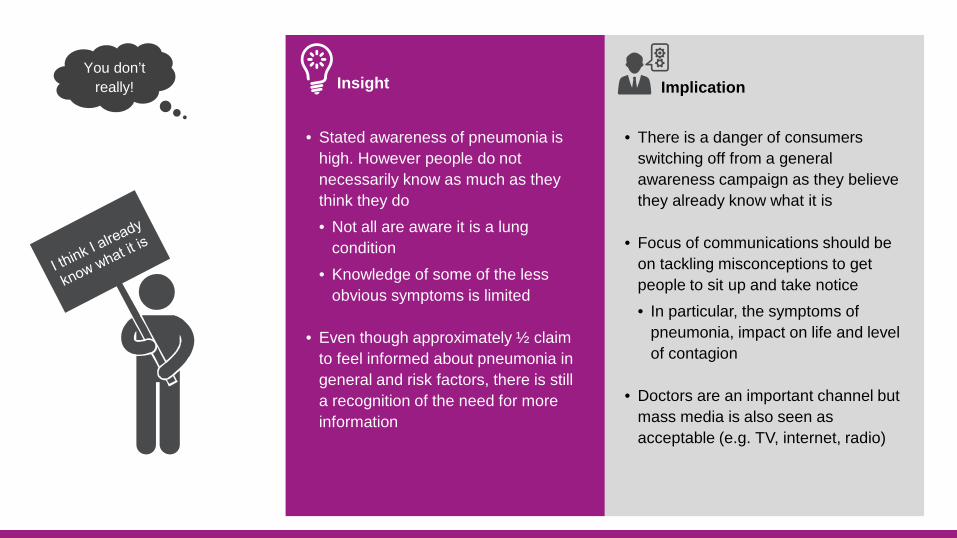
You don’t really! Insight Implication
• Stated awareness of pneumonia is high. However people do not necessarily know as much as they think they do • Not all are aware it is a lung
condition • Knowledge of some of the less
obvious symptoms is limited
• Even though approximately ½ claim to feel informed about pneumonia in general and risk factors, there is still a recognition of the need for more information
• There is a danger of consumers switching off from a general awareness campaign as they believe they already know what it is
• Focus of communications should be on tackling misconceptions to get people to sit up and take notice • In particular, the symptoms of
pneumonia, impact on life and level of contagion
• Doctors are an important channel but mass media is also seen as acceptable (e.g. TV, internet, radio)
47
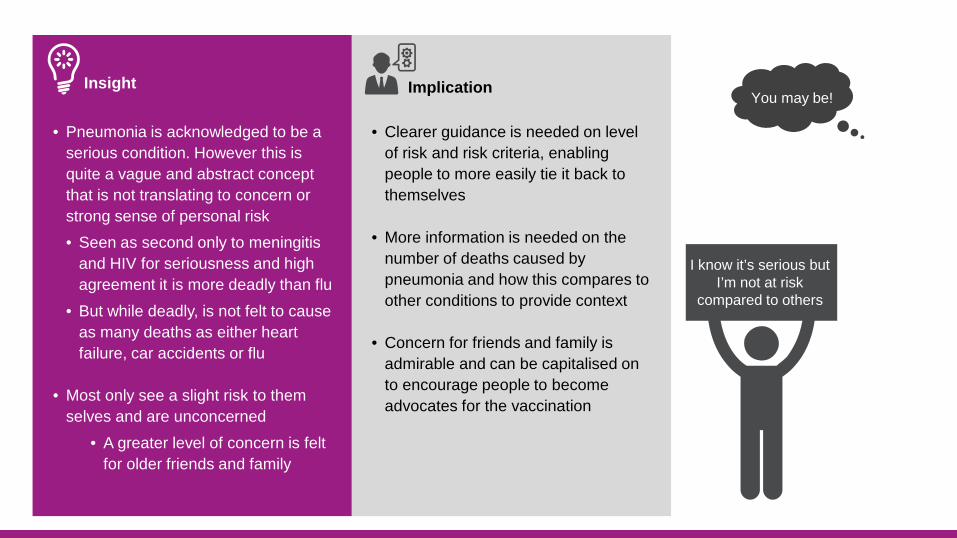
Insight Implication
• Pneumonia is acknowledged to be a serious condition. However this is quite a vague and abstract concept that is not translating to concern or strong sense of personal risk • Seen as second only to meningitis
and HIV for seriousness and high agreement it is more deadly than flu
• But while deadly, is not felt to cause as many deaths as either heart failure, car accidents or flu
• Most only see a slight risk to them selves and are unconcerned
• A greater level of concern is felt for older friends and family
• Clearer guidance is needed on level of risk and risk criteria, enabling people to more easily tie it back to themselves
• More information is needed on the number of deaths caused by pneumonia and how this compares to other conditions to provide context
• Concern for friends and family is admirable and can be capitalised on to encourage people to become advocates for the vaccination
I know it’s serious but I’m not at risk
compared to others
You may be!

48
Yes you could! Insight Implication
• Pneumonia prevention is the topic people feel least well informed about and there is evidence of considerable disinformation • 2/5 don’t believe that pneumonia
can be prevented as well as treated • There is a sense that lifestyle
measures (e.g. keeping fit and healthy, not smoking and staying warm) are more effective means of protecting against pneumonia than vaccination
• Pneumonia sufferers often felt surprised and powerless
• Awareness of the pneumonia vaccine is generally low
• Hand in hand with highlighting personal risk needs to be the empowerment of people to take effective steps to prevent pneumonia • Emphasis the preventable nature of
the disease and efficacy of the vaccine particularly in relation to other lifestyle measures
• Attempt to normalise pneumonia vaccination to the same extent as flu
• Work towards incorporating pneumonia vaccination into the health screening checklist for 50+
49
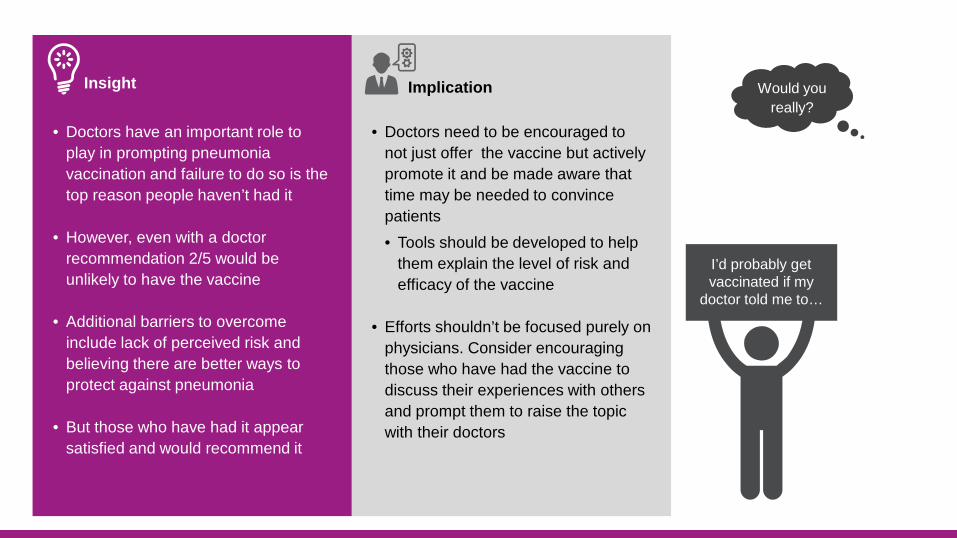
Insight Implication
• Doctors have an important role to play in prompting pneumonia vaccination and failure to do so is the top reason people haven’t had it
• However, even with a doctor recommendation 2/5 would be unlikely to have the vaccine
• Additional barriers to overcome include lack of perceived risk and believing there are better ways to protect against pneumonia
• But those who have had it appear satisfied and would recommend it
• Doctors need to be encouraged to not just offer the vaccine but actively promote it and be made aware that time may be needed to convince patients • Tools should be developed to help
them explain the level of risk and efficacy of the vaccine
• Efforts shouldn’t be focused purely on physicians. Consider encouraging those who have had the vaccine to discuss their experiences with others and prompt them to raise the topic with their doctors
I’d probably get vaccinated if my
doctor told me to…
Would you really?

50
About PneuVUE®
51
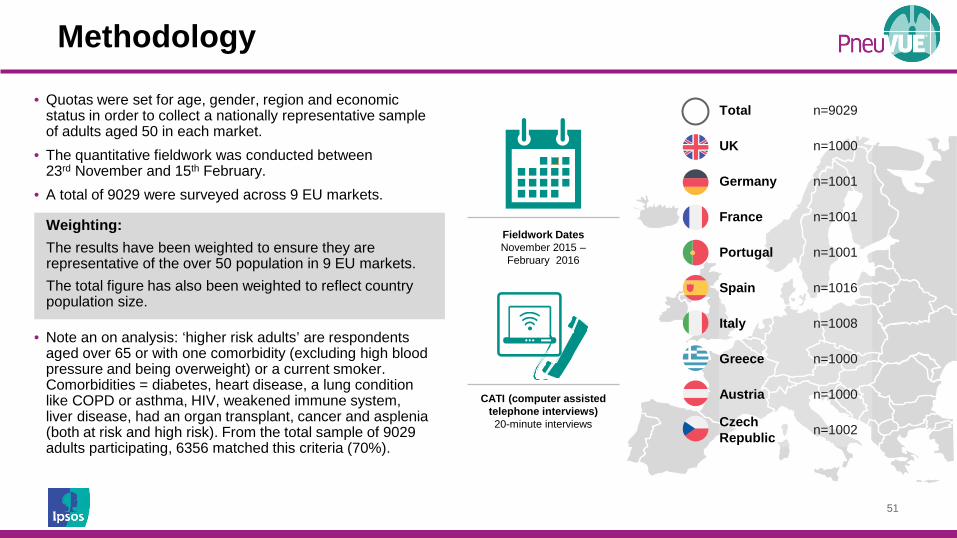
Total n=9029
UK n=1000
Germany n=1001
France n=1001
Portugal n=1001
Spain n=1016
Italy n=1008
Greece n=1000
Austria n=1000
Czech Republic n=1002
• Quotas were set for age, gender, region and economic status in order to collect a nationally representative sample of adults aged 50 in each market.
• The quantitative fieldwork was conducted between 23rd November and 15th February.
• A total of 9029 were surveyed across 9 EU markets.
• Note an on analysis: ‘higher risk adults’ are respondents aged over 65 or with one comorbidity (excluding high blood pressure and being overweight) or a current smoker. Comorbidities = diabetes, heart disease, a lung condition like COPD or asthma, HIV, weakened immune system, liver disease, had an organ transplant, cancer and asplenia (both at risk and high risk). From the total sample of 9029 adults participating, 6356 matched this criteria (70%).
Fieldwork Dates November 2015 –
February 2016
CATI (computer assisted telephone interviews) 20-minute interviews
Weighting: The results have been weighted to ensure they are representative of the over 50 population in 9 EU markets. The total figure has also been weighted to reflect country population size.
Methodology

52
The PneuVUE® Report
Download a full copy of the report at: http://www.ipsos-mori.com/pneu-vue_pneumonia_report
Profile of someone with higher/ lower awareness of pneumonia