Embed Size (px)
Citation preview
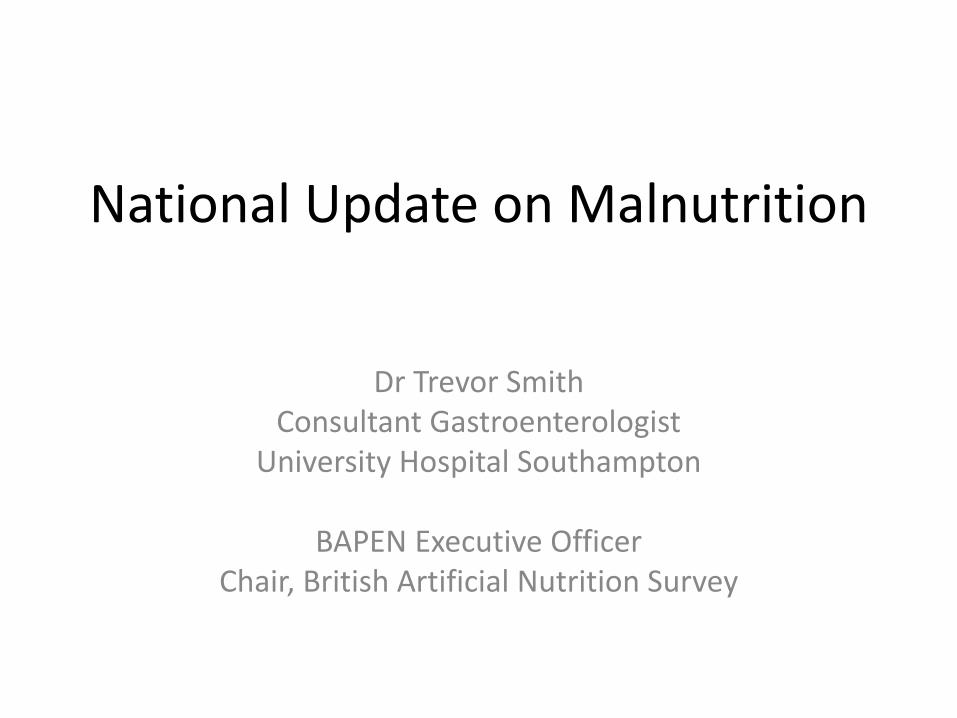
National Update on Malnutrition
Dr Trevor Smith Consultant Gastroenterologist
University Hospital Southampton
BAPEN Executive Officer Chair, British Artificial Nutrition Survey

B A P E N
Malnutrition Matters
British Association for Parenteral and Enteral Nutrition
A multi-disciplinary charity committed to raising awareness of malnutrition and the options for nutritional treatment, along with the impact on health outcomes, resource utilization, and
health & social care budgets.

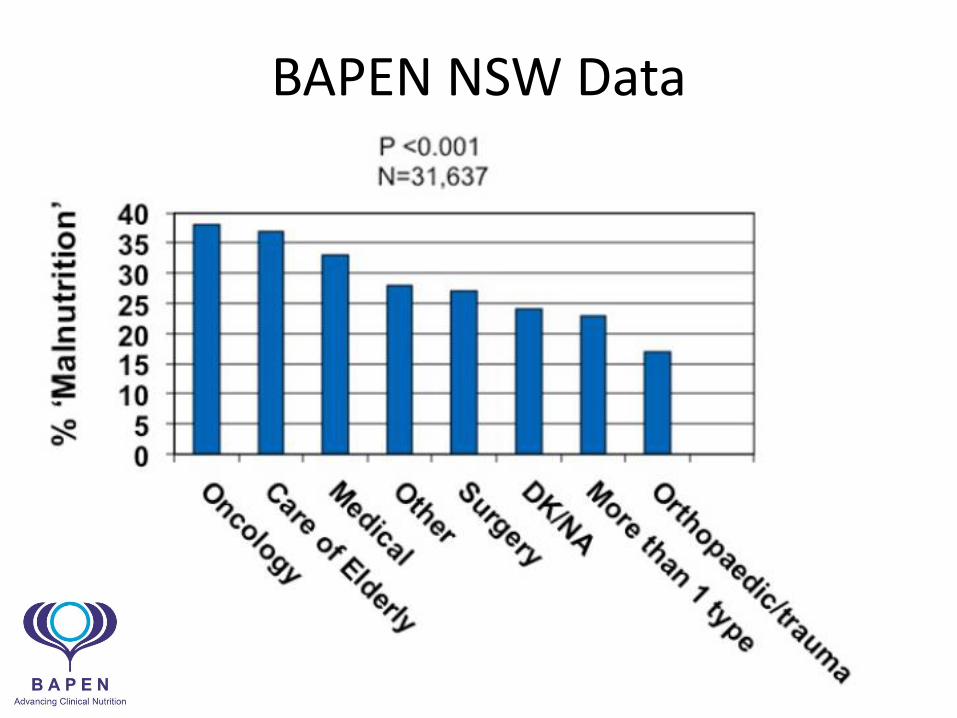
• Malnutrition = medium + high risk MUST score
• 4 annual screening weeks 2007-11
• 2/3 of hospitals had a nutrition team
• 661 hospitals
• 34,699 patients
• 28% malnourished on admission to hospital

BAPEN NSW Data

BAPEN NSW Data

BAPEN NSW Data
BAPEN NSW Data

• 474 care homes
• 3971 adults
• 35% malnourished
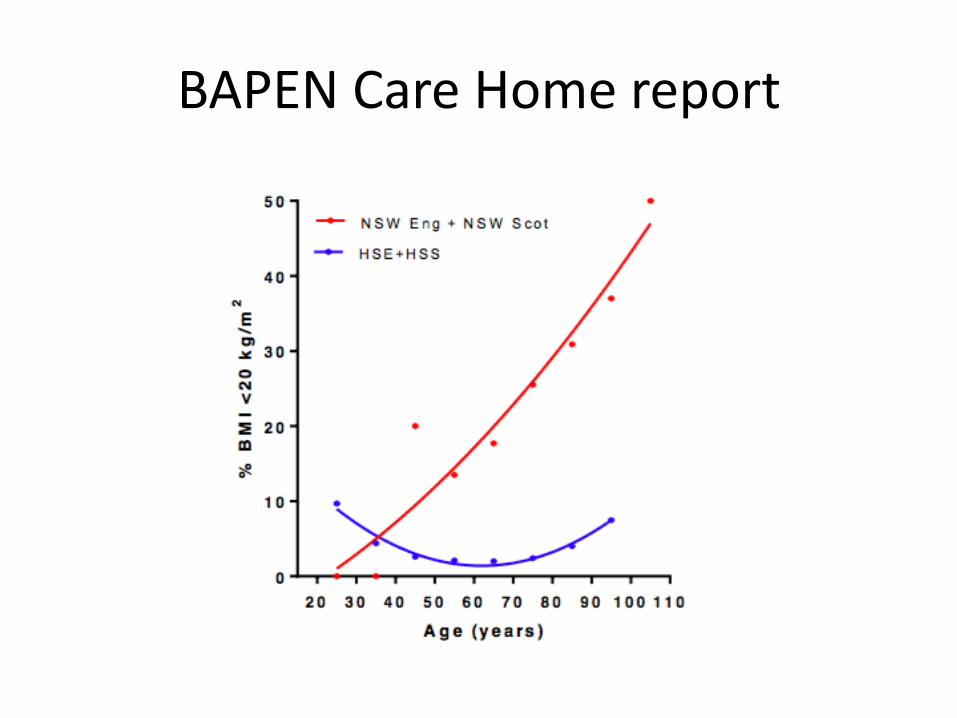
BAPEN Care Home report

BAPEN Care Home report

Prevalence and consequences of malnutrition in the UK
SECONDARY CARE
complications
length of stay
readmissions
mortality
CARE HOMES
30-42% of recently
admitted residents
HOSPITAL
28% of admissions
PRIMARY CARE
hospital dependency
GP visits
prescription costs
SHELTERED HOUSING
10-14% of tenants
HOME
General population (adults)
BMI <20kg/m2 : 5%
BMI <18.5kg/m2 : 1.8%
Elderly: 14%
Prevalence of
malnutrition

Complications of abdominal operations for malignant disease
Meguid et al. Am J Surg 1988
0 10 20 30 40 50 60 70 80 90
100
Complication Rate Post-Operative Mortality
Well nourished
Malnourished

Health & Social Care Budget (England)
Health & social care expenditure associated with malnutrition was £19.6 billion (15% of the total expenditure on health & social care)
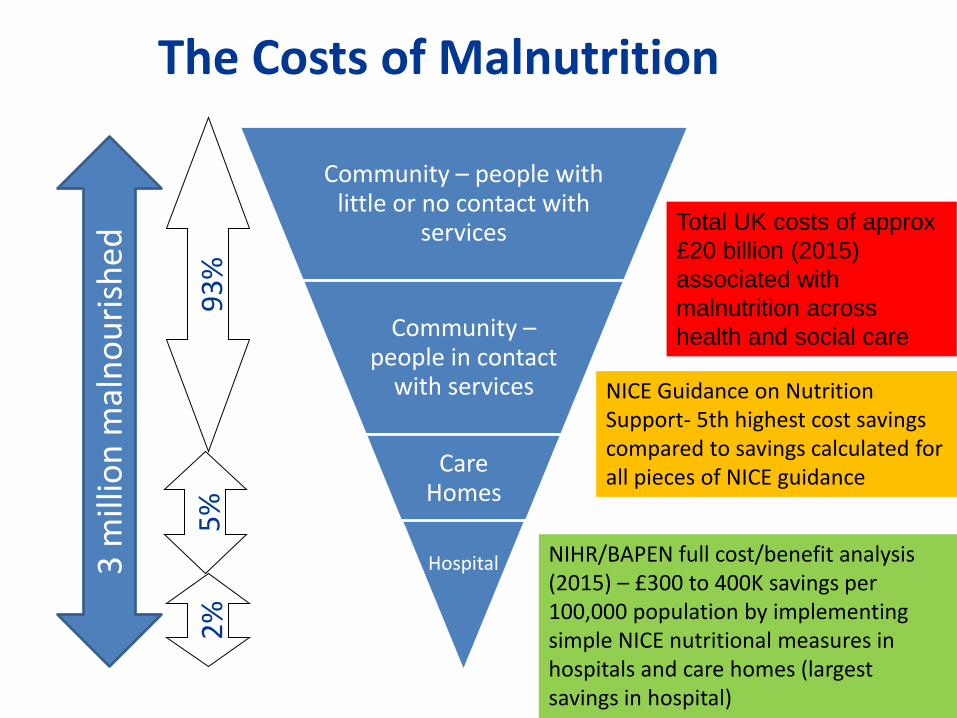
Community – people with little or no contact with
services
Community – people in contact
with services
Care Homes
Hospital
93
%
5%
2
%
3 m
illio
n m
aln
ou
rish
ed
The Costs of Malnutrition
Total UK costs of approx
£20 billion (2015)
associated with
malnutrition across
health and social care
NIHR/BAPEN full cost/benefit analysis (2015) – £300 to 400K savings per 100,000 population by implementing simple NICE nutritional measures in hospitals and care homes (largest savings in hospital)
NICE Guidance on Nutrition Support- 5th highest cost savings compared to savings calculated for all pieces of NICE guidance

The costs of providing nutrition support

The costs of providing nutrition support
Nutrition support does not cost money, it saves money
BAPEN Video
• http://www.bapen.org.uk/how-good-is-your-nutritional-care


Key Outcomes
• To achieved by March 2018
– Leadership
– Understand the local burden of malnutrition
– Review existing service provision
– Commission services that:
• Identify at risk populations
• Implement appropriate interventions
• Connect hospital & community services to deliver a nutrition & hydration pathway
– Public awareness of the importance of good nutrition
– Monitor and evaluate services & outcomes

Measuring the Quality of your Nutritional Care
How good is your Trust or Care
Home?

Why has BAPEN developed a new measurement tool?
Background
•Around 30% of patients admitted to UK hospitals are malnourished or at risk of malnutrition.
•Patients who are malnourished have poorer clinical outcomes which improve markedly if proper nutritional care is given, yet our learning from Trusts is that nutritional care continues to be fragmented
•In part, this may reflect the lack to date of any means of measuring the quality of the nutritional care they provide, despite NICE issuing both Guidance and Quality Standards for Nutritional Support in Adults
“I understand first-hand the impact nutritional care has on
many other areas of an individual’s health care. By implementing
an effective monitoring process it will potentially have a positive
impact on the patient’s journey throughout the whole healthcare
system which is surely a good thing!”
Steve Brown, Secretary of PINNT

Problems identified in current approaches
‘Tick box’ exercise
Measurement of nutritional care is lagging behind other areas e.g. Cancer, VTE
Heavy reliance of measuring nutritional screening using retrospective audits
Little if any focus on
Accuracy of screening
Quality of the nutritional care plan developed
Monitoring of the implementation of the care plan (beyond poorly completed food record charts and fluid balance charts)
Lack of focus on re-screening
Poor measurement of patient experience of nutritional care
Even poorer measurement of nutritional outcomes
Poor understanding of the barriers (e.g. lack of equipment/nursing time)

Why has BAPEN developed a new measurement tool?
Pre-2012 Post 2015
0
10
20
30
40
50
60
70
80
2007 (N=175)
2008 (N=90)
2010 (N=141)
2011 (N= 147 )
%
C
e
n
t
r
e
s
0-25% patients
26-50% patients
51-75% patients
76-100% patients
•Data collection was paper based •One week per year selected for national nutrition screening audit •Transfer of data to electronic database by hand •Analysis and written report time consuming
The focus in healthcare is shifting from standalone audits to
quality improvement informed by audits
•Data collection via a web platform •Opportunity for frequent data collection •Scope for extensive analytics with a nutrition dashboard •Instant charting and tracking of data over time using funnel plots, pareto charts and run charts
Nutritional Care Dashboard

Aim • To design a web-based, simple national nutritional care tool to
enable clinicians and organisations to measure the different elements that are required for the delivery of good nutritional care (screening, care plans, outcomes and patient experience) in order to identify where local improvements are required

What does the new tool measure?
Organisational details
•Organisation name •Ward/unit •Speciality •Date of collection •Professional group undertaking the survey
Demographics •Age group •Feeding route •Setting •Diagnosis
Nutritional care •Screening (including score on admission) • Re-screening •Nutritional care plan – documented and implemented •Current weight •Unplanned weight loss •Height •Acute illness AND has there been, or likely to be, no nutritional intake for more than 5 days •Subjective criteria •Barriers to nutritional screening
Patient Experience questions
•Have you received all the food and drink or nutritional care you have needed? •Have you received assistance to eat and drink when you have needed help?

What are the benefits of using the new tool in your practice?
The first tool nationally available that will enable you to measure the quality of nutritional care delivered to your patients and to track improvements over time
Provision of robust assurance to your trust board, through the nutritional care dashboard
Point of care measures – facilitate delivering
improvements whilst the patient is still in your care
Completely voluntary – you
decide the frequency and scale
of use
If used across an organisation will highlight areas of
excellent practice and areas where
improvements are needed
It is free to all NHS and Social Care
Organisations in the UK
Contains patient experience questions, as well as screening,
care planning and outcomes
Online e-learning
modules to help interpret the
data collected

Steps to using the tool?
Step 1
Speak to your Chief Nurse or MD or Nutrition
Steering Committee Chair
Step 2
Agree that your organisation wishes to
participate
Step 3
Agree who will act as administrator
Step 6
Read the User Guide on the website
Step 5
Complete the Registration Form
www.bapen.org.uk
Step 4
Create an account: set a username and password
Step 7
Decide which wards or areas will participate in
data collection and who will collect the data
Step 8
Select a date to begin
Step 9
Collect the data
Step 10
Review the data collected using online analytics

Focus areas- the core dashboard
1. % received all the food and drink and/or nutritional care they have needed (Patient experience question 1)
2. % received all assistance to eat and drink they have needed (Patient experience question 2)
3. ‘MUST’ on admission
4. ‘MUST’ rescreening
5. Patients at risk of malnutrition
6. Patients with >5% weight loss in hospital


BAPEN malnutrition self screening www.malnutritionselfscreening.org

BAPEN e-Learning www.bapen.org.uk

Aims of in-hospital nutrition support
NORMALLY NOURISHED Undernourished
BMI<20 Wt Loss >10%
Partial IF IF
To meet EVERY patient’s needs

BANS HPN Data

BANS HPN Data
2008 2009 2010 2011 2012 2013 2014 2015
NewRegistra ons 157 148 228 262 351 472 400 420
PointPrevalence 413 345 523 611 888 1082 933 1144
PeriodPrevalence 521 435 624 743 1082 1310 1135 1360
0
200
400
600
800
1000
1200
1400
1600
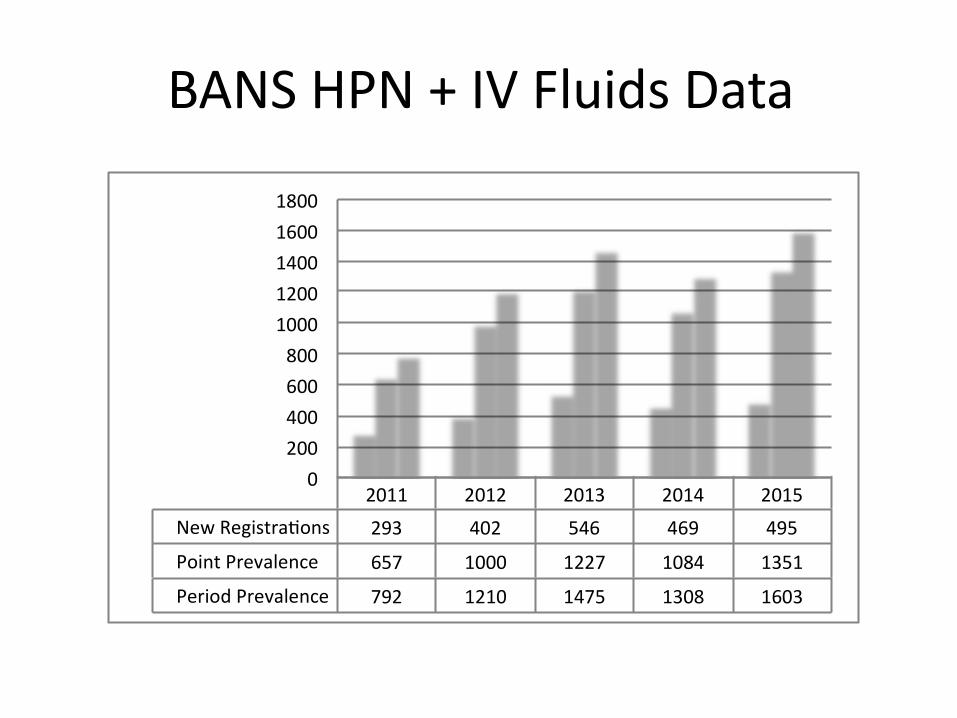
BANS HPN + IV Fluids Data
2011 2012 2013 2014 2015
NewRegistra ons 293 402 546 469 495
PointPrevalence 657 1000 1227 1084 1351
PeriodPrevalence 792 1210 1475 1308 1603
0
200
400
600
800
1000
1200
1400
1600
1800

BANS HPN: Age Categories
0
5
10
15
20
25
16-20Yrs
21-30Yrs
31-40Yrs
41-50Yrs
51-60Yrs
61-70Yrs
71-80Yrs
81-90Yrs
91-100Yrs
2011
2015
% pts >70 yrs: 2008 – 10%; 2011 – 14%; 2015 – 18.5%

0
5
10
15
20
25
30
35
16-20Yrs
21-30Yrs
31-40Yrs
41-50Yrs
51-60Yrs
61-70Yrs
71-80Yrs
81-90Yrs
91-100Yrs
2011
2015
BANS IV Fluids: Age Categories
% pts >70 yrs: 2011 – 16%; 2015 – 24%

BANS HPN: Diagnosis
2008 2009 2010 2011 2012 2013 2014 2015
Cancer 15.3 9.5 14 16.4 18.8 24.6 25.5 27.4
Non-malignantGI 75.8 83.1 79.8 74.8 74.9 70.1 67.8 64.8
OtherCondi ons 8.9 7.4 6.1 8.8 6.3 5.3 6.7 7.8
0
10
20
30
40
50
60
70
80
90
Cancer: 24 pts (2008); 43 pts (2011); 115 pts (2015)
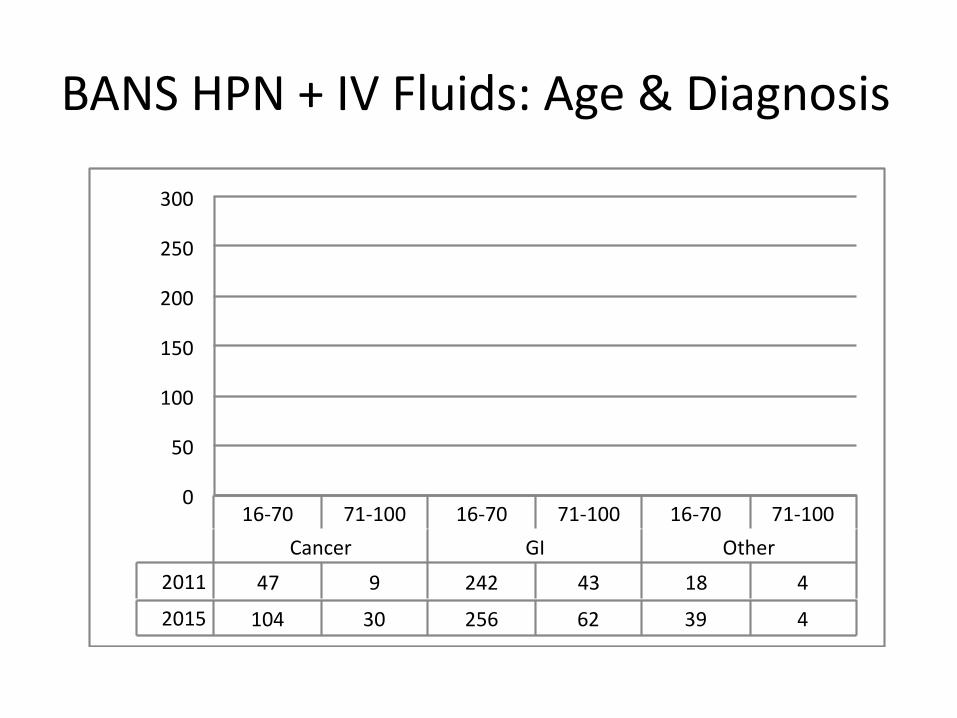
BANS HPN + IV Fluids: Age & Diagnosis
16-70 71-100 16-70 71-100 16-70 71-100
Cancer GI Other
2011 47 9 242 43 18 4
2015 104 30 256 62 39 4
0
50
100
150
200
250
300
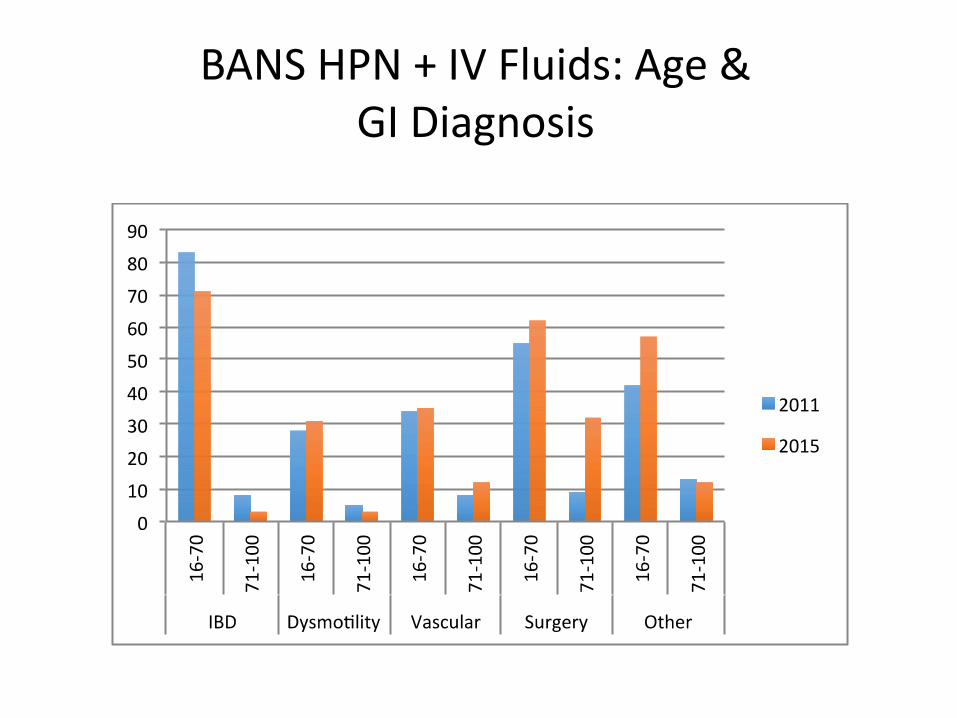
BANS HPN + IV Fluids: Age & GI Diagnosis

BAPEN’s vision for success
Page 43
1
2
3
4
5
Prevention of malnutrition and dehydration wherever possible
Screening Identify malnutrition/ risk of malnutrition early through
screening and assessment e.g. the ‘MUST’ Tool
Treatment – high quality food and drink, assistance with feeding,
nutritional support where required & ‘individualised’ care pathways
Education and training for all care staff appropriate to setting, profession and
responsibilities
Commissioning and Provider systems that facilitate multidisciplinary
nutritional care in all health and social care settings
The 5 tenets of good nutritional care