Embed Size (px)
Citation preview
Magnit at a Glance
Magnit at a Glance
As of June 30, 2015Source: Company, Bloomberg, * - as of FY2014 2
2 233Cities & Towns
№1Russian Food RetailChain by Revenueand Number of Stores
10 728Total Numberof Stores
3 928thous.sq.m.Selling Space
29DCs
5 926Trucks
Multi-format Business ModelComprising Convenience, Hypermarkets,“Magnit Family” & Drogerie Stores
№2Retailer in Europein MarketCapitalization $26bn Market
Capitalization >6% Share in RussianGrocery Sector ⃰
Shareholder Structure as of 1H2015
55,8%Free-float
36,5%Sergey Galitskiy, CEO
3,2%Other
4,5%Lavreno Ltd. (Cyprus)0,1%
Magnit at a Glance
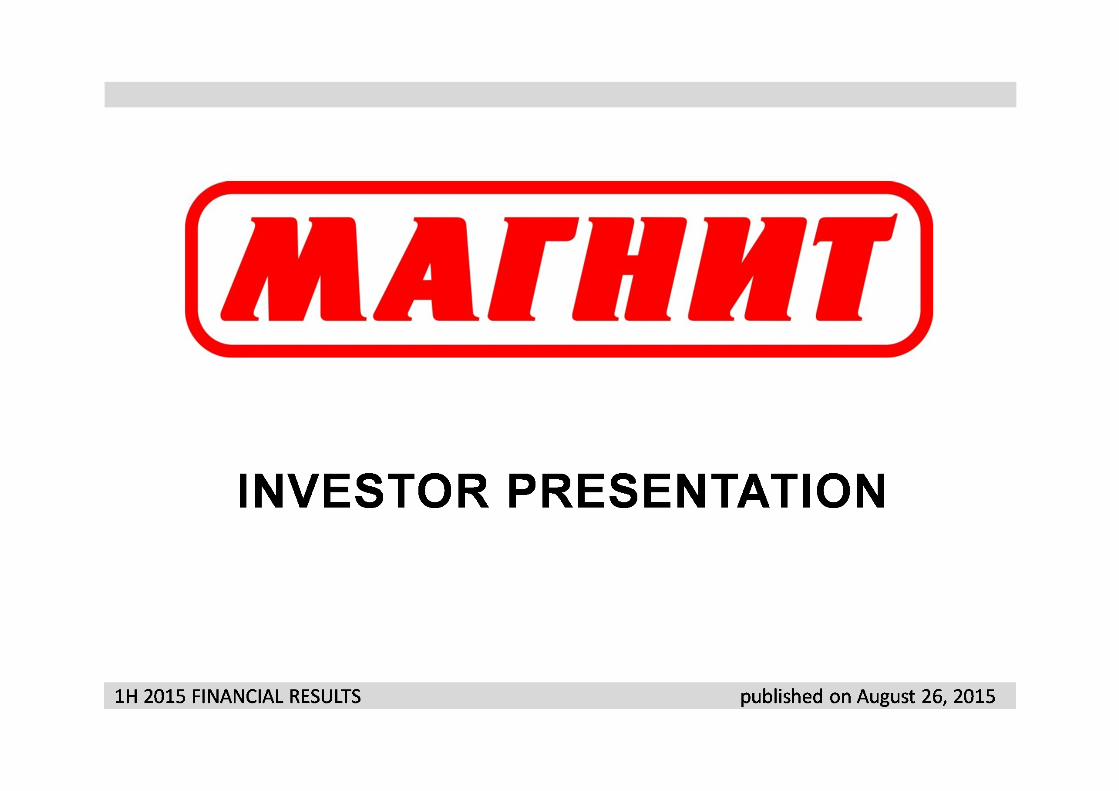
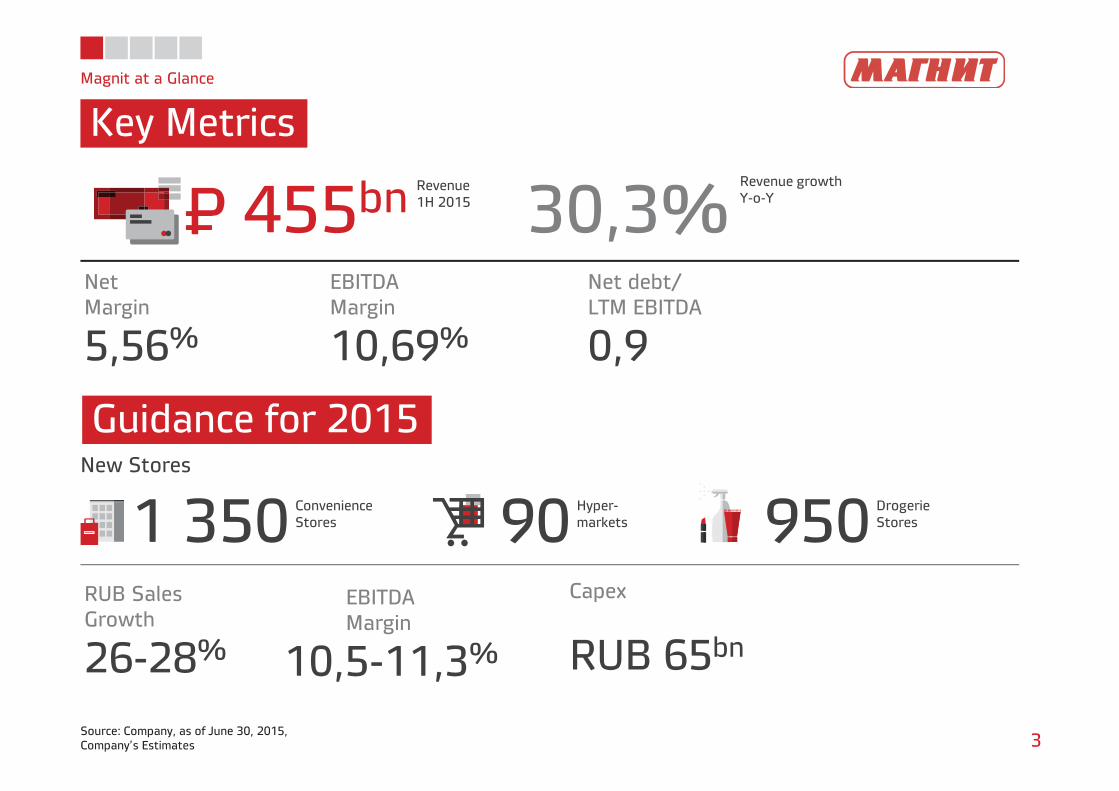
Key Metrics
3Source: Company, as of June 30, 2015,Company’s Estimates
New Stores
455bn 30,3%Revenue1H 2015
5,56%
NetMargin
10,69%
EBITDAMargin
0,9
Net debt/LTM EBITDA
1 350 ConvenienceStores 90 Hyper-
markets 950 DrogerieStores
26-28%
RUB SalesGrowth
10,5-11,3%
EBITDAMargin
RUB 65bn
Capex
P=Revenue growthY-o-Y
Guidance for 2015
Magnit at a Glance
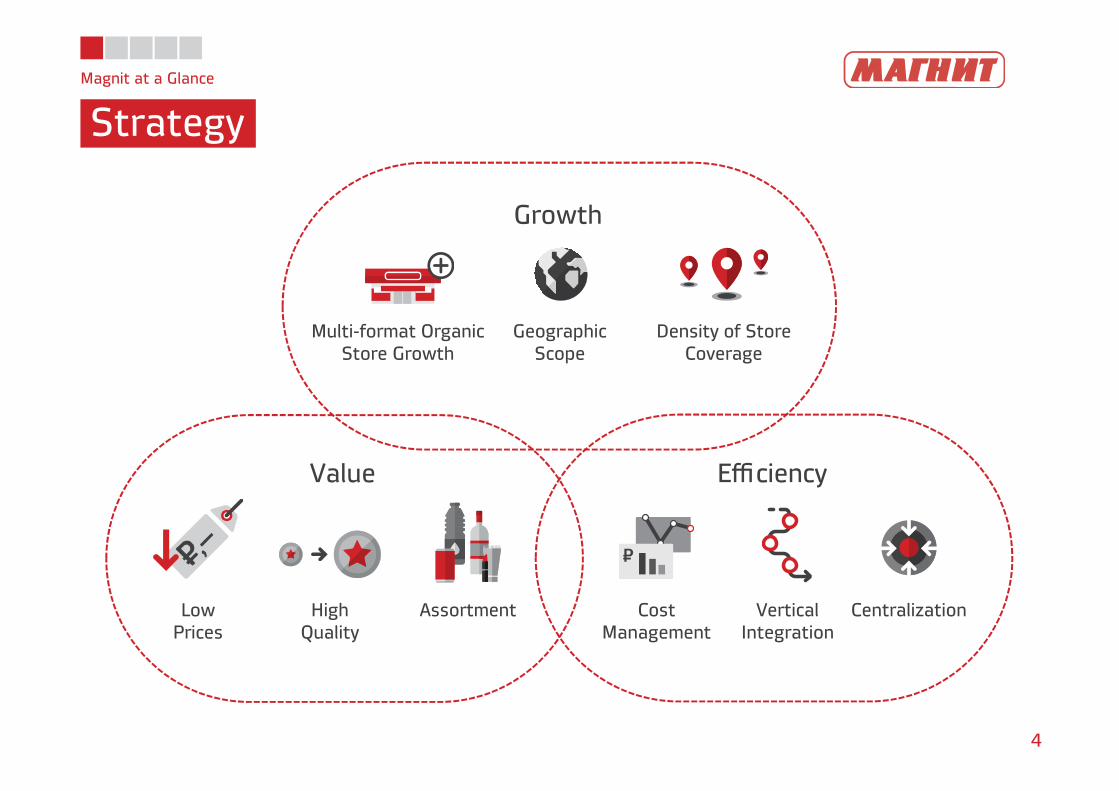
Strategy
4
Growth
Value Efficiency
Multi-format OrganicStore Growth
GeographicScope
Density of StoreCoverage
LowPrices
HighQuality
Assortment CostManagement
VerticalIntegration
Centralization
53
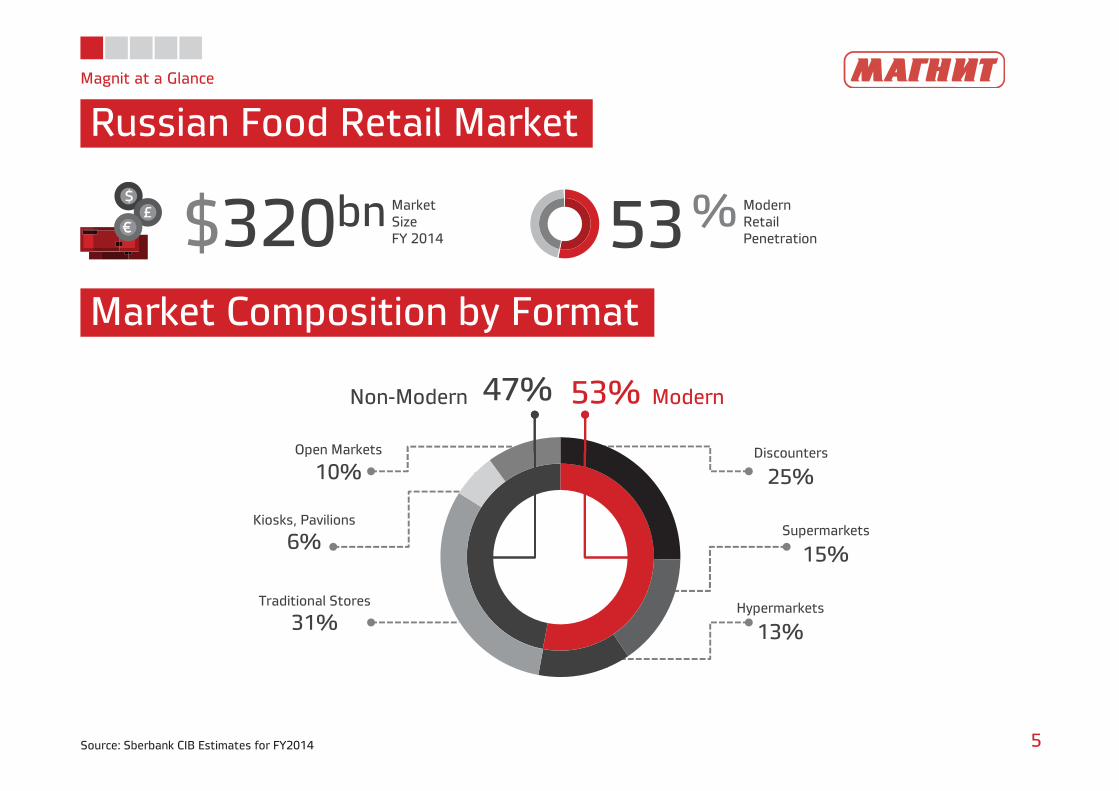
53%47%
Discounters
25%
Supermarkets
15%
Hypermarkets
13%
Traditional Stores
31%
Kiosks, Pavilions
6%
Open Markets
10%
Magnit at a Glance
Russian Food Retail Market
5
Market Composition by Format
$320bn MarketSizeFY 2014
% ModernRetailPenetration
Non-Modern Modern
Source: Sberbank CIB Estimates for FY2014
Magnit at a Glance
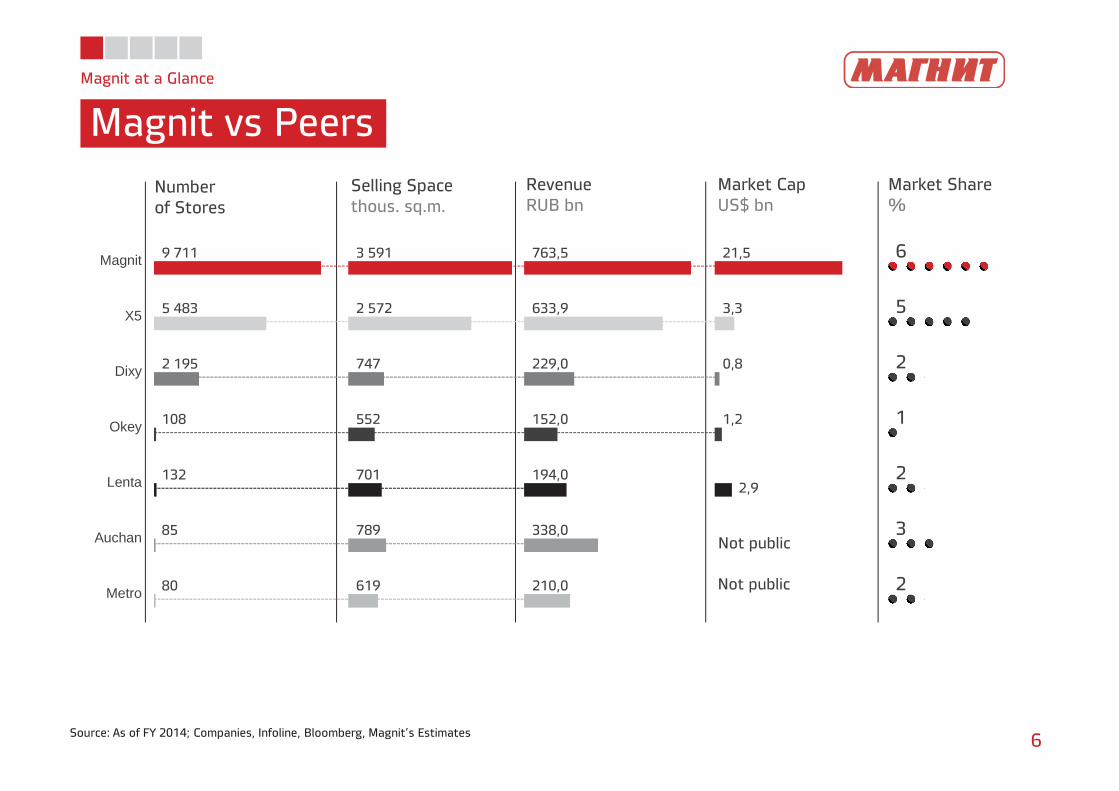
Magnit vs Peers
6Source: As of FY 2014; Companies, Infoline, Bloomberg, Magnit’s Estimates
Numberof Stores
Selling Spacethous. sq.m.
RevenueRUB bn
Market CapUS$ bn
Market Share%
9 711
5 483
2 195
108
132
85
80
Magnit
X5
Dixy
Okey
Lenta
Auchan
Metro
3 591
2 572
747
552
701
789
619
763,5
633,9
229,0
152,0
194,0
338,0
210,0
21,5
3,3
0,8
1,2
2,9
6
5
2
1
2
3
2
Not public
Not public
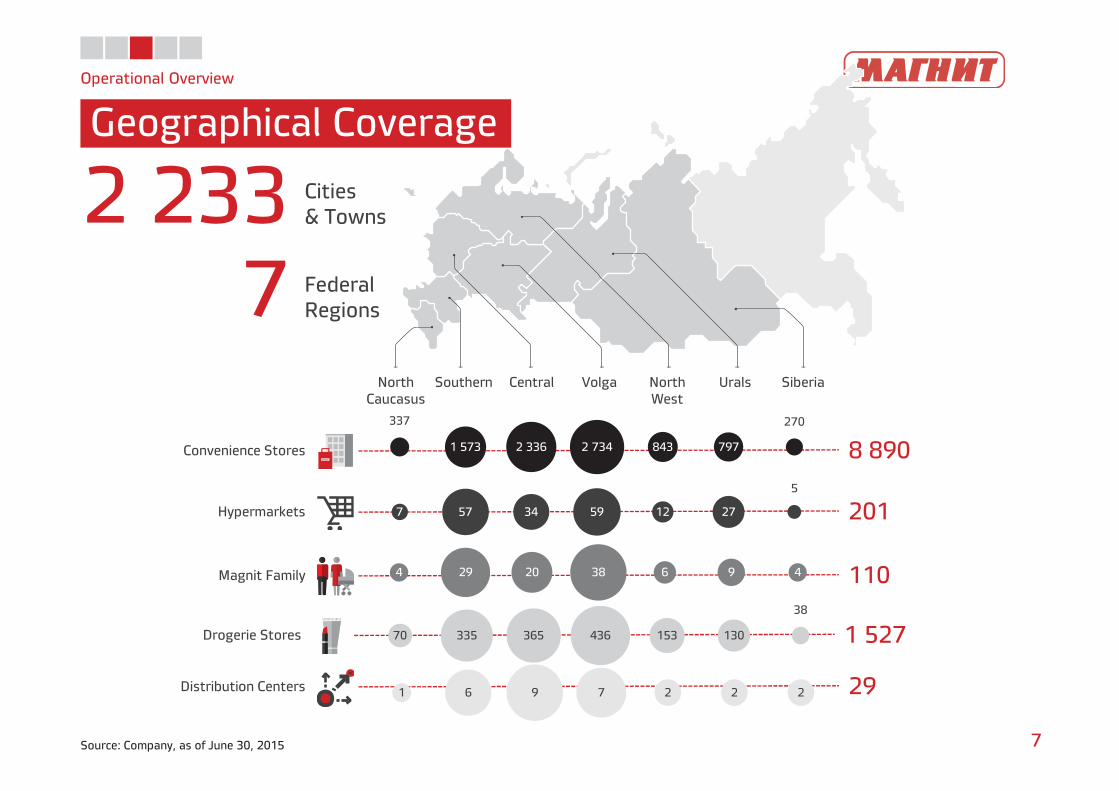
1 527Drogerie Stores 70 335 365 436 153 130
38
8 890Convenience Stores
201Hypermarkets
110Magnit Family
29Distribution Centers
4 29 20 38 6 9 4
7 57 34 59 12 27
5
337
1 573 2 336 2 734 843 797
270
Operational Overview
Geographical Coverage
7Source: Company, as of June 30, 2015
2 233 Cities& Towns
7 FederalRegions
North Caucasus
Southern Volga North West
Urals SiberiaCentral
1 6 9 7 2 2 2
Operational Overview
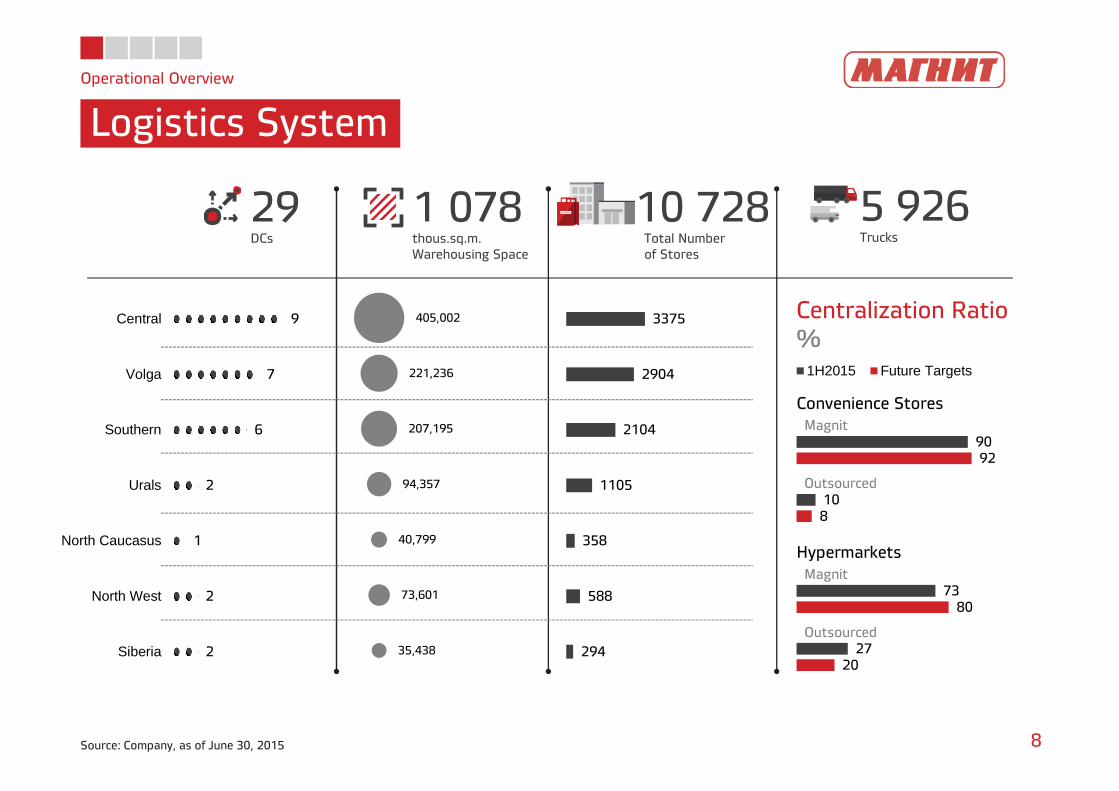
Logistics System
8Source: Company, as of June 30, 2015
10 728Total Numberof Stores
1 078thous.sq.m.Warehousing Space
29DCs
5 926Trucks
9
7
6
2
1
2
2
Central
Volga
Southern
Urals
North Caucasus
North West
Siberia
3375
2904
2104
1105
358
588
294
405,002
221,236
207,195
94,357
40,799
73,601
35,438
Centralization Ratio%
Magnit
Outsourced
90
10
92
8
Convenience Stores
1H2015 Future Targets
Magnit
Outsourced
73
27
80
20
Hypermarkets
Operational Overview
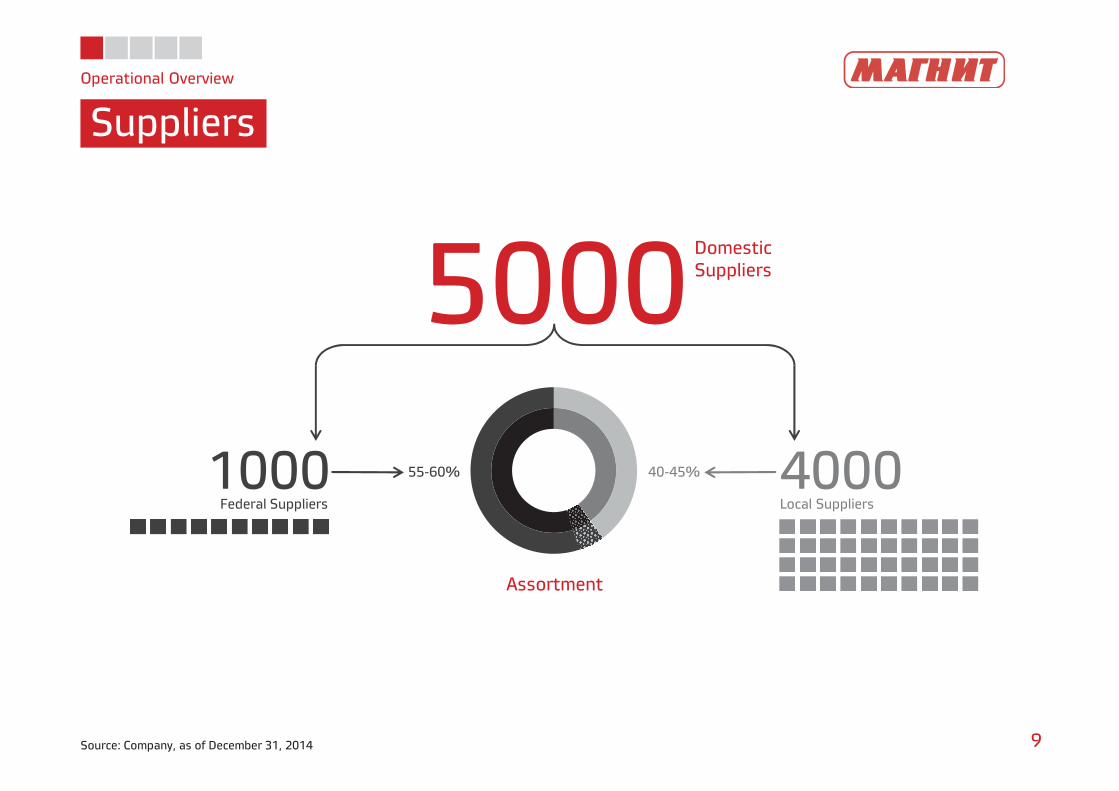
Suppliers
9Source: Company, as of December 31, 2014
5000DomesticSuppliers
4000Local Suppliers
1000Federal Suppliers
Assortment
55-60% 40-45%
Operational Overview
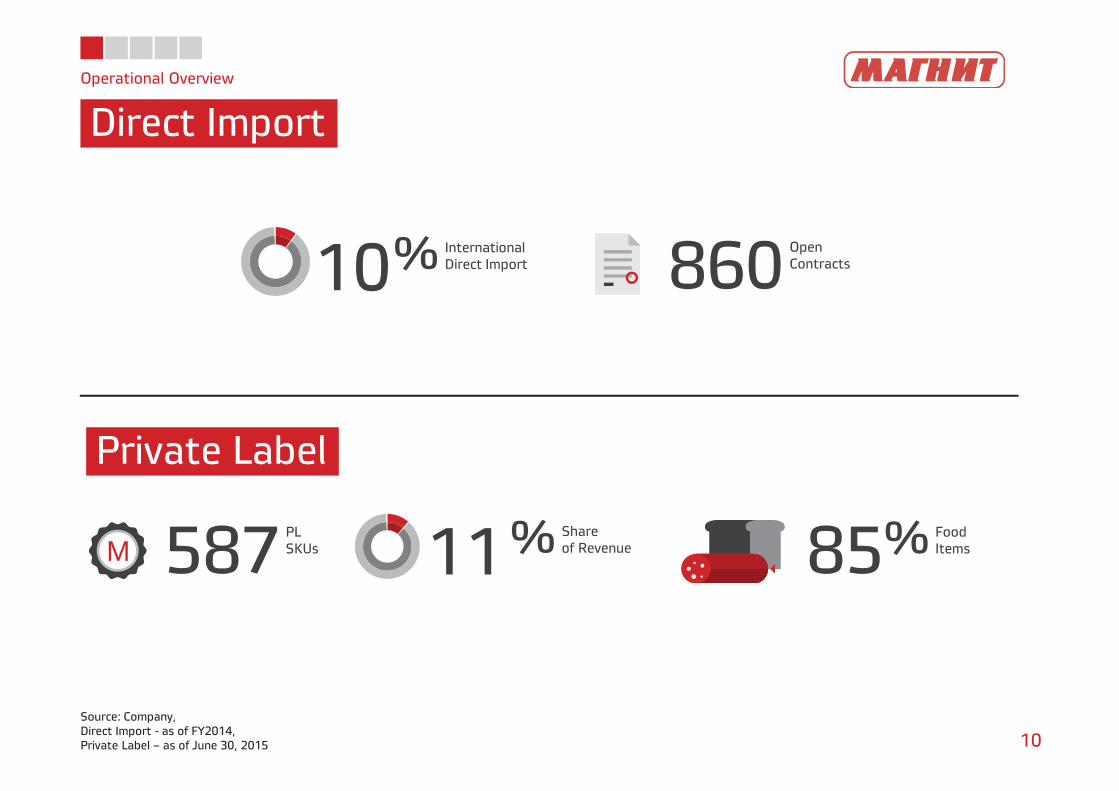
Direct Import
10Source: Company, Direct Import - as of FY2014,Private Label – as of June 30, 2015
11% Shareof Revenue587 PL
SKUsM 85% FoodItems
Private Label
10% InternationalDirect Import 860 Open
Contracts
Operational Overview
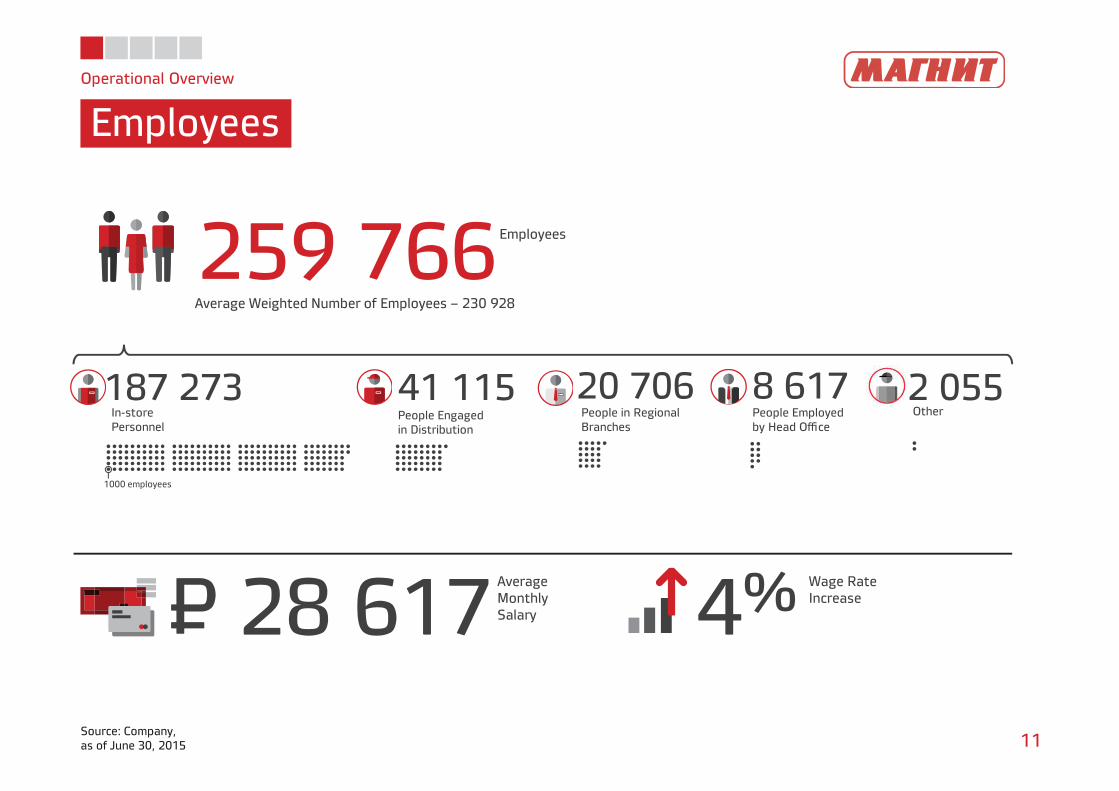
Employees
11Source: Company, as of June 30, 2015
259 766 Employees
28 617AverageMonthlySalary 4% Wage Rate
IncreaseP=
187 273In-storePersonnel
41 115People Engagedin Distribution
20 706People in RegionalBranches
8 617People Employedby Head Office
1000 employees
Average Weighted Number of Employees – 230 928
2 055Other
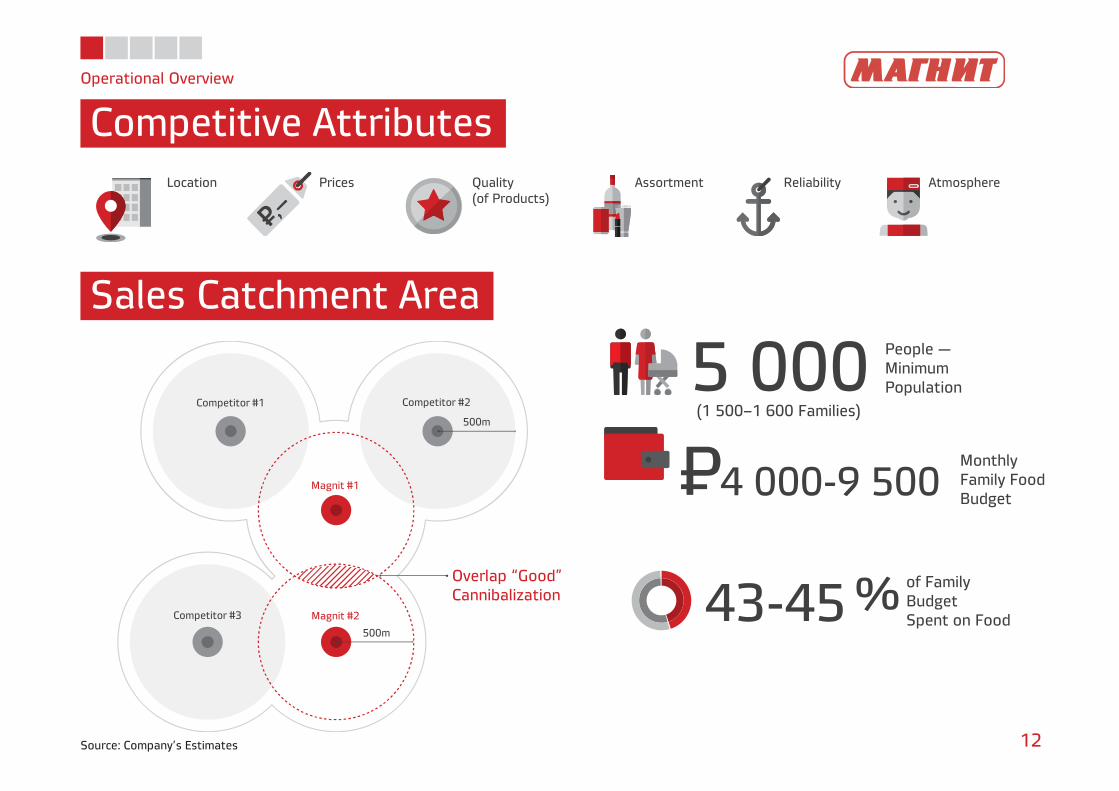
Operational Overview
Competitive Attributes
12
43-45 % of FamilyBudgetSpent on Food
Location Quality(of Products)
Assortment Reliability AtmospherePrices
5 000 People —MinimumPopulation
(1 500–1 600 Families)
4 000-9 500MonthlyFamily FoodBudget
P=Overlap “Good”Cannibalization
Magnit #1
Magnit #2
500m
Competitor #1 Competitor #2
Competitor #3
500m
Sales Catchment Area
Source: Company’s Estimates
Convenience Store
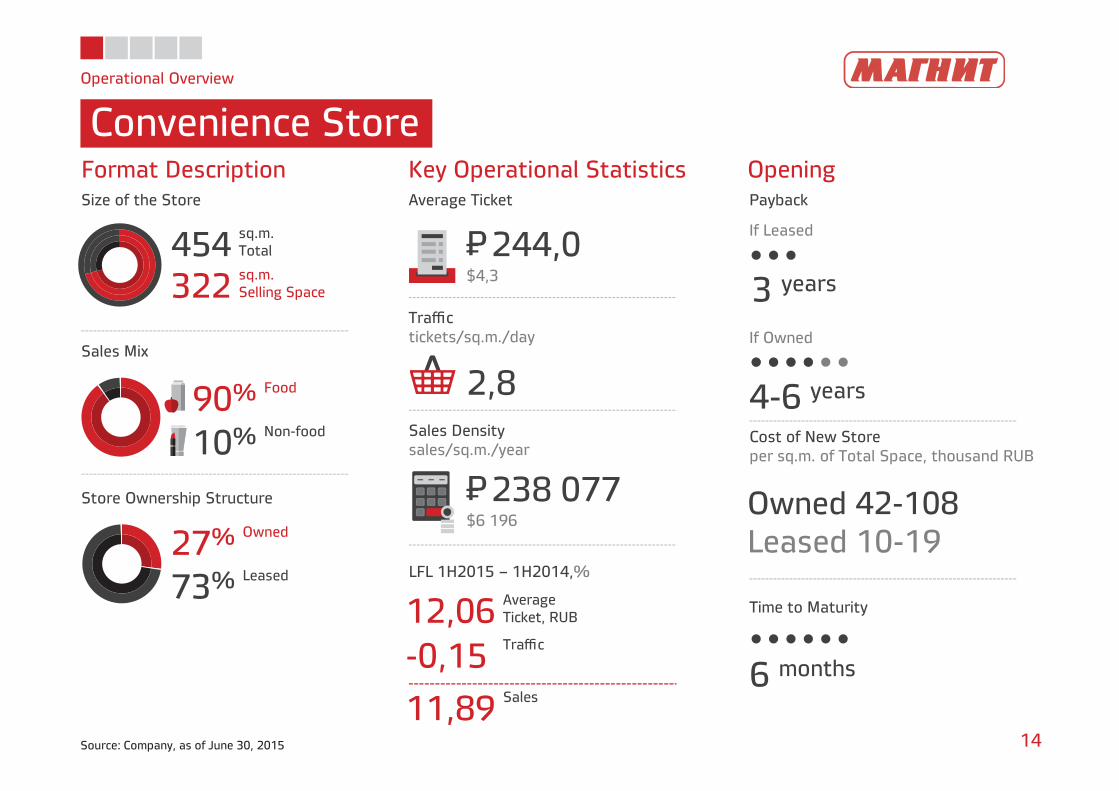
Operational Overview
Convenience Store
14Source: Company, as of June 30, 2015
454 sq.m.Total
322 sq.m.Selling Space
90% Food
10% Non-food
27% Owned
73% Leased
Format Description Key Operational Statistics OpeningSize of the Store Average Ticket Payback
Store Ownership Structure
Sales Mix
Traffictickets/sq.m./day
Sales Densitysales/sq.m./year
LFL 1H2015 – 1H2014,%
244,0P=$4,3
238 077P=$6 196
12,06 AverageTicket, RUB
-0,15 Traffic
11,89 Sales
2,8
3 years
If Leased
If Owned
Cost of New Storeper sq.m. of Total Space, thousand RUB
Time to Maturity
6 months
4-6 years
Owned 42-108Leased 10-19
Hypermarket
Operational Overview
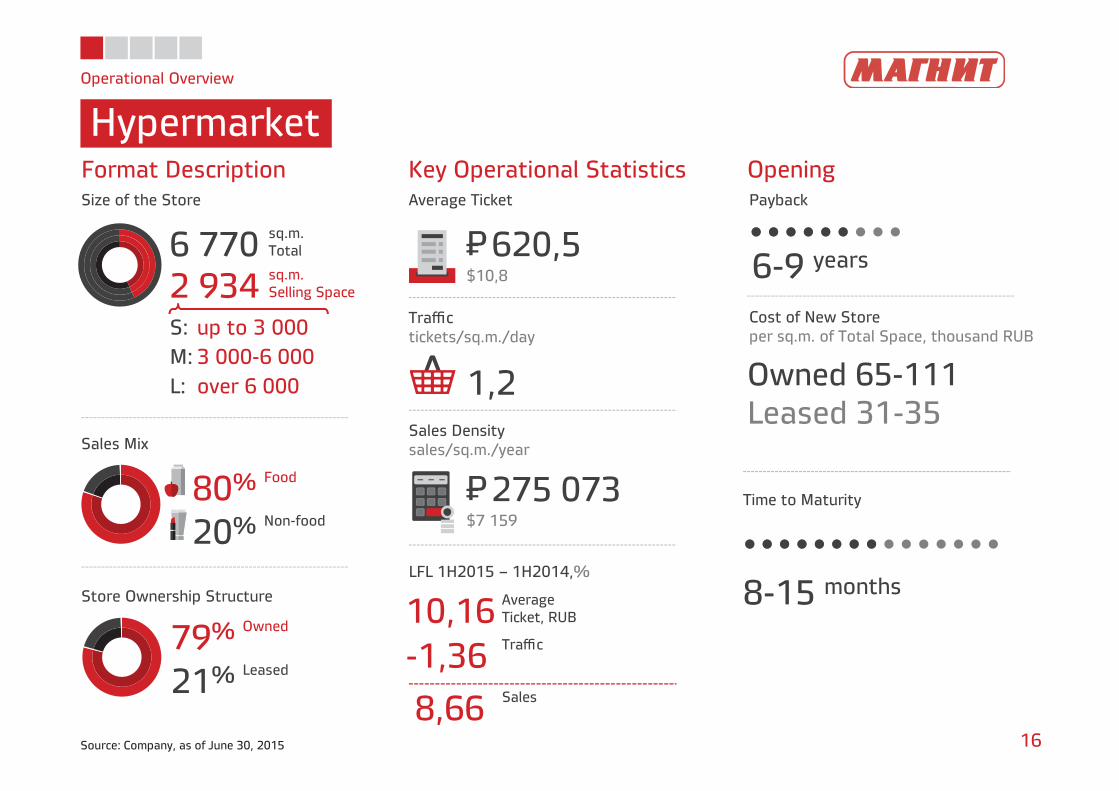
Hypermarket
16Source: Company, as of June 30, 2015
80% Food
20% Non-food
79% Owned
21% Leased
Format Description Key Operational StatisticsSize of the Store Average Ticket
Store Ownership Structure
Sales Mix
Traffictickets/sq.m./day
Sales Densitysales/sq.m./year
LFL 1H2015 – 1H2014,%
620,5P=$10,8
275 073P=$7 159
1,2
6 770 sq.m.Total
2 934 sq.m.Selling Space
10,16 AverageTicket, RUB
-1,36 Traffic
8,66 Sales
OpeningPayback
6-9 years
Cost of New Storeper sq.m. of Total Space, thousand RUB
Owned 65-111Leased 31-35
8-15 months
Time to Maturity
S: up to 3 000M: 3 000-6 000L: over 6 000
Magnit Family
Operational Overview
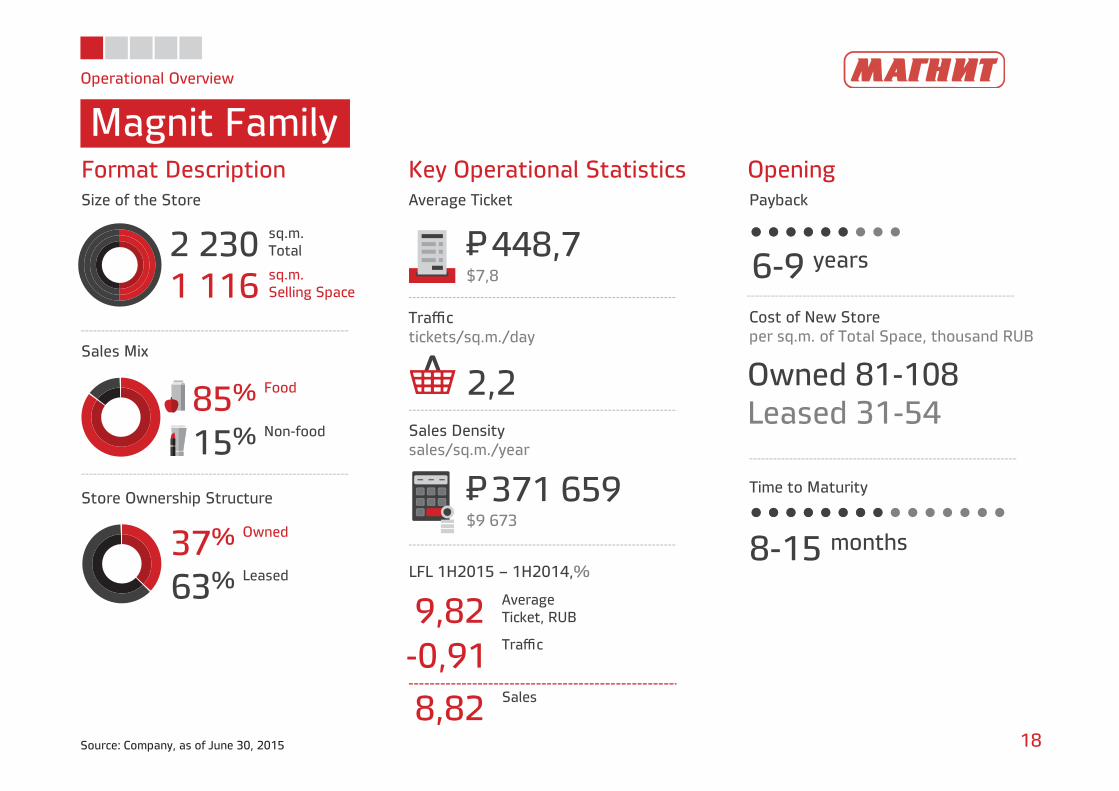
Magnit Family
18Source: Company, as of June 30, 2015
2 230 sq.m.Total
1 116 sq.m.Selling Space
85% Food
15% Non-food
37% Owned
63% Leased
Format Description Key Operational Statistics OpeningSize of the Store Average Ticket Payback
Store Ownership Structure
Sales Mix
Traffictickets/sq.m./day
Sales Densitysales/sq.m./year
LFL 1H2015 – 1H2014,%
448,7P=$7,8
371 659P=$9 673
2,2
6-9 years
Cost of New Storeper sq.m. of Total Space, thousand RUB
Owned 81-108Leased 31-54
8-15 months
9,82 AverageTicket, RUB
-0,91 Traffic
8,82 Sales
Time to Maturity
Drogerie Store
Operational Overview
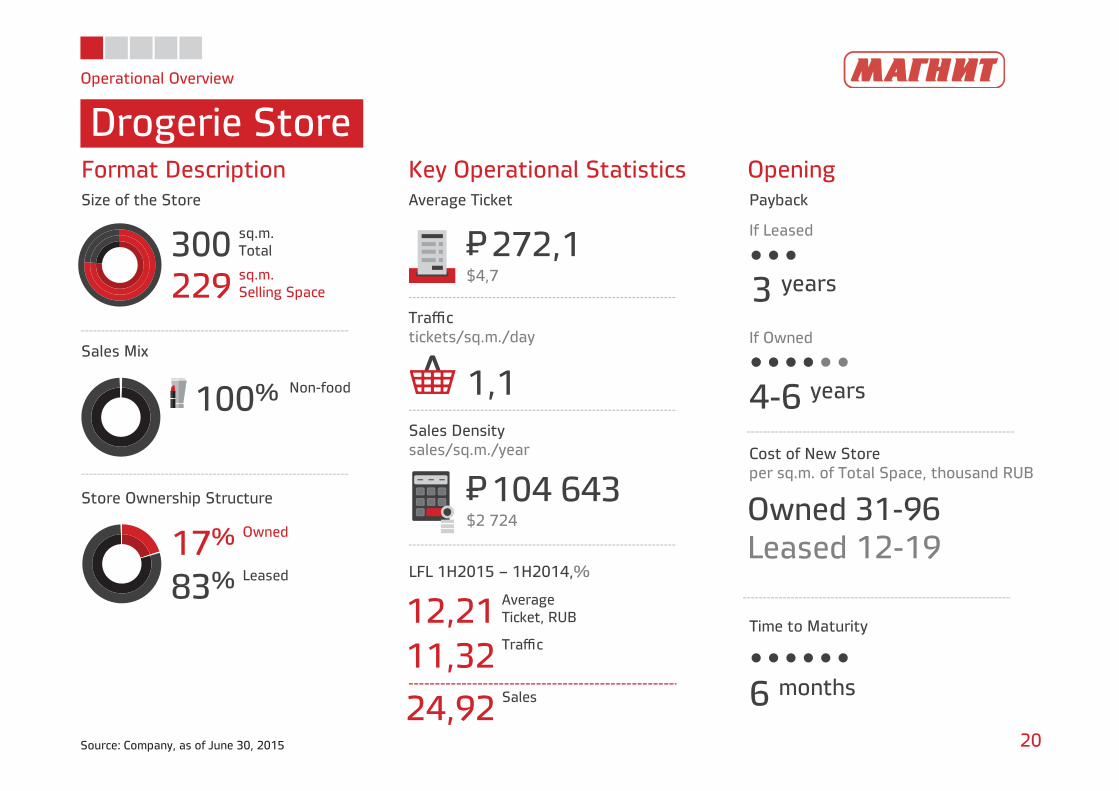
Drogerie Store
20Source: Company, as of June 30, 2015
300 sq.m.Total
229 sq.m.Selling Space
100% Non-food
17% Owned
83% Leased
Format Description Key Operational Statistics OpeningSize of the Store Average Ticket Payback
Store Ownership Structure
Sales Mix
Traffictickets/sq.m./day
Sales Densitysales/sq.m./year
LFL 1H2015 – 1H2014,%
272,1P=$4,7
104 643P=$2 724
12,21 AverageTicket, RUB
11,32 Traffic
24,92 Sales
1,1
3 years
If Leased
If Owned
Cost of New Storeper sq.m. of Total Space, thousand RUB
Time to Maturity
6 months
Owned 31-96Leased 12-19
4-6 years
Sizeof the Store
sq.m.
AverageTicket
TrafficTickets/sq.m./day
DensitySales/
sq.m./year
SalesMix
LFL 1H2015-1H2014
%
Store Owner-ship Structure
PaybackYears
Cost of New Store
per sq.m.of Total Space
Timeto Maturity
Months
• Total• Selling Space
• Food• Non-food
• Av.ticket• Traffic/ Sales
• Owned• Leased
17%
83%
37%63%
79%
21%
27%
73%
Operational Overview
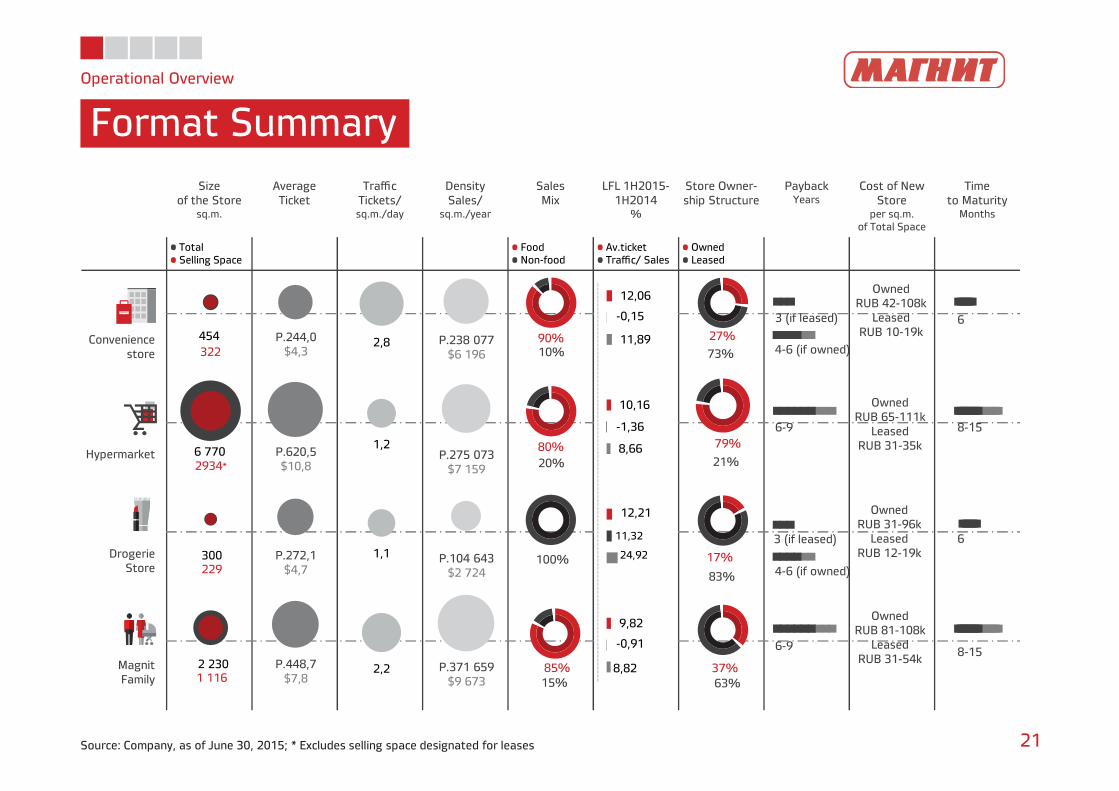
Format Summary
21Source: Company, as of June 30, 2015; * Excludes selling space designated for leases
Hypermarket
DrogerieStore
MagnitFamily
454
6 770
300
2 230
322
2934*
229
1 116
Owned RUB 42-108k
Leased RUB 10-19k
2,8
1,2
1,1
2,2
P.244,0$4,3
P.620,5$10,8
P.272,1$4,7
P.448,7$7,8
P.238 077$6 196
P.275 073$7 159
P.104 643$2 724
P.371 659$9 673
80%20%
100%
85%15%
90%10%
Conveniencestore
6
8-15
6
8-15
3 (if leased)
6-9
3 (if leased)
6-9
4-6 (if owned)
4-6 (if owned)
12,06
10,16
12,21
9,82
-0,15
-1,36
11,32
-0,91
11,89
8,66
24,92
8,82
OwnedRUB 65-111k
LeasedRUB 31-35k
OwnedRUB 31-96k
LeasedRUB 12-19k
OwnedRUB 81-108k
LeasedRUB 31-54k
Financial Overview
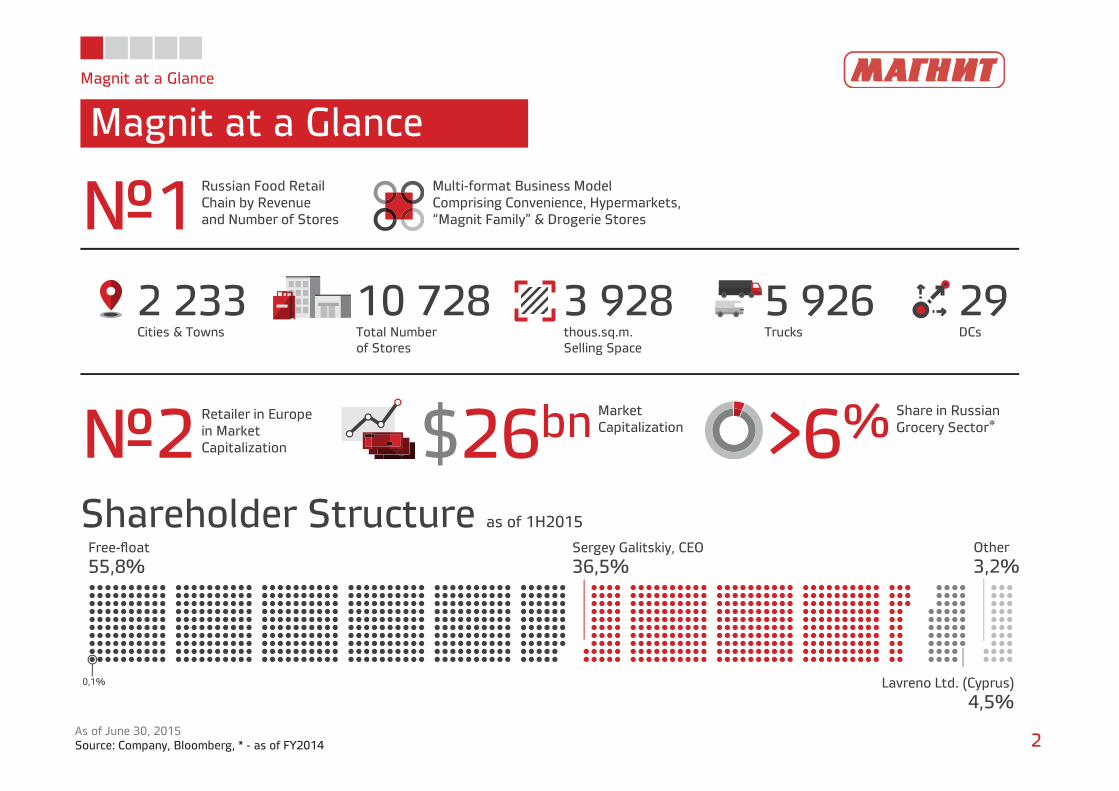
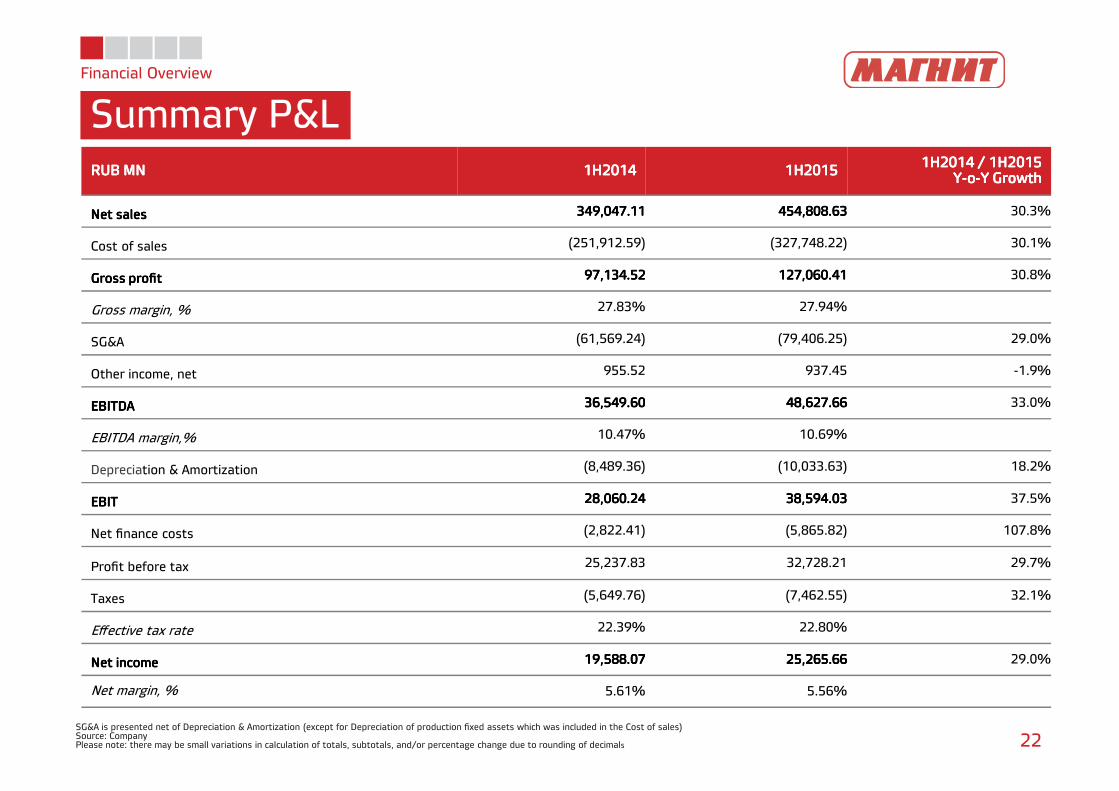
Summary P&L
SG&A is presented net of Depreciation & Amortization (except for Depreciation of production fixed assets which was included in the Cost of sales)Source: CompanyPlease note: there may be small variations in calculation of totals, subtotals, and/or percentage change due to rounding of decimals 22
RUB MNRUB MNRUB MNRUB MN 1H20141H20141H20141H2014 1H20151H20151H20151H2015 1H2014 / 1H20151H2014 / 1H20151H2014 / 1H20151H2014 / 1H2015YYYY----oooo----Y GrowthY GrowthY GrowthY Growth
Net salesNet salesNet salesNet sales 349349349349,,,,047047047047....11 11 11 11 454454454454,,,,808808808808....63 63 63 63 30.3%
Cost of sales (251,912.59) (327,748.22) 30.1%
Gross profitGross profitGross profitGross profit 97979797,,,,134134134134.5.5.5.52 2 2 2 127127127127,,,,060060060060....41 41 41 41 30.8%
Gross margin, % 27.83% 27.94%
SG&A (61,569.24) (79,406.25) 29.0%
Other income, net 955.52 937.45 -1.9%
EBITDAEBITDAEBITDAEBITDA 36363636,,,,549549549549....60 60 60 60 48484848,,,,627627627627....66 66 66 66 33.0%
EBITDA margin,% 10.47% 10.69%
Depreciation & Amortization (8,489.36) (10,033.63) 18.2%
EBITEBITEBITEBIT 28282828,,,,060060060060....22224444 38383838,,,,594594594594....03 03 03 03 37.5%
Net finance costs (2,822.41) (5,865.82) 107.8%
Profit before tax 25,237.83 32,728.21 29.7%
Taxes (5,649.76) (7,462.55) 32.1%
Effective tax rate 22.39% 22.80%
Net incomeNet incomeNet incomeNet income 19191919,,,,588588588588....07 07 07 07 25252525,,,,265265265265....66 66 66 66 29.0%
Net margin, % 5.61% 5.56%
20%
89 404 RUB mn
1520
25
1H2013 1H2014 1H2015
273349
455
1H2013 1H2014 1H2015
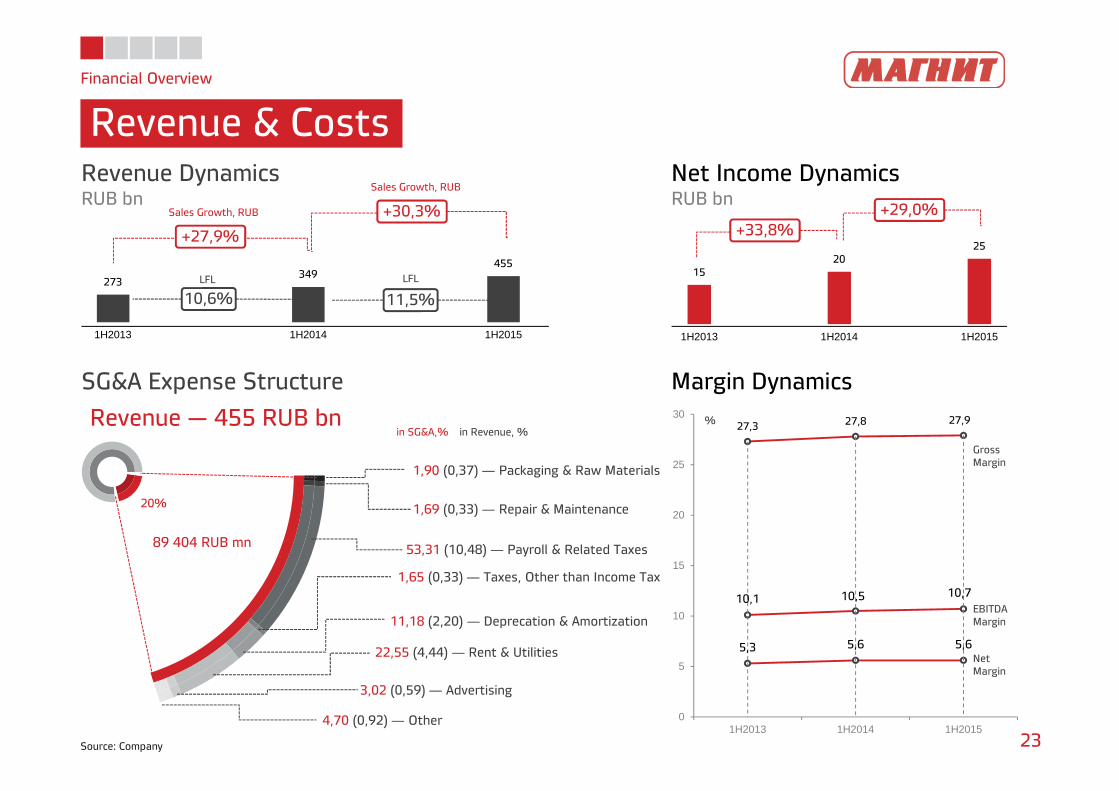
Financial Overview
Revenue & Costs
23Source: Company
27,3 27,8 27,9
10,1 10,5 10,7
5,3 5,6 5,6
0
5
10
15
20
25
30
1H2013 1H2014 1H2015
Revenue DynamicsRUB bn
Net Income DynamicsRUB bn
Margin DynamicsSG&A Expense Structure
Revenue — 455 RUB bnGrossMargin
EBITDAMargin
NetMargin
%
+27,9%
10,6% 11,5%
+30,3%+33,8%
+29,0%
LFLLFL
Sales Growth, RUB
Sales Growth, RUB
1,90 (0,37) ― Packaging & Raw Materials
1,69 (0,33) ― Repair & Maintenance
53,31 (10,48) ― Payroll & Related Taxes
1,65 (0,33)― Taxes, Other than Income Tax
11,18 (2,20) ― Deprecation & Amortization
22,55 (4,44) ― Rent & Utilities
4,70 (0,92) ― Other
in SG&A,% in Revenue, %
3,02 (0,59) ― Advertising
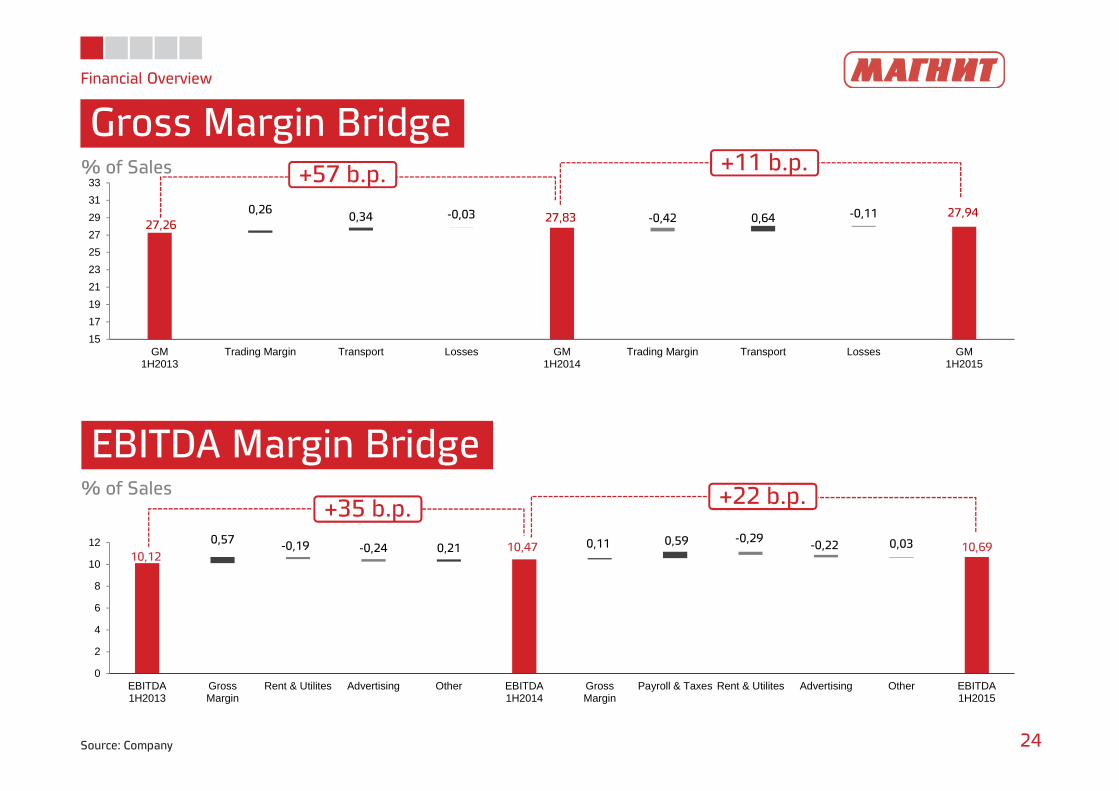
27,2627,83 27,94-0,03 -0,42 -0,110,26
0,34 0,64
15
17
19
21
23
25
27
29
31
33
GM1H2013
Trading Margin Transport Losses GM1H2014
Trading Margin Transport Losses GM1H2015
Financial Overview
Gross Margin Bridge
24Source: Company
EBITDA Margin Bridge
% of Sales
% of Sales
+57 b.p. +11 b.p.
+35 b.p. +22 b.p.
10,1210,47 10,69-0,19 -0,24
-0,29-0,220,57
0,21 0,11 0,59 0,03
0
2
4
6
8
10
12
EBITDA1H2013
GrossMargin
Rent & Utilites Advertising Other EBITDA1H2014
GrossMargin
Payroll & Taxes Rent & Utilites Advertising Other EBITDA1H2015
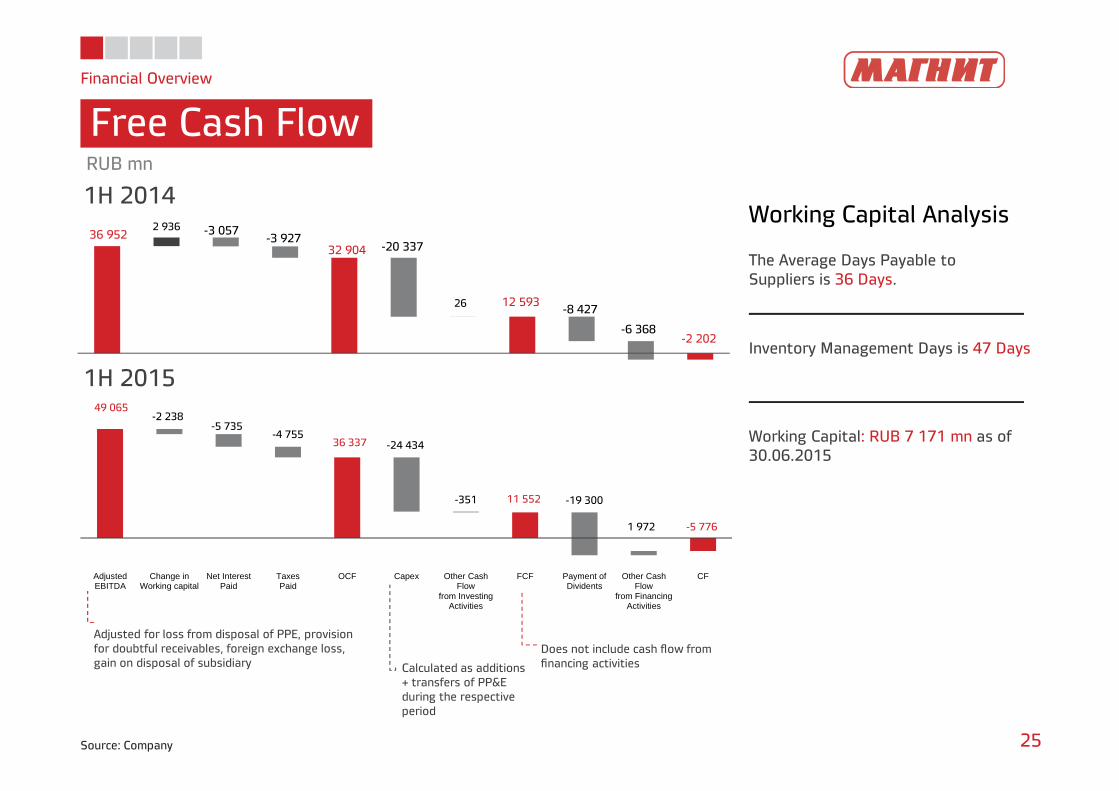
36 95232 904
12 593
-2 202
-3 057-3 927
-20 337
-8 427
-6 368
2 936
26
Financial Overview
Free Cash Flow
25Source: Company
Working Capital Analysis
The Average Days Payable to Suppliers is 36 Days.
Inventory Management Days is 47 Days
Working Capital: RUB 7 171 mn as of 30.06.2015
RUB mn
1H 2014
1H 2015
Adjusted for loss from disposal of PPE, provision for doubtful receivables, foreign exchange loss, gain on disposal of subsidiary Calculated as additions
+ transfers of PP&E during the respective period
Does not include cash flow from financing activities
49 065
36 337
11 552
-5 776
-2 238-5 735
-4 755-24 434
-351 -19 300
1 972
AdjustedEBITDA
Change inWorking capital
Net InterestPaid
TaxesPaid
OCF Capex Other CashFlow
from InvestingActivities
FCF Payment ofDividents
Other CashFlow
from FinancingActivities
CF
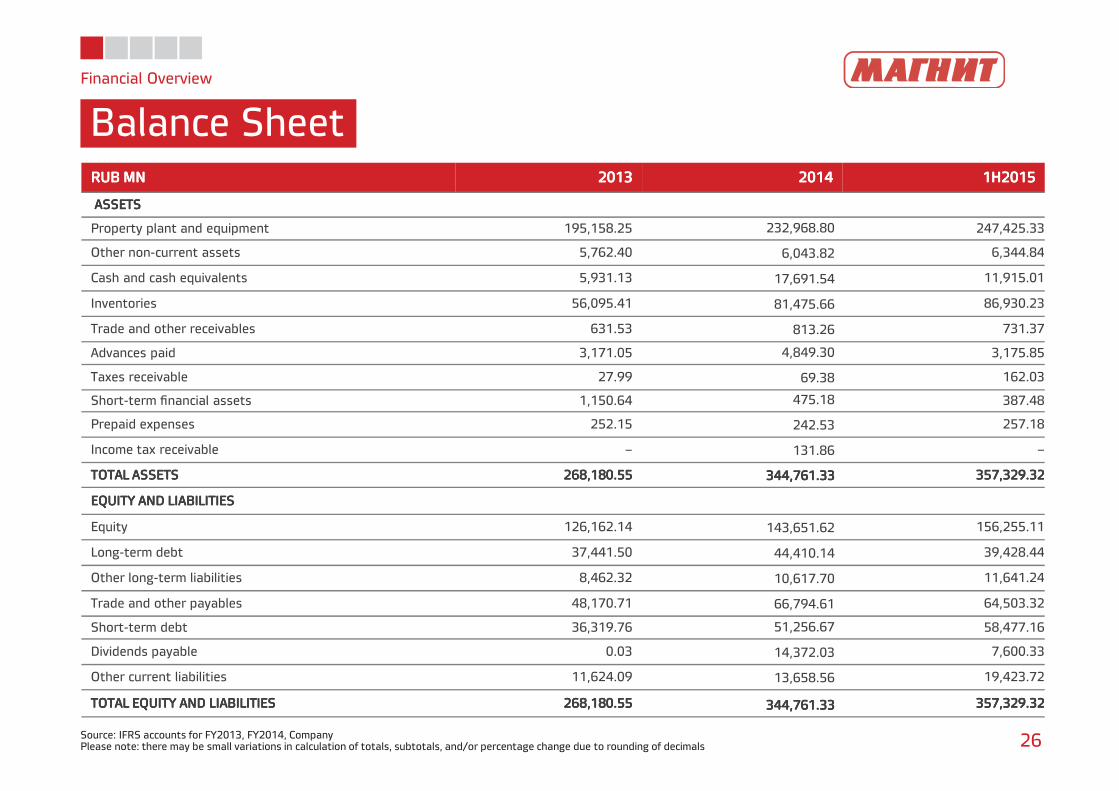
Financial Overview
Balance Sheet
Source: IFRS accounts for FY2013, FY2014, CompanyPlease note: there may be small variations in calculation of totals, subtotals, and/or percentage change due to rounding of decimals 26
RUB MNRUB MNRUB MNRUB MN 2013201320132013 2014201420142014 1H20151H20151H20151H2015
ASSETS ASSETS ASSETS ASSETS
Property plant and equipment 195,158.25 232,968.80 247,425.33
Other non-current assets 5,762.40 6,043.82 6,344.84
Cash and cash equivalents 5,931.13 17,691.54 11,915.01
Inventories 56,095.41 81,475.66 86,930.23
Trade and other receivables 631.53 813.26 731.37
Advances paid 3,171.05 4,849.30 3,175.85
Taxes receivable 27.99 69.38 162.03
Short-term financial assets 1,150.64 475.18 387.48
Prepaid expenses 252.15 242.53 257.18
Income tax receivable – 131.86 –
TOTAL ASSETS TOTAL ASSETS TOTAL ASSETS TOTAL ASSETS 268268268268,,,,180.55180.55180.55180.55 344,761.33344,761.33344,761.33344,761.33 357357357357,,,,329329329329....32 32 32 32
EQUITY AND LIABILITIES EQUITY AND LIABILITIES EQUITY AND LIABILITIES EQUITY AND LIABILITIES
Equity 126,162.14 143,651.62 156,255.11
Long-term debt 37,441.50 44,410.14 39,428.44
Other long-term liabilities 8,462.32 10,617.70 11,641.24
Trade and other payables 48,170.71 66,794.61 64,503.32
Short-term debt 36,319.76 51,256.67 58,477.16
Dividends payable 0.03 14,372.03 7,600.33
Other current liabilities 11,624.09 13,658.56 19,423.72
TOTAL EQUITY AND LIABILITIESTOTAL EQUITY AND LIABILITIESTOTAL EQUITY AND LIABILITIESTOTAL EQUITY AND LIABILITIES 268268268268,,,,180.55180.55180.55180.55 344,761.33344,761.33344,761.33344,761.33 357357357357,,,,329329329329....32 32 32 32
Financial Overview
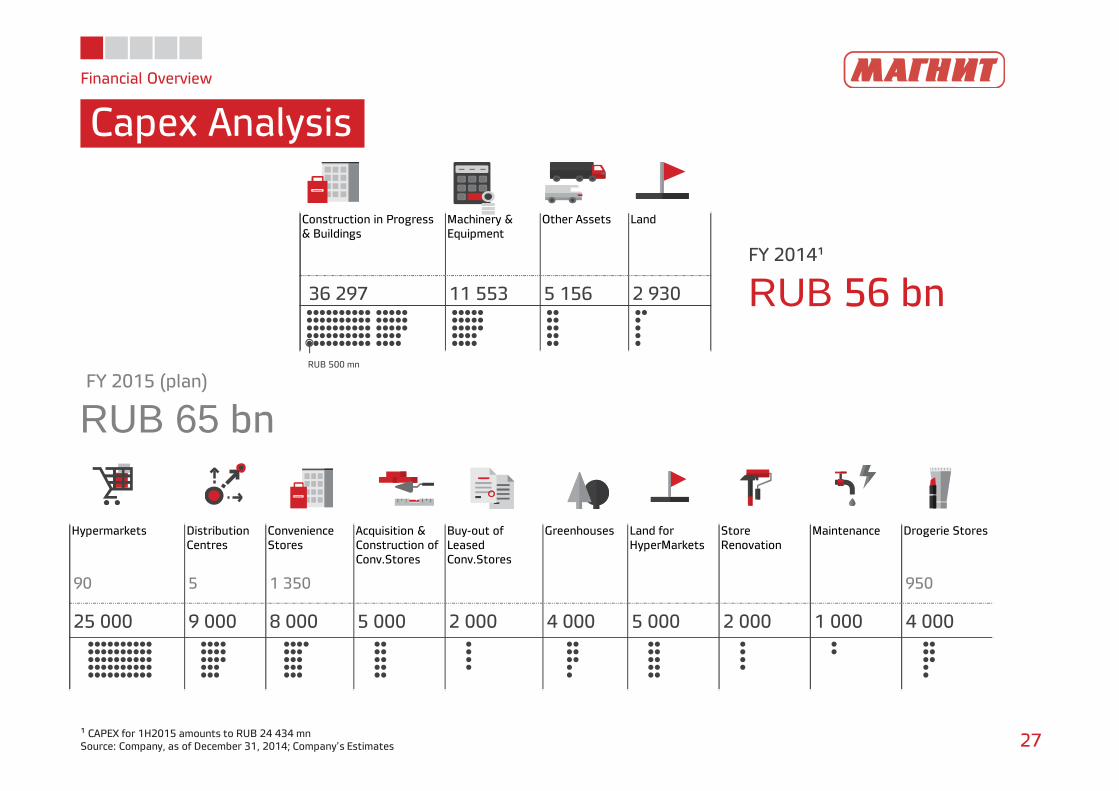
Capex Analysis
27¹ CAPEX for 1H2015 amounts to RUB 24 434 mnSource: Company, as of December 31, 2014; Company’s Estimates
Construction in Progress & Buildings
Machinery & Equipment
Other Assets Land
36 297 11 553 5 156 2 930
FY 2014¹
RUB 56 bn
FY 2015 (plan)
RUB 65 bn
RUB 500 mn
Hypermarkets Distribution Centres
Convenience Stores
Acquisition & Construction of Conv.Stores
Buy-out of Leased Conv.Stores
Greenhouses Land for HyperMarkets
Store Renovation
Maintenance Drogerie Stores
90 5 1 350 950
25 000 9 000 8 000 5 000 2 000 4 000 5 000 2 000 1 000 4 000
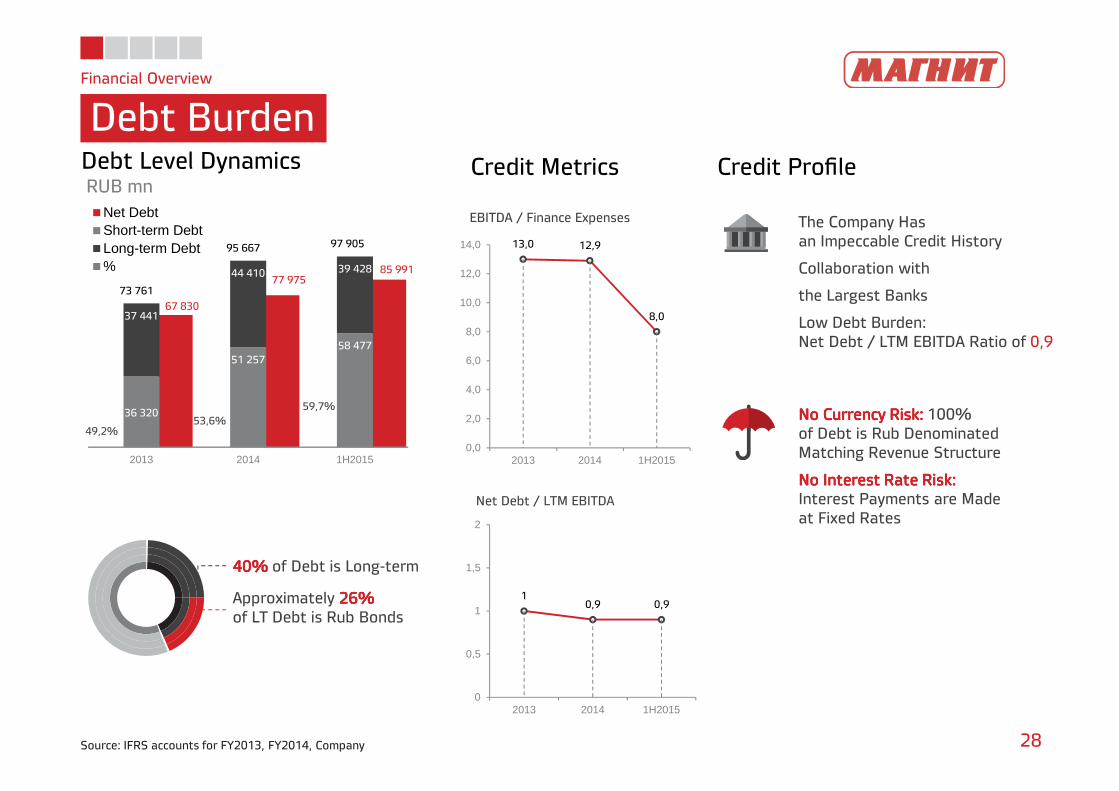
73 761
95 667 97 905
67 830
77 97585 991
36 320
51 25758 477
37 441
44 410 39 428
2013 2014 1H2015
Net DebtShort-term DebtLong-term Debt%
Financial Overview
Debt Burden
28Source: IFRS accounts for FY2013, FY2014, Company
13,0 12,9
8,0
0,0
2,0
4,0
6,0
8,0
10,0
12,0
14,0
2013 2014 1H2015
10,9 0,9
0
0,5
1
1,5
2
2013 2014 1H2015
Debt Level DynamicsRUB mn
Credit Metrics Credit Profile
EBITDA / Finance Expenses
Net Debt / LTM EBITDA
The Company Hasan Impeccable Credit History
Collaboration with
the Largest Banks
Low Debt Burden:Net Debt / LTM EBITDA Ratio of 0,9
No Currency Risk: No Currency Risk: No Currency Risk: No Currency Risk: 100%of Debt is Rub DenominatedMatching Revenue Structure
No Interest Rate Risk:No Interest Rate Risk:No Interest Rate Risk:No Interest Rate Risk:Interest Payments are Madeat Fixed Rates
49,2%53,6%
59,7%
40% 40% 40% 40% of Debt is Long-term
Approximately 26%26%26%26%of LT Debt is Rub Bonds
Contact Information
Contact Information
29
Timothy PostHead of Investor Relations
+7 (961) [email protected]://ir.magnit.com
15/2 Solnechnaya StreetKrasnodar, 350072Russian Federation