Embed Size (px)
Citation preview

together, creating sustainable value
BANK OF AMERICA MERRILL LYNCH
GLOBAL METALS, MINING & STEEL CONFERENCE
May 10, 2016

2
TOGETHER, CREATING SUSTAINABLE VALUE | MAY 2016
This presentation contains “forward-looking statements”, within the meaning of Section 27A of the United States Securities Act of 1933, as amended, Section 21E of the United States Exchange Act of 1934, as
amended, or the United States Private Securities Litigation Reform Act of 1995 and “forward-looking information” under the provisions of applicable Canadian securities legislation, concerning the business,
operations and financial performance and condition of Goldcorp. Forward-looking statements include, but are not limited to, statements with respect to the future price of gold, silver, copper, lead and zinc, the
estimation of Mineral Reserves (as defined in slide 28) and Mineral Resources (as defined in slide 28) the realization of Mineral Reserve estimates, the timing and amount of estimated future production, costs of
production, targeted cost reductions, capital expenditures, free cash flow, costs and timing of the development of new deposits, success of exploration activities, permitting time lines, hedging practices, currency
exchange rate fluctuations, requirements for additional capital, government regulation of mining operations, environmental risks, unanticipated reclamation expenses, timing and possible outcome of pending
litigation, title disputes or claims and limitations on insurance coverage. Generally, these forward-looking statements can be identified by the use of words such as “plans”, “expects”, “is expected”, “budget”,
“scheduled”, “estimates”, “forecasts”, “intends”, “anticipates”, “believes” or variations of such words and phrases or statements that certain actions, events or results “may”, “could”, “would”, “might” or “will”, “occur”
or “be achieved” or the negative connotation thereof.
Forward-looking statements are necessarily based upon a number of factors that, if untrue, could cause the actual results, performances or achievements of Goldcorp to be materially different from future results,
performances or achievements expressed or implied by such statements. Such statements and information are based on numerous assumptions regarding present and future business strategies and the
environment in which Goldcorp will operate in the future, including the price of gold and other by-product metals, anticipated costs and ability to achieve goals. Certain important factors that could cause actual
results, performances or achievements to differ materially from those in the forward-looking statements include, among others, gold and other by-product metals price volatility, discrepancies between actual and
estimated production, mineral reserves and mineral resources and metallurgical recoveries, mining operational and development risks, litigation risks, regulatory restrictions (including environmental regulatory
restrictions and liability), changes in national and local government legislation, taxation, controls or regulations and/or change in the administration of laws, policies and practices, expropriation or nationalization of
property and political or economic developments in Canada, the United States and other jurisdictions in which the Company does or may carry on business in the future, delays, suspension and technical
challenges associated with capital projects, higher prices for fuel, steel, power, labour and other consumables, currency fluctuations, the speculative nature of gold exploration, the global economic climate,
dilution, share price volatility, competition, loss of key employees, additional funding requirements and defective title to mineral claims or property. Although Goldcorp believes its expectations are based upon
reasonable assumptions and has attempted to identify important factors that could cause actual actions, events or results to differ materially from those described in forward-looking statements, there may be other
factors that cause actions, events or results not to be as anticipated, estimated or intended.
Forward-looking statements are subject to known and unknown risks, uncertainties and other important factors that may cause the actual results, level of activity, performance or achievements of Goldcorp to be
materially different from those expressed or implied by such forward-looking statements, including but not limited to: risks related to international operations including economic and political instability in foreign
jurisdictions in which Goldcorp operates; risks related to current global financial conditions; risks related to joint venture operations; actual results of current exploration activities; actual results of current
reclamation activities; environmental risks; conclusions of economic evaluations; changes in project parameters as plans continue to be refined; future prices of gold and other by-product metals; possible
variations in ore reserves, grade or recovery rates; failure of plant, equipment or processes to operate as anticipated; risks related to the integration of acquisitions; accidents, labour disputes; delays in obtaining
governmental approvals or financing or in the completion of development or construction activities and other risks of the mining industry, as well as those factors discussed in the section entitled “Description of the
Business – Risk Factors” in Goldcorp’s most recent annual information form available on SEDAR at www.sedar.com and on EDGAR at www.sec.gov. Although Goldcorp has attempted to identify important factors
that could cause actual results to differ materially from those contained in forward-looking statements, there may be other factors that cause results not to be as anticipated, estimated or intended. There can be no
assurance that such statements will prove to be accurate, as actual results and future events could differ materially from those anticipated in such statements. Accordingly, readers should not place undue reliance
on forward-looking statements. Forward-looking statements are made as of the date hereof and, accordingly, are subject to change after such date. Except as otherwise indicated by Goldcorp, these statements do
not reflect the potential impact of any non-recurring or other special items or of any dispositions, monetizations, mergers, acquisitions, other business combinations or other transactions that may be announced or
that may occur after the date hereof. Forward-looking statements are provided for the purpose of providing information about management’s current expectations and plans and allowing investors and others to get
a better understanding of the Company’s operating environment. Goldcorp does not intend or undertake to publicly update any forward-looking statements that are included in this document, whether as a result of
new information, future events or otherwise, except in accordance with applicable securities laws.
Forward-Looking Statements
3
TOGETHER, CREATING SUSTAINABLE VALUE | MAY 2016
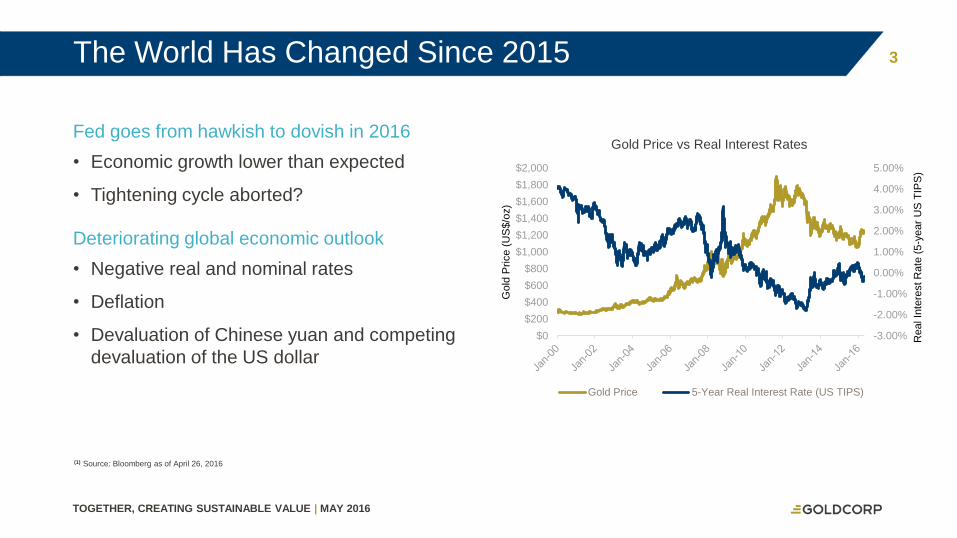
Fed goes from hawkish to dovish in 2016
• Economic growth lower than expected
• Tightening cycle aborted?
Deteriorating global economic outlook
• Negative real and nominal rates
• Deflation
• Devaluation of Chinese yuan and competing
devaluation of the US dollar
(1) Source: Bloomberg as of April 26, 2016
The World Has Changed Since 2015
-3.00%
-2.00%
-1.00%
0.00%
1.00%
2.00%
3.00%
4.00%
5.00%
$0
$200
$400
$600
$800
$1,000
$1,200
$1,400
$1,600
$1,800
$2,000
Real In
tere
st R
ate
(5
-year
US
TIP
S)
Gold
Price (
US
$/o
z)
Gold Price vs Real Interest Rates
Gold Price 5-Year Real Interest Rate (US TIPS)

4
TOGETHER, CREATING SUSTAINABLE VALUE | MAY 2016
20
22
24
26
28
30
32
2015A 2016E 2017E 2018E
Mill
ion o
unces
Gold Reserves(1) Declined Over Past Three Years
(1) Includes: Goldcorp, Barrick, Newmont, Newcrest, Agnico Eagle, Kinross, Yamana, AngloGold, Goldfields and Harmony
Source: Company reports(2) 2017–2018 production for AngloGold, Kinross, Newcrest, Goldfields and Harmony is assumed flat from 2016E for 2017E and 2018E
Production(1)(2) Set to Decline
8%
Large Cap Gold Reserves and Production Falling Quickly
420
440
460
480
500
520
540
560
2013A 2014A 2015A
Reserv
es (
mill
ion o
unces)
15%

5
TOGETHER, CREATING SUSTAINABLE VALUE | MAY 2016
Peak
Discovery(1)
Peak
Production(2)
3-y
ear
runnin
g a
vg
Au d
iscovere
d (
moz)
Gra
ssro
ots
+ 7
5%
of
late
-sta
ge e
xplo
ration b
udgets
(U
S$M
)
(1) Source: SNL Metals Economics Group(2) Source: Consensus estimates. Includes CPM Group, GFMS, and Metals Focus
Annual pro
duction (
moz)
Supportive Supply Picture
Global mine supply peaked in 2015
as exploration has not borne fruit
70
75
80
85
90
95
100
2003 2006 2009 2012 2015 2018 2021 2024
$0
$1,200
$2,400
$3,600
$4,800
$6,000
$7,200
0
25
50
75
100
125
150
1990 1993 1996 1999 2002 2005 2008 2011

6
TOGETHER, CREATING SUSTAINABLE VALUE | MAY 2016
666
• Net asset value (NAV) per share growth
key business driver
• Organic growth and brownfield exploration
Goldcorp Value Creation Principles
7
TOGETHER, CREATING SUSTAINABLE VALUE | MAY 2016
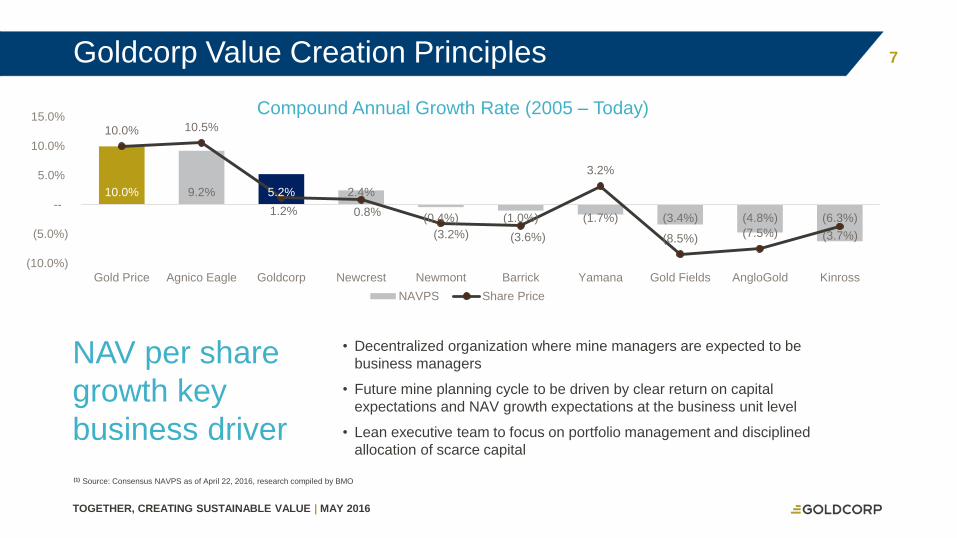
NAV per share
growth key
business driver
• Decentralized organization where mine managers are expected to be
business managers
• Future mine planning cycle to be driven by clear return on capital
expectations and NAV growth expectations at the business unit level
• Lean executive team to focus on portfolio management and disciplined
allocation of scarce capital
(1) Source: Consensus NAVPS as of April 22, 2016, research compiled by BMO
Goldcorp Value Creation Principles
10.0% 9.2% 5.2% 2.4%
(0.4%) (1.0%) (1.7%) (3.4%) (4.8%) (6.3%)
10.0% 10.5%
1.2% 0.8%
(3.2%) (3.6%)
3.2%
(8.5%) (7.5%) (3.7%)
(10.0%)
(5.0%)
--
5.0%
10.0%
15.0%
Gold Price Agnico Eagle Goldcorp Newcrest Newmont Barrick Yamana Gold Fields AngloGold Kinross
Compound Annual Growth Rate (2005 – Today)
NAVPS Share Price

8
TOGETHER, CREATING SUSTAINABLE VALUE | MAY 2016
Organic Growth and Brownfield Exploration
• Lowest-risk, highest-rate-of-returns proposition comes from leveraging existing teams and infrastructure
• Brownfield exploration generates the fastest and cheapest reserve growth
• Grass roots exploration is high risk and often destroys capital partnerships with explorers critical to risk diversification
Goldcorp Value Creation Principles
2016
Q1 Q2 Q3 Q4
2017
Q1 Q2 Q3 Q4
Porcupine – Hoyle Deep
Peñasquito – Pyrite Leach Project
Musselwhite – Materials Handling Project
Red Lake – HG Young
Red Lake – Cochenour
Peñasquito – Camino Rojo Oxide Project
Porcupine – Borden
Project Corridor
Execution
Feasibility study
Feasibility study
Concept study
Pre-feasibility study
Pre-feasibility study
Advanced exploration
Trade-off studies Pre-feasibility study
Completed project

9
TOGETHER, CREATING SUSTAINABLE VALUE | MAY 2016
99
Ability to
internally
finance
organic growth
opportunities
0.0
0.5
1.0
1.5
2.0
2.5
3.0
2016E-2018E
Mill
ion o
unces
Gold Production(1) Free Cash Flow(1,2)
Organic
growth
+$288M per
$100/oz
increase in
gold price
0
200
400
2016E
$ M
illio
n ~$400M
Liquidity of $3.2 Billion Expected to Grow in 2016
(1) See Appendix E for footnotes(2) FCF estimate calculated using a current spot price ($1,235/oz Au) plus midpoint of 2016 gold production and AISC guidance and is before dividends
2016E-2018E

10
TOGETHER, CREATING SUSTAINABLE VALUE | MAY 2016
10Targeting $250 Million in Annual Sustainable Efficiencies 10
(1) Desjardins research report, April 29, 2016
Potential to add ~$2B in NAV
Tangible Progress Achieved
• Energy-efficiency programs
• Supply chain efficiencies
• Water management
• Brownfield expansions
• Workforce reductions
(1)

11
TOGETHER, CREATING SUSTAINABLE VALUE | MAY 2016
Outstanding portfolio anchored
by long-life, low-cost mines in
five large mining camps
2016E GOLD
PRODUCTION
BY COUNTRY(1)
25% Mexico
14%
Dominican
Republic
20%
Argentina
5% Guatemala
37%
Canada
Operating mines
Development projects
(1) Based on attributable gold production as per February 25, 2016 press release. For mine-by-mine guidance, refer to Appendix B
Low Political Risk Jurisdictions

12
TOGETHER, CREATING SUSTAINABLE VALUE | MAY 2016
Click to edit Master title style 1212Cerro Negro Camp
Ownership 100%
Location Santa Cruz, Argentina
2016E production 475,000–525,000oz
2016E daily mill throughput 3,500tpd
P&P gold reserves1 4.66moz
M&I gold resources1 1.28moz
Inferred gold resources1 0.5moz
Current mine life 11 years
2016E exploration budget $16M
(1) Refer to Appendix F for further information on the reserves and resources
Core asset with low costs and strong production
• Successful ramp-up
• Optimizing infrastructure and G&A costs
Under-explored
• Opportunity to explore aggressively following improved
political environment
• Vein extensions and new targets support strong potential to
grow reserves
Opportunity to drive efficiencies across the site
• Challenges with inflexible workforce practices
• Stockpile depleted; focus on underground development

13
TOGETHER, CREATING SUSTAINABLE VALUE | MAY 2016
Click to edit Master title style 13
Exceptional asset
• Long underground mine life
• Innovative technology
• Plant ramp-up progressing to design of 7,000tpd, potential
upside
Mine optimization underway
• Dilution upside
• Folding and faulting accounted for; adjusting stope design
Significant new infrastructure in world-class region
• First mover advantage
• New camp with decades-long potential
13Éléonore Camp
Ownership 100%
Location Québec, Canada
2016E production 250,000–280,000oz
2016E daily mill throughput 4,900tpd
P&P gold reserves1 5.35moz
M&I gold resources1 0.81moz
Inferred gold resources1 2.28moz
Current mine life 12 years
2016E exploration budget $5M(1) Refer to Appendix F for further information on the reserves and resources

14
TOGETHER, CREATING SUSTAINABLE VALUE | MAY 2016
Click to edit Master title style 1414Peñasquito Camp
Ownership 100%
Location Zacatecas, Mexico
2016E production 520,000–580,000oz
2016E daily mill throughput 117,000tpd
P&P gold reserves1 10.17moz
M&I gold resources1 2.46moz
Inferred gold resources1 0.2moz
Current mine life 12 years
2016E exploration budget $5M
Core asset with organic growth potential
• Exiting high-grade portion of pit, upside in 2019
Pyrite Leach plant
• Potential to recover gold now going to tailings
• Investment decision mid-2016
Camino Rojo
• Pre-feasibility study on the oxides expected in the fourth
quarter 2016
Northern Well Field project
• Construction resumed, completion expected late 2016
(1) Refer to Appendix F for further information on the reserves and resources

15
TOGETHER, CREATING SUSTAINABLE VALUE | MAY 2016
Click to edit Master title style 15
Potential for infrastructure rationalization and
camp synergies
• Large, spread-out operation
• Five shafts and two mills
HG Young deposit
• Initial high-grade resource(1)
• Potential to sequence following depletion of High Grade Zone
Cochenour – an advanced exploration project
• More complicated than anticipated
• Requires additional drilling, drifting and
geological interpretation
15Red Lake Camp
Ownership 100%
Location Ontario, Canada
2016E Production 300,000–330,000oz
2016E daily mill throughput 1,900tpd
P&P gold reserves2 2.08moz
M&I gold resources2 2.27moz
Inferred gold resources2 2.20moz
Current mine life 5 years
2016E exploration budget $45M
(1) HG Young deposit indicated mineral resource is 205,000 tonnes grading 19.08g/t and the inferred mineral resource is 787,000 grading 20.44g/t(2) Refer to Appendix F for further information on the reserves and resources

16
TOGETHER, CREATING SUSTAINABLE VALUE | MAY 2016
Click to edit Master title style 1616Porcupine Camp
Ownership 100%
Location Ontario, Canada
2016E production 250,000–275,000oz
2016E daily mill throughput 7,900tpd
P&P gold reserves1 2.13moz
M&I gold resources1 4.59moz
Inferred gold resources1 1.64moz
Current mine life 12 years
2016E exploration budget $11M(1) Refer to Appendix F for further information on the reserves and resources
Declining production focusing on margins
• Depleting low-grade stockpile and closure of Dome
underground in mid-2016
Asset optimization to maximize NAV
• Hoyle Pond winze completed; will drive efficiency and
productivity improvements
• Trade-off studies underway to optimize excess processing
capacity
Borden project
• Maiden reserve of 860,000 ounces
• Expected to enhance long-term economics of Porcupine
New neighbours
• Potential to maximize value of camp

17
TOGETHER, CREATING SUSTAINABLE VALUE | MAY 2016
Click to edit Master title style 1717Pueblo Viejo
Ownership 40%
Location Dominican Republic
2016E production 400,000–440,000oz
2016E daily mill throughput 24,000tpd
P&P gold reserves1 5.97moz
M&I gold resources1 5.15moz
Inferred gold resources1 0.10moz
Current mine life 18 years
2016E exploration budget $0.2M(1) Refer to Appendix F for further information on the reserves and resources
Optimization efforts
• Improving efficiency and throughput ore blending
• Increasing autoclave availability
• Maintenance activities
Energy opportunities
• Quisqueya power station provides secure low-cost
energy supply
• Option to add significant value by leveraging existing assets

18
TOGETHER, CREATING SUSTAINABLE VALUE | MAY 2016
Click to edit Master title style 18
Further efficiency and productivity potential
• Continued low all-in sustaining costs
Exploration potential
• West Limb; six mineralized horizons established
Materials Handling project
• Feasibility study underway; completion expected mid-2016
• Expected to reduce costs, extend mine life and increase
annual production
18Musselwhite
Ownership 100%
Location Ontario, Canada
2016E production 240,000–260,000oz
2016E daily mill throughput 3,300tpd
P&P gold reserves1 1.72moz
M&I gold resources1 0.35moz
Inferred gold resources1 1.11moz
Current mine life 7 years
2016E exploration budget $9M
(1) Refer to Appendix F for further information on the reserves and resources

19
TOGETHER, CREATING SUSTAINABLE VALUE | MAY 2016
19Goldcorp Advantage
Delivering Shareholder Value
• Focus on growing NAV per share
• Decentralization and optimization targeted
to deliver $250 million in sustainable annual
efficiencies by 2018
• Reinvest free cash flow into robust internal
pipeline of projects, deleverage and pay
sustainable dividend
• Leverage exploration dollars with small
seed capital investments in junior
companies
20
TOGETHER, CREATING SUSTAINABLE VALUE | MAY 2016
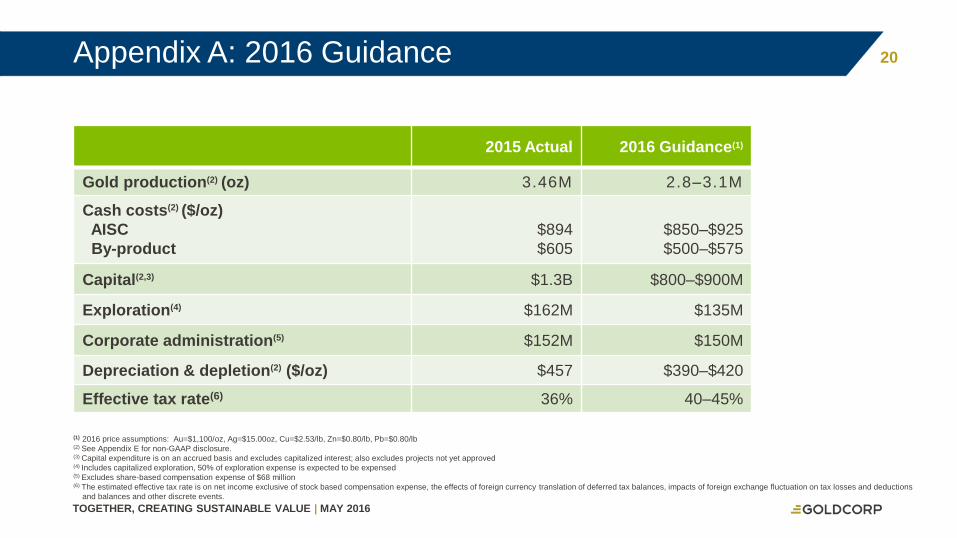
2015 Actual 2016 Guidance(1)
Gold production(2) (oz) 3.46M 2.8–3.1M
Cash costs(2) ($/oz)
AISC
By-product
$894
$605
$850–$925
$500–$575
Capital(2,3) $1.3B $800–$900M
Exploration(4) $162M $135M
Corporate administration(5) $152M $150M
Depreciation & depletion(2) ($/oz) $457 $390–$420
Effective tax rate(6) 36% 40–45%
(1) 2016 price assumptions: Au=$1,100/oz, Ag=$15.00oz, Cu=$2.53/lb, Zn=$0.80/lb, Pb=$0.80/lb(2) See Appendix E for non-GAAP disclosure. (3) Capital expenditure is on an accrued basis and excludes capitalized interest; also excludes projects not yet approved(4) Includes capitalized exploration, 50% of exploration expense is expected to be expensed(5) Excludes share-based compensation expense of $68 million(6) The estimated effective tax rate is on net income exclusive of stock based compensation expense, the effects of foreign currency translation of deferred tax balances, impacts of foreign exchange fluctuation on tax losses and deductions
and balances and other discrete events.
Appendix A: 2016 Guidance

21
TOGETHER, CREATING SUSTAINABLE VALUE | MAY 2016
2015 Actual (oz) 2016E Guidance (oz)
Peñasquito 860,300 520,000–580,000
Cerro Negro 507,400 475,000–525,000
Pueblo Viejo (40%) 381,700 400,000–440,000
Red Lake 375,700 300,000–330,000
Éléonore 268,100 250,000–280,000
Porcupine 274,300 250,000–275,000
Musselwhite 270,300 240,000–260,000
Other(1) 526,600 380,000–440,000
TOTAL 3,464,400 2,800,000–3,100,000
(1) Other mines include Los Filos, Marlin and Alumbrera (37.5%), and for 2015 includes production from Wharf mine (divested Feb. 20, 2015)
Appendix B: Mine-by-Mine Guidance

22
TOGETHER, CREATING SUSTAINABLE VALUE | MAY 2016
Base Price
Change
Increments
Operating Cash
Flow per Share(1)
All-In Sustaining
Costs ($/oz)(1)
Free Cash
Flow(1) ($M)
Gold price ($/oz) $1,100 $100 $0.30 $2 $288
Silver price ($/oz) $15.00 $3.00 $0.09 $31 $94
Copper price ($/lb) $2.55 $0.50 $0.03 $12 $29
Zinc price ($/lb) $0.80 $0.10 $0.03 $12 $40
Lead price ($/lb) $0.80 $0.10 $0.01 $5 $16
Canadian dollar 1.30 10% $0.08 $31 $105
Mexican peso 16.00 10% $0.03 $16 $55
(1) See Appendix E for footnotes
Appendix C: 2016 Sensitivities

23
TOGETHER, CREATING SUSTAINABLE VALUE | MAY 2016
25%
16%
7%7%
9%
17%
1%
4%
6%
8%
Labour Contractors Fuel CostsPower Maintenance Parts ConsumablesTires Explosives Site CostsOthers
Latin
America
40%
15%3%6%
10%
13%
1%3%
7% 2%19%
18%
9%
6%7%
20%
2%
4%
6%
9%18%
12%
10%
13%
17%
11%
2%
3%
6%8%
Consolidated Canada Associates and
Joint Ventures
Appendix D: 2016 Production Costs

24
TOGETHER, CREATING SUSTAINABLE VALUE | MAY 2016
Note 1: The Company has included non-GAAP performance measures on an attributable (or Goldcorp’s share) basis throughout this presentation. Attributable performance measures include
the Company’s mining operations, including its discontinued operation, and projects, and the Company’s share of Alumbrera and Pueblo Viejo. The Company believes that disclosing certain
performance measures on an attributable basis is a more relevant measurement of the Company’s operating and economic performance, and reflects the Company’s view of its core mining
operations. The Company believes that, in addition to conventional measures prepared in accordance with GAAP, the Company and certain investors use this information to evaluate the
Company’s performance and ability to generate cash flow; however, these performance measures do not have any standardized meaning. Accordingly, it is intended to provide additional
information and should not be considered in isolation or as a substitute for measures of performance prepared in accordance with GAAP.
Note 2: All-in sustaining cost per gold ounce is a non-GAAP performance measure that has been included in this presentation as the Company believes it more fully defines the total costs
associated with producing gold. Refer to pages 46-47 of the 2015 Annual MD&A and pages 29-30 of the Q1 2016 MD&A for a reconciliation of all-in sustaining costs.
Note 3: Total cash costs: by-product, per gold ounce is a non-GAAP performance measure that has been included in this presentation Refer to pages 44 & 45 of the 2015 Annual MD&A and
pages 27-28 of the Q1 2016 MD&A for a reconciliation of total cash costs and all-in sustaining costs to reported production costs.
Note 4: Adjusted operating cash flows are non-GAAP performance measures which comprise Goldcorp’s share of operating cash flows before working capital changes and which the
Company believes provides additional information about the Company’s ability to generate cash flows from its mining operations. Accordingly, it is intended to provide additional information
and should not be considered in isolation or as a substitute for measures of performance prepared in accordance with GAAP. Refer to page 50 of the 2015 Annual MD&A and page31 of the
Q1 2016 MD&A for a reconciliation of adjusted operating cash flows before working capital changes to reported net cash provided by operating activities.
Note 5: Free cash flow is a non-GAAP performance measure which the Company believes, in addition to conventional measures prepared in accordance with GAAP, the Company and
certain investors use to evaluate the Company's ability to generate cashflows. Accordingly, it is intended to provide additional information and should not be considered in isolation or as a
substitute for measures of performance prepared in accordance with GAAP. Free cash flows are calculated by deducting from net cash provided by operating activities, Goldcorp's share of
expenditures on mining interests, deposits on mining interest expenditures and capitalized interest paid, and adding Goldcorp's share of net cash provided by operating activities from
Alumbrera, Pueblo Viejo and Project Corridor. Refer to page 51 of the 2015 Annual MD&A and page 31 of the Q1 2016 MD&A for a reconciliation of free cash flows to reported net cash
provided by operating activities.
Note 6: Net Debt/Market capitalization is a non-GAAP performance measure which the Company believes, in addition to conventional measures prepared in accordance with GAAP, the
Company and certain investors use to evaluate the Company's debt levels relative to its peers. Accordingly, it is intended to provide additional information and should not be considered in
isolation or as a substitute for measures of performance prepared in accordance with GAAP and it has no standardized meaning. Net debt is calculated, on an attributable basis to include the
Company’s share of Alumbrera and Pueblo Viejo, by adding short term and long term debt less cash and cash equivalents. Market capitalization is information retrieved from Capital IQ and
uses the outstanding number of shares of a company multiplied by its share price as at a certain time period.
Appendix E: Footnotes

25
TOGETHER, CREATING SUSTAINABLE VALUE | MAY 2016
Tonnage Grade Contained Tonnage Grade Contained Tonnage Grade Contained
mt g/t m oz mt g/t m oz mt g/t m oz
Alumbrera 37.5% 10.69 0.35 0.12 0.26 0.31 0.00 10.95 0.35 0.12
Borden 100.0% - - - 4.17 6.38 0.86 4.17 6.38 0.86
Camino Rojo 100.0% - - - 66.13 0.76 1.62 66.13 0.76 1.62
Cerro Blanco 100.0% - - - - - - - - -
Cerro Negro 100.0% 5.02 10.58 1.71 10.00 9.17 2.95 15.02 9.64 4.66
Cochenour 100.0% - - - - - - - - -
Dee 40.0% - - - 0.00 0.00 0.00 0.00 0.00 0.00
El Morro 50.0% 160.91 0.56 2.91 138.62 0.35 1.55 299.53 0.46 4.46
El Sauzal 100.0% - - - - - - - - -
Éléonore 100.0% 4.17 6.49 0.87 24.15 5.76 4.48 28.32 5.87 5.35
Los Filos 100.0% 20.01 0.94 0.60 20.49 1.30 0.85 40.50 1.12 1.46
Marlin 100.0% 0.65 5.34 0.11 0.16 3.98 0.02 0.81 5.07 0.13
Musselwhite 100.0% 2.87 7.20 0.67 5.00 6.57 1.06 7.88 6.80 1.72
Noche Buena 100.0% - - - - - - - - -
Peñasquito Heap Leach 100.0% 16.32 0.45 0.24 5.46 0.37 0.07 21.78 0.43 0.30
Peñasquito Mill 100.0% 398.28 0.58 7.48 188.40 0.39 2.39 586.68 0.52 9.87
Porcupine 100.0% 8.38 2.58 0.69 35.43 1.26 1.44 43.82 1.51 2.13
Pueblo Viejo 40.0% 37.02 2.97 3.53 25.57 2.97 2.44 62.58 2.97 5.97
Red Lake 100.0% 1.24 12.84 0.51 5.86 8.31 1.57 7.10 9.10 2.08
San Nicolas 21.0% - - - - - - - - -
Totals 665.55 0.91 19.44 529.71 1.25 21.28 1,195.27 1.06 40.73
Proven and Probable
Gold
GOLDCORP MINERAL RESERVES
Proven Probable
As of December 31, 2015
Appendix F: Reserves and Resources

26
TOGETHER, CREATING SUSTAINABLE VALUE | MAY 2016
Tonnage Grade Contained Tonnage Grade Contained Tonnage Grade Contained Tonnage Grade Contained
mt g/t m oz mt g/t m oz mt g/t m oz mt g/t m oz
Alumbrera 37.5% 51.19 0.34 0.55 18.11 0.39 0.23 69.30 0.35 0.78 22.50 0.33 0.24
Borden 100.0% - - - 2.61 5.81 0.49 2.61 5.81 0.49 2.09 5.49 0.37
Camino Rojo 100.0% - - - 234.24 1.00 7.53 234.24 1.00 7.53 17.38 0.84 0.47
Cerro Blanco 100.0% - - - 2.05 12.69 0.84 2.05 12.69 0.84 0.75 9.34 0.23
Cerro Negro 100.0% 1.35 4.99 0.22 5.53 5.97 1.06 6.88 5.78 1.28 2.17 7.19 0.50
Cochenour 100.0% - - - - - - - - - 4.16 16.36 2.19
Dee 40.0% 0.00 0.00 0.00 0.00 0.00 0.00 0.00 0.00 0.00 0.00 0.00 0.00
El Morro 50.0% 9.90 0.53 0.17 36.28 0.38 0.44 46.18 0.41 0.61 339.03 0.30 3.23
El Sauzal 100.0% - - - 0.00 0.00 0.00 0.00 0.00 0.00 0.00 0.00 0.00
Éléonore 100.0% 0.94 6.84 0.21 3.65 5.14 0.60 4.58 5.49 0.81 9.97 7.11 2.28
Los Filos 100.0% 81.57 0.88 2.31 276.31 0.83 7.34 357.88 0.84 9.65 141.04 0.80 3.62
Marlin 100.0% 0.27 4.25 0.04 0.22 4.28 0.03 0.49 4.26 0.07 0.06 5.93 0.01
Musselwhite 100.0% 0.23 5.76 0.04 1.60 6.04 0.31 1.83 6.00 0.35 5.93 5.82 1.11
Noche Buena 100.0% - - - 52.88 0.37 0.63 52.88 0.37 0.63 4.30 0.22 0.03
Peñasquito Heap Leach 100.0% 12.60 0.18 0.07 34.95 0.16 0.18 47.54 0.17 0.26 0.57 0.31 0.01
Peñasquito Mill 100.0% 94.47 0.28 0.86 150.86 0.28 1.34 245.33 0.28 2.20 19.49 0.30 0.19
Porcupine 100.0% 21.80 1.38 0.97 81.20 1.39 3.62 103.00 1.39 4.59 13.85 3.69 1.64
Pueblo Viejo 40.0% 4.49 2.51 0.36 60.76 2.45 4.79 65.25 2.46 5.15 1.56 1.96 0.10
Red Lake 100.0% 1.24 21.88 0.87 2.48 17.60 1.40 3.71 19.02 2.27 3.45 19.86 2.20
San Nicolas 21.0% - - - 19.26 0.46 0.28 19.26 0.46 0.28 2.28 0.26 0.02
Totals 280.03 0.74 6.67 982.98 0.98 31.11 1,263.01 0.93 37.78 590.55 0.97 18.42
GOLDCORP MINERAL RESOURCES
Measured Indicated Measured & Indicated Inferred
Gold
As of December 31, 2015
Appendix F: Reserves and Resources (continued)

27
TOGETHER, CREATING SUSTAINABLE VALUE | MAY 2016
Scientific and technical information contained in this presentation was reviewed and approved by Gil Lawson, P.Eng., Vice-President, Geology and Mine Planning for Goldcorp, and a “qualified person”
as defined by National Instrument 43-101 – Standards of Disclosure for Mineral Projects (“NI 43-101”)
For additional information on the 2015 mineral reserves and mineral resources (“MRMR”), refer to the MRMR tables that can be found at www.goldcorp.com
Goldcorp December 31, 2015 Mineral Reserve and Mineral Resource Reporting Notes:
1 All Mineral Reserves or Ore Reserves have been estimated in accordance with the CIM Definition Standards or the JORC Code. The JORC Code has been accepted for current disclosure rules in
Canada under NI 43-101. Subject to note 4 below, all Mineral Reserves, Ore Reserves and Mineral Resources set out in the tables above have been reviewed and approved by Gil Lawson, P.Eng.,
Vice President of Geology and Mine Planning, Goldcorp, who is a qualified person as defined under National Instrument.
2 All Mineral Resources are reported exclusive of Mineral Reserves.
3 Mineral Resources which are not Mineral Reserves do not have demonstrated economic viability.
4 Mineral Reserves and Mineral Resources are reported as of December 31, 2015, with the following conditions or exceptions:
1 Reserves and Resources for Pueblo Viejo are as per information provided by Barrick Gold Corporation.
2 Reserves and Resources for Relincho and San Nicolas are as per information provided by Teck Resources Limited.
3 Reserves and Resources for Alumbrera are as per information provided by Glencore plc.
5 Mineral Reserves are estimated using appropriate recovery rates and US$ commodity prices of $1,100 per ounce of gold, $16.50 per ounce of silver, $2.75 per pound of copper, $0.90 per pound of
lead, and $0.95 per pound of zinc, unless otherwise noted below:
1 Alumbrera $1,095/oz gold, $2.54/lb copper
2 El Morro $1,200/oz gold
3 Pueblo Viejo $1,000/oz gold for the next five years, and a long-term gold price of $1,200/oz from 2021 onwards, $16.50/oz silver, $3.00/lb copper
4 Relincho $13.70/lb molybdenum, $2.80/lb copper
6 Mineral Resources are estimated using US$ commodity prices of $1,300 per ounce of gold, $19 per ounce of silver, $3.25 per pound of copper, $1.00 per pound of lead and $1.00 per pound of
zinc, unless otherwise noted below:
1 Alumbrera $1,100/oz gold, $2.95/lb copper
2 El Morro $1,200/oz gold, $2.75/lb copper
3 Pueblo Viejo $1,300/oz gold, $17.50/oz silver, $3.25/lb copper
4 Relincho $13.70/lb molybdenum, $2.80/lb copper
5 San Nicolas $1,275/oz gold, $22.50/oz silver, $2.75/lb copper, $1.00/lb zinc
Appendix F: Reserves and Resources (continued)

28
TOGETHER, CREATING SUSTAINABLE VALUE | MAY 2016
Cautionary Note Regarding Reserves and Resources:
Scientific and technical information contained in this news release was reviewed and approved by Gil Lawson, P.Eng., Vice-President, Geology and Mine Planning for
Goldcorp, and a “qualified person” as defined by Canadian Securities Administrators’ National Instrument 43-101 – Standards of Disclosure for Mineral Projects (“NI 43-
101”). All Mineral Reserves and Mineral Resources have been calculated in accordance with the standards of the Canadian Institute of Mining, Metallurgy and Petroleum
(“CIM”) and NI 43-101, or the AusIMM JORC equivalent. All Mineral Resources are reported exclusive of Mineral Reserves. Mineral Resources which are not Mineral
Reserves do not have demonstrated economic viability. Information of data verification performed on the mineral properties mentioned in this press release that are
considered to be material mineral properties to the Company are contained in Goldcorp’s most recent Annual Information Form and the current technical report for those
properties, all available at www.sedar.com.
Cautionary Note to United States investors concerning estimates of measured, indicated and inferred resources: This document has been prepared in accordance with the
requirements of the Canadian securities laws which differ from the requirements of United States securities laws and uses terms that are not recognized by the United
States Securities and Exchange Commission (“SEC”). The terms “Mineral Reserve”, “Proven Mineral Reserve” and “Probable Mineral Reserve” are Canadian mining terms
as defined in accordance with the CIM Definition Standards adopted by CIM Council on May 10, 2014 (the “CIM Definition Standards”) which were incorporated by reference
in NI 43-101. These definitions differ from the definitions in SEC Industry Guide 7 (“SEC Industry Guide 7”) under United States securities laws. Under SEC Industry Guide 7
standards, a “final” or “bankable” feasibility study is required to report reserves or cash flow analysis to designate reserves and the primary environmental analysis or report
must be filed with the appropriate governmental authority.
In addition, the terms “Mineral Resource”, “Measured Mineral Resource”, “Indicated Mineral Resource” and “Inferred Mineral Resource” are defined in and required to be
disclosed by NI 43-101; however, these terms are not defined terms under SEC Industry Guide 7 and are normally not permitted to be used in reports and registration
statements filed with the SEC. United States investors are cautioned not to assume that any part or all of mineral deposits in these categories will ever be converted into
reserves. “Inferred Mineral Resources” have a great amount of uncertainty as to their existence and their economic and legal feasibility. A significant amount of exploration
must be completed in order to determine whether an Inferred Mineral Resource may be upgraded to a higher category. Under Canadian regulations, estimates of Inferred
Mineral Resources may not form the basis of feasibility or pre-feasibility studies, except in rare cases. United States investors are cautioned not to assume that all or any
part of an Inferred Mineral Resource exists or is economically or legally mineable. Disclosure of “contained ounces” in a resource is permitted disclosure under Canadian
regulations if such disclosure includes the grade or quality and the quantity for each category of Mineral Resource and Mineral Reserve; however, the SEC normally only
permits issuers to report mineralization that does not constitute “reserves” by SEC standards as in place tonnage and grade without reference to unit measures.
Accordingly, information contained in this presentation containing descriptions of the Company’s mineral deposits may not be comparable to similar information made public
by United States companies subject to the reporting and disclosure requirements under the United States federal securities laws and the rules and regulations thereunder.
Appendix F: Reserves and Resources (continued)

29
TOGETHER, CREATING SUSTAINABLE VALUE | MAY 2016
Trading Symbols
NYSE: GG; TSE: G
Investor relations
1-800-567-6223