Embed Size (px)
Citation preview
November 8, 2017
Third Quarter 2017 Results

2
Safe Harbor Statement Under the Private Securities Litigation Reform Act of 1995
All information set forth in this presentation, except historical and factual information, represents forward-looking statements. This includes all statements about the company’s plans, beliefs, estimates, and expectations. These statements are based on current estimates, projections and assumptions, which involve certain risks and uncertainties that could cause actual results to differ materially from those in the forward-looking statements. Important factors that may affect these forward-looking statements include, but are not limited to: intense competition; the ability to execute TDS’ business strategy; uncertainties in TDS’ future cash flows and liquidity and access to the capital markets; the ability to make payments on TDS and U.S. Cellular indebtedness or comply with the terms of debt covenants; impacts of any pending acquisitions/divestitures/exchanges of properties and/or licenses, including, but not limited to, the ability to obtain regulatory approvals, successfully complete the transactions and the financial impacts of such transactions; the ability of the company to successfully manage and grow its markets; the access to and pricing of unbundled network elements; the ability to obtain or maintain roaming arrangements with other carriers on acceptable terms; the state and federal telecommunications regulatory environment; the value of assets and investments; adverse changes in the ratings afforded TDS and U.S. Cellular debt securities by accredited ratings organizations; industry consolidation; advances in telecommunications technology; pending and future litigation; changes in income tax rates, laws, regulations or rulings; changes in customer growth rates, average monthly revenue per user, churn rates, roaming revenue and terms, the availability of wireless devices, or the mix of products and services offered by U.S. Cellular and TDS Telecom. Investors are encouraged to consider these and other risks and uncertainties that are discussed in documents furnished to the Securities and Exchange Commission.

3
Upcoming conferences
• December 4 – UBS 45th Annual Global Media and Communications Conference (New York)
• From management: LeRoy T. Carlson, Jr. and Jane W. McCahon
• January 9 – Citi 2018 Global TMT West Conference (Las Vegas)
• From management: Kenneth R. Meyers and Jane W. McCahon

4
Third quarter items • U.S. Cellular and HMS reporting units revised their long-range
financial forecasts triggering goodwill impairment losses
• U.S. Cellular management revised its long-range forecast due to competitive intensity, primarily due to the impact of unlimited plans limiting the ability to monetize data growth and the anticipation of increased competition in its markets over the next several years
• HMS management revised its forecast due to slower than expected revenue growth coupled with a revenue mix of lower margin revenue streams from prior forecasts
• TDS recognized a $262 million charge ($227 million for its U.S. Cellular reporting unit and $35 million for its HMS reporting unit)
• U.S. Cellular recorded a $370 million charge
• HMS segment reporting to TDS Corporate as of 1/1/18

5
6
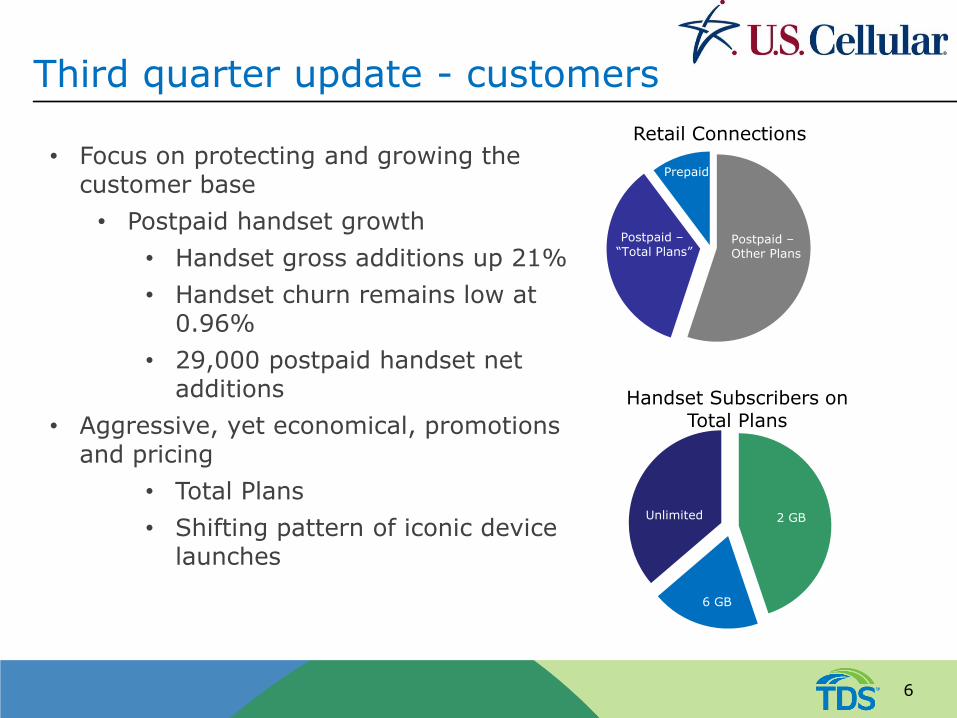
Third quarter update - customers
• Focus on protecting and growing the customer base
• Postpaid handset growth
• Handset gross additions up 21%
• Handset churn remains low at 0.96%
• 29,000 postpaid handset net additions
• Aggressive, yet economical, promotions and pricing
• Total Plans
• Shifting pattern of iconic device launches
Retail Connections
Postpaid – Other Plans
Prepaid
Postpaid – “Total Plans”
Handset Subscribers on Total Plans
Unlimited
6 GB
2 GB

7
Third quarter update - network
• Network quality remains our competitive advantage
• Network performance remains strong even with increased data usage from the adoption of unlimited plans
• VoLTE deployment
• Completed commercial launch in Iowa
• WI, WA, OR and CA are next VoLTE markets for 2018
• New products and services for customers
• Roaming revenue opportunity

8
Third quarter update – other strategic imperatives
• Drive high margin revenue streams
• Accessory sales
• Device protection plans
• VoLTE roaming
• Cash expenses down across all major categories
• Manage capital investments
• VoLTE deployment on schedule and on budget
• Managing network capital demands

9
Third quarter highlights
• Growth in both postpaid and prepaid connections
• Competitive pricing pressure on revenues
• Roaming transition
• Cost reductions in all major areas
• Adjusted OIBDA of $167 million, down 6% YOY
- Guidance for full year profitability raised
• Loss on impairment of goodwill
• Sufficient financial resources and liquidity

10
Postpaid connections activity
115,000 116,000
95,000
123,000 139,000
59,000 71,000
51,000
51,000
52,000
0
50,000
100,000
150,000
200,000
Gross Additions
Handsets Connected Devices
(27,000) (25,000) (28,000)
19,000
29,000
21,000 23,000
4,000
6,000
(35,000)
(25,000)
(15,000)
(5,000)
5,000
15,000
25,000
35,000
Net Additions
Handsets Connected Devices
Q3’16 Q4’16 Q1’17 Q2’17 Q3’17
1,000
Q3’16 Q4’16 Q1’17 Q2’17 Q3’17

11
Postpaid churn rate
1.22% 1.23%
1.08%
0.91% 0.96%
2.04%
2.49% 2.55%
2.35% 2.33%
0.00%
0.50%
1.00%
1.50%
2.00%
2.50%
3.00%
Q3'16 Q4'16 Q1'17 Q2'17 Q3'17
Handsets Connected Devices

12
Total operating revenues (in millions)
(1) Equipment installment plan interest income is reflected as a component of Other revenues consistent with an accounting policy change effective January 1, 2017. All prior period numbers have been recast to conform to this accounting change.
$681 $656 $657 $647 $636
$239 $254 $190 $223 $226
$-
$200
$400
$600
$800
$1,000
$1,200
Q3'16 Q4'16 Q1'17 Q2'17 Q3'17
Other service
Tower rental
Inbound roaming
Equipment sales
Retail service
$1,023
$963
(1)

13
Postpaid revenue
(1) ABPU and ABPA are non-GAAP financial measures that are defined in the non-GAAP reconciliation at the end of the presentation.
$47.08 $45.19 $45.42 $44.60 $43.41
$9.71 $10.24 $10.40 $10.59 $11.30
$0
$10
$20
$30
$40
$50
$60
$70
Q3'16 Q4'16 Q1'17 Q2'17 Q3'17
Average Revenue Per User EIP Billings
Average Billings Per User (ABPU)1
$125.31 $120.67 $121.88 $119.73 $116.36
$25.85 $27.35 $27.90 $28.42 $30.29
$0
$20
$40
$60
$80
$100
$120
$140
$160
Q3'16 Q4'16 Q1'17 Q2'17 Q3'17
Average Revenue Per Account EIP Billings
Average Billings Per Account (ABPA)1
$56.79
$151.16
$55.43 $55.82 $55.19
$148.02 $149.78 $148.15
ABPU down 4% Y/Y ABPA down 3% Y/Y
$54.71
$146.65

14
($ in millions) Q3’17 Q3’16
% Change
Total operating revenues (3) $963 $1,023 (6%)
System operations expense 185 196 (6%)
Cost of equipment sold 261 280 (7%)
SG&A expenses 350 370 (5%)
Total cash expenses (1) 796 846 (6%)
Adjusted OIBDA (2)(3) $167 $177 (6%)
Adjusted OIBDA
(1) Total cash expenses represent total operating expenses as shown in the Consolidated Statement of Operations Highlights, less depreciation, amortization and accretion and gains/losses.
(2) Adjusted OIBDA is a non-GAAP financial measure that is defined in the non-GAAP reconciliation at the end of the presentation.
(3) Equipment installment plan interest income is reflected as a component of Service revenues consistent with an accounting policy change effective January 1, 2017. All prior period numbers have been recast to conform to this accounting change.

15
Adjusted EBITDA
($ in millions) Q3’17 Q3’16
% Change
Adjusted OIBDA (1)(2) $167 $177 (6%)
Equity in earnings of unconsolidated entities 35 38 (7%)
Interest and dividend income (2) 2 1 68%
Adjusted EBITDA (1) $204 $216 (6%)
(1) Adjusted OIBDA and Adjusted EBITDA are non-GAAP financial measures that are defined in the non-GAAP reconciliation at the end of the presentation.
(2) Equipment installment plan interest income is reflected as a component of Service revenues consistent with an accounting policy change effective January 1, 2017. All prior period numbers have been recast to conform to this accounting change.

16
2017 guidance (1)
($ in millions) As of November 8, 2017 2016 Actual (2)
2017 Previous Estimates
2017 Revised Estimates
Total operating revenues $3,990 $3,800-$4,000 $3,850-$3,950
Adjusted OIBDA (3) $669 $550-$650 $600-$700
Adjusted EBITDA (3) $816 $700-$800 $740-$840
Capital expenditures $446 Approx. $500 Unchanged
(1) There can be no assurance that final results will not differ materially from such estimated results. (2) Equipment installment plan interest income is reflected as a component of Service revenues consistent
with an accounting policy change effective January 1, 2017. All prior period numbers have been recast to conform to this accounting change.
(3) Adjusted OIBDA and Adjusted EBITDA are non-GAAP financial measures that are defined in the non-GAAP reconciliation at the end of the presentation.

17

18
2017 strategic priorities
• Wireline
• Increase penetration in existing fiber markets and continue to modestly deploy fiber where economically feasible
• Leverage copper bonding to increase penetration of higher speed broadband customers
• Year 1 A-CAM – begin infrastructure builds to extend higher speeds into under-served areas
• Cable
• Increase broadband penetration
• Continue to evaluate potential acquisitions
• Hosted and Managed Services
• Focus on growth of recurring service revenues
• Continue process automation and standardization

19
TDS Telecom operating performance
($ in millions) Q3’17 Q3’16
% Change
Wireline $179 $175 2%
Cable 52 46 12%
HMS 56 68 (18%)
Total operating revenues (1) 285 287 (1%)
Cash expenses (1)(2) 206 217 (5%)
Adjusted EBITDA (3) $ 80 $ 71 14%
Capital expenditures $ 58 $ 40 44%
(1) Includes intercompany eliminations (2) Cash expenses represent cost of services, cost of equipment and products, and selling, general and
administrative expenses, and are identified as Expenses excluding depreciation, amortization and accretion on the Consolidated Statement of Operations Highlights.
(3) Adjusted EBITDA is a non-GAAP financial measure that is defined in the non-GAAP reconciliation at the end of the presentation.

20
Third quarter Wireline highlights
• IPTV connections up 8%
• Residential revenue per connection up 4%
• Demand for higher speeds is strong
• Ability to offset legacy revenue declines with growth from fiber investments and A-CAM support
Q3’16 Q4’16 Q1’17 Q2’17 Q3’17
% Change (Y/Y)
IPTV connections 43,600 45,300 45,200 46,200 47,200 8%
Residential revenue per connection $44.25 $44.27 $45.17 $46.39 $46.07 4%
ILEC Broadband
Q3’16 Q4’16 Q1’17 Q2’17 Q3’17
Take rate % at 10 MB or higher 52% 53% 54% 55% 56%
Take rate % at 50 MB or higher 18% 20% 20% 22% 23%

21
Wireline operating performance
($ in millions) Q3’17 Q3’16
% Change
Residential $80 $78 2%
Commercial 50 53 (6%)
Wholesale 49 43 13%
Total service revenues 178 174 2%
Cash expenses (1) 115 117 (2%)
Adjusted EBITDA (2) $66 $58 13%
Capital expenditures $41 $27 54%
(1) Cash expenses represent cost of services and selling, general and administrative expenses, and are identified as Expenses excluding depreciation, amortization and accretion on the Consolidated Statement of Operations Highlights.
(2) Adjusted EBITDA is a non-GAAP financial measure that is defined in the non-GAAP reconciliation at the end of the presentation.

22
Third quarter Cable highlights
• Broadband connections increase 10%
• Sixth consecutive quarter of double digit broadband growth
• Revenues increase 12%
• Adjusted EBITDA increases 36%
• 2017 cable acquisitions provide additional growth opportunities
• K2 – 1,300 homes passed
• Crestview – 21,000 homes passed
50,000
60,000
70,000
80,000
90,000
100,000
110,000
120,000
130,000
140,000
150,000
Q3'16Q4'16Q1'17Q2'17Q3'17
Video Voice Broadband
Connections
Broadband connections (Y/Y growth)
Total connections (Y/Y growth)
10%
3%
35%
36%
37%
38%
39%
40%
41%
Q3'16Q4'16Q1'17Q2'17Q3'17
Steady Growth in Broadband Penetration
3Q Y/Y 2.5%
Market Expansion

23
Cable operating performance
($ in millions)
Q3’17 Q3’16 %
Change
Residential $43 $37 16%
Commercial 9 9 (2)%
Total operating revenues 52 46 12%
Cash expenses (1) 38 36 6%
Adjusted EBITDA (2) $14 $10 36%
Capital expenditures $14 $11 29%
(1) Cash expenses represent cost of services and selling, general and administrative expenses, and are identified as Expenses excluding depreciation, amortization and accretion on the Consolidated Statement of Operations Highlights.
(2) Adjusted EBITDA is a non-GAAP financial measure that is defined in the non-GAAP reconciliation at the end of the presentation.

24
Third quarter HMS summary
• Service revenues impacted by lower hardware installation
• Lower spending by existing customers impacted equipment revenues
$29 $28 $29 $27 $28
$39 $34
$43
$23 $27
0
10
20
30
40
50
60
70
80
Q3'16 Q4'16 Q1'17 Q2'17 Q3'17
Service revenues Equipment revenues
Operating Revenues ($ in millions)
66%
34%
Rentable data center space
Filled Available

25
Hosted and Managed Services operating performance
($ in millions) Q3’17 Q3’16
% Change
Service revenues $28 $29 (2%)
Equipment and product sales 27 39 (30%)
Total operating revenues 56 68 (18%)
Cash expenses (1) 54 65 (16%)
Adjusted EBITDA (2) $ 1 $ 3 (52%)
Capital expenditures $ 2 $ 2 6%
(1) Cash expenses represent cost of services, cost of equipment and products, and selling, general and administrative expenses, and are identified as Expenses excluding depreciation, amortization and accretion on the Consolidated Statement of Operations Highlights.
(2) Adjusted EBITDA is a non-GAAP financial measure that is defined in the non-GAAP reconciliation at the end of the presentation.

26
2017 TDS Telecom guidance (1)
($ in millions) As of November 8, 2017
2016 Actual
2017 Estimates Previous
2017 Estimates Revised
Total operating revenues $1,151 $1,200-$1,250 $1,125-$1,150
Adjusted OIBDA (2) $295 $300-$340 $310-$330
Adjusted EBITDA (2) $298 $300-$340 $310-$330
Capital expenditures $173 Approx. $225 Unchanged
(1) There can be no assurance that final results will not differ materially from such estimated results. (2) Adjusted OIBDA and Adjusted EBITDA are non-GAAP financial measures that are defined in the non-
GAAP reconciliation at the end of the presentation.

27
Appendix

Adjusted OIBDA and Adjusted EBITDA Reconciliation
($ in millions) U.S.
Cellular Wireline Cable HMS
Total TDS
Telecom TDS (1) U.S.
Cellular Wireline Cable HMS
Total TDS
Telecom TDS (1)
Net income (loss) (GAAP) ($298) N/A N/A N/A ($15) ($231) $18 N/A N/A N/A $7 $16
Add back:
Income tax expense (benefit) (53) N/A N/A N/A 3 (5) 15 N/A N/A N/A 4 14
Income (loss) before income taxes (GAAP) (351) 28 2 (42) (12) (236) 33 17 -- (6) 11 30
Add back:
Interest expense 28 --- --- 1 1 43 28 --- --- 1 1 42
Depreciation, amortization and accretion expense 153 38 11 7 56 209 155 41 9 7 57 214
EBITDA (non-GAAP) (170) 65 13 (34) 45 16 216 57 9 3 69 286
Add back:
Loss on impairment of goodwill 370 --- --- 35 35 262 --- --- --- --- --- ---
(Gain) loss on sale of business and other exit costs, net (1) --- --- --- --- (1) --- --- --- --- --- ---
(Gain) loss on asset disposals, net 5 --- 1 --- 1 6 7 1 1 --- 2 8
(Gain) loss on license sales and exchanges, net --- --- --- --- --- --- (7) --- --- --- --- (7)
Adjusted EBITDA (2) (non-GAAP) 204 66 14 1 80 283 216 58 10 3 71 287
Deduct:
Equity in earnings of unconsolidated entities 35 --- --- --- --- 35 38 --- --- --- --- 38
Interest and dividend income (5) 2 2 --- --- 2 4 1 1 --- --- 1 2
Other, net --- --- --- --- --- --- --- --- --- --- --- (1)
Adjusted OIBDA (2) (3) (non-GAAP) $167 $64 $13 $1 $78 $244 $177 $57 $10 $3 $70 $248
Three months ended September 30, 2017 Three months ended September 30, 2016
28

Adjusted OIBDA and Adjusted EBITDA Reconciliation – 2017 Estimated and 2016 Full Year
2017 Estimated Results Actual Results Year ended December 31, 2016
(Dollars in millions) U.S. Cellular TDS Telecom TDS(1) U.S. Cellular TDS Telecom TDS (1)
Net income (loss) (GAAP)
N/A
N/A N/A
$49 $42 $52
Add back:
Income tax expense (benefit) N/A N/A
N/A
33 25 40
Income (loss) before income taxes (GAAP) $(350)-$(250) $50-$70 $(220)-$(100) $82 $67 $92
Add back:
Interest expense 110 5 170 113 3 170
Depreciation, amortization and accretion 610 220 835 618 224 850
EBITDA (non-GAAP) $370-$470 $275-$295 $785-$905 $813 $294 $1,112
Add back:
Loss on impairment of goodwill 370 35 265 ---
--- ---
(Gain) loss on sale of business and other exit costs, net --- --- --- --- --- (1)
(Gain) loss on license sales and exchanges, net (20) --- (20) (19) (1) (20)
(Gain) loss on asset disposals, net 20 --- 20 22 4 27
Adjusted EBITDA (2) (non-GAAP) $740-$840 $310-$330 $1,050-$1,170 $816 $298 $1,118
Deduct:
Equity in earnings of unconsolidated entities 130 --- 130 140 --- 140
Interest and dividend income (5) 10 --- 10 6 3 11
Other, net -- --- --- 1 --- ---
Adjusted OIBDA (2)(3)(non-GAAP) $600-$700 $310-$330 $910-$1,030 $669 $295 $967
29
In providing 2017 estimated results, TDS has not completed the below reconciliation to net income because it does not provide guidance for income taxes. TDS believes that the impact of income taxes cannot be reasonably predicted; therefore, the company is unable to provide such guidance.

Postpaid ABPU (4) and Postpaid ABPA (4) Reconciliation (Dollars and connection counts in millions))
Three months ended
September 30, 2017
Three months ended
September 30, 2016
Calculation of Postpaid ARPU
Postpaid service revenues $586 $635
Average number of postpaid connections 4.50 4.49
Number of months in period 3 3
Postpaid ARPU (GAAP metric) $43.41 $47.08
Calculation of Postpaid ABPU (4)
Postpaid service revenues $586 $635
Equipment installment plan billings 152 131
Total billings to postpaid connections $738 $766
Average number of postpaid connections 4.50 4.49
Number of months in period 3 3
Postpaid ABPU (non-GAAP metric) (4) $54.71 $56.79
Calculation of Postpaid ARPA
Postpaid service revenues $586 $635
Average number of postpaid accounts 1.68 1.69
Number of months in period 3 3
Postpaid ARPA (GAAP metric) $116.36 $125.31
Calculation of Postpaid ABPA (4)
Postpaid service revenues $586 $635
Equipment installment plan billings 152 131
Total billings to postpaid accounts $738 $766
Average number of postpaid accounts 1.68 1.69
Number of months in period 3 3
Postpaid ABPA (non-GAAP metric) (4) $146.65 $151.16
30

31
1) The TDS column includes U.S. Cellular, TDS Telecom and also the impacts of consolidating eliminations, corporate operations and non-reportable segments, all of which are not presented above.
2) Adjusted EBITDA is defined as net income adjusted for the items set forth in the reconciliation above. Adjusted OIBDA is defined as net income adjusted for the items set forth in the reconciliation above. Adjusted EBITDA and Adjusted OIBDA are not measures of financial performance under Generally Accepted Accounting Principles in the United States (GAAP) and should not be considered as alternatives to Net income or Cash flows from operating activities, as indicators of cash flows or as measures of liquidity. TDS does not intend to imply that any such items set forth in the reconciliation above are non-recurring, infrequent or unusual; such items may occur in the future. Management uses Adjusted EBITDA and Adjusted OIBDA as measurements of profitability, and therefore reconciliations to Net income are deemed appropriate. Management believes Adjusted EBITDA and Adjusted OIBDA are useful measures of TDS’ operating results before significant recurring non-cash charges, gains and losses, and other items as presented above as they provide additional relevant and useful information to investors and other users of TDS’ financial data in evaluating the effectiveness of its operations and underlying business trends in a manner that is consistent with management’s evaluation of business performance. Adjusted EBITDA shows adjusted earnings before interest, taxes, depreciation, amortization and accretion, and gains and losses, while Adjusted OIBDA reduces this measure further to exclude Equity in earnings of unconsolidated entities and Interest and dividend income in order to more effectively show the performance of operating activities excluding investment activities. The table above reconciles Adjusted EBITDA and Adjusted OIBDA flow to the corresponding GAAP measure, Net income (loss) or Income (loss) before income taxes.
3) A reconciliation of Adjusted OIBDA (Non-GAAP) and Operating income (excluding gains and losses) (Non-GAAP) to operating income (GAAP) for September 30, 2017 actual results can be found on the company's website at investors.tdsinc.com.
4) U.S. Cellular presents Postpaid ABPU and Postpaid ABPA to reflect the revenue shift from Service revenues to Equipment and product sales resulting from the increased adoption of equipment installment plans. Postpaid ABPU and Postpaid ABPA, as previously defined, are non-GAAP financial measures which U.S. Cellular believes are useful to investors and other users of its financial information in showing trends in both service and equipment revenues received from customers.
5) Equipment installment plan interest income is reflected as a component of Service revenues consistent with an accounting policy change effective January 1, 2017. All prior period numbers have been recast to conform to this accounting change.