Embed Size (px)
Citation preview

Mark Mullin Michiel van Katwijk
CEO CFO
Analyst & Investor Conference - London - January 13, 2016
Americas
2 2
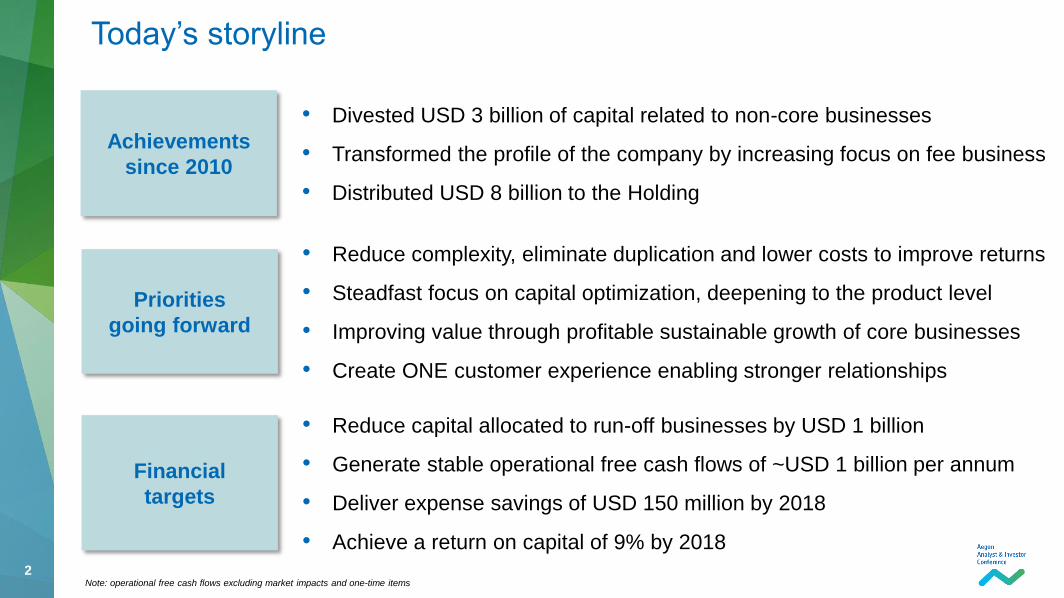
Note: operational free cash flows excluding market impacts and one-time items
• Divested USD 3 billion of capital related to non-core businesses
• Transformed the profile of the company by increasing focus on fee business
• Distributed USD 8 billion to the Holding
Achievements
since 2010
• Reduce complexity, eliminate duplication and lower costs to improve returns
• Steadfast focus on capital optimization, deepening to the product level
• Improving value through profitable sustainable growth of core businesses
• Create ONE customer experience enabling stronger relationships
Priorities
going forward
• Reduce capital allocated to run-off businesses by USD 1 billion
• Generate stable operational free cash flows of ~USD 1 billion per annum
• Deliver expense savings of USD 150 million by 2018
• Achieve a return on capital of 9% by 2018
Financial
targets
Today’s storyline
3 3
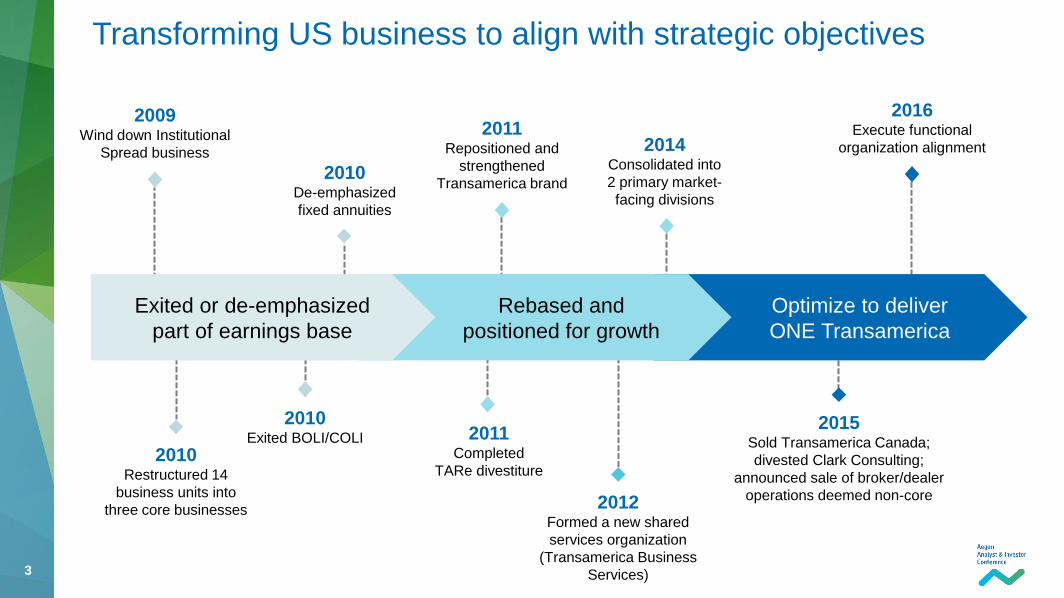
Transforming US business to align with strategic objectives
Optimize to deliver
ONE Transamerica
Rebased and
positioned for growth
Exited or de-emphasized
part of earnings base
2009 Wind down Institutional
Spread business
2010 Restructured 14
business units into
three core businesses
2011 Completed
TARe divestiture
2012 Formed a new shared
services organization
(Transamerica Business
Services)
2010 Exited BOLI/COLI
2010 De-emphasized
fixed annuities
2011 Repositioned and
strengthened
Transamerica brand
2014 Consolidated into
2 primary market-
facing divisions
2015 Sold Transamerica Canada;
divested Clark Consulting;
announced sale of broker/dealer
operations deemed non-core
2016 Execute functional
organization alignment
4 4
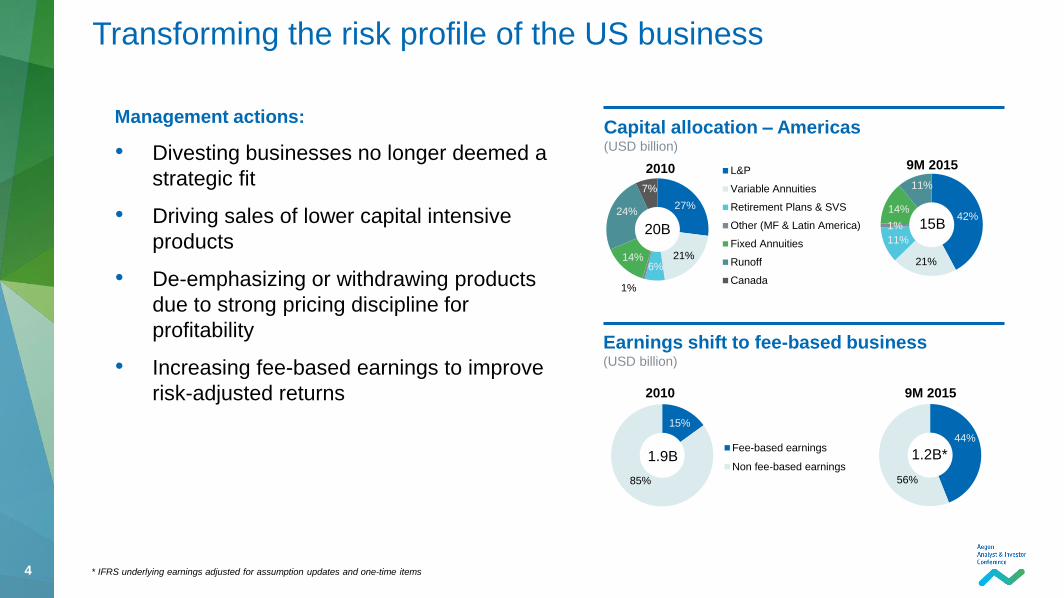
Management actions:
• Divesting businesses no longer deemed a
strategic fit
• Driving sales of lower capital intensive
products
• De-emphasizing or withdrawing products
due to strong pricing discipline for
profitability
• Increasing fee-based earnings to improve
risk-adjusted returns
Transforming the risk profile of the US business
Capital allocation – Americas
(USD billion)
Earnings shift to fee-based business (USD billion)
42%
21%
11%
1%
14%
11%
44%
56%
1.2B*
15B
9M 2015
9M 2015
20B
2010
15%
85%
Fee-based earnings
Non fee-based earnings1.9B
2010
27%
21% 6%
1%
14%
24%
7%
L&P
Variable Annuities
Retirement Plans & SVS
Other (MF & Latin America)
Fixed Annuities
Runoff
Canada
* IFRS underlying earnings adjusted for assumption updates and one-time items
5 5
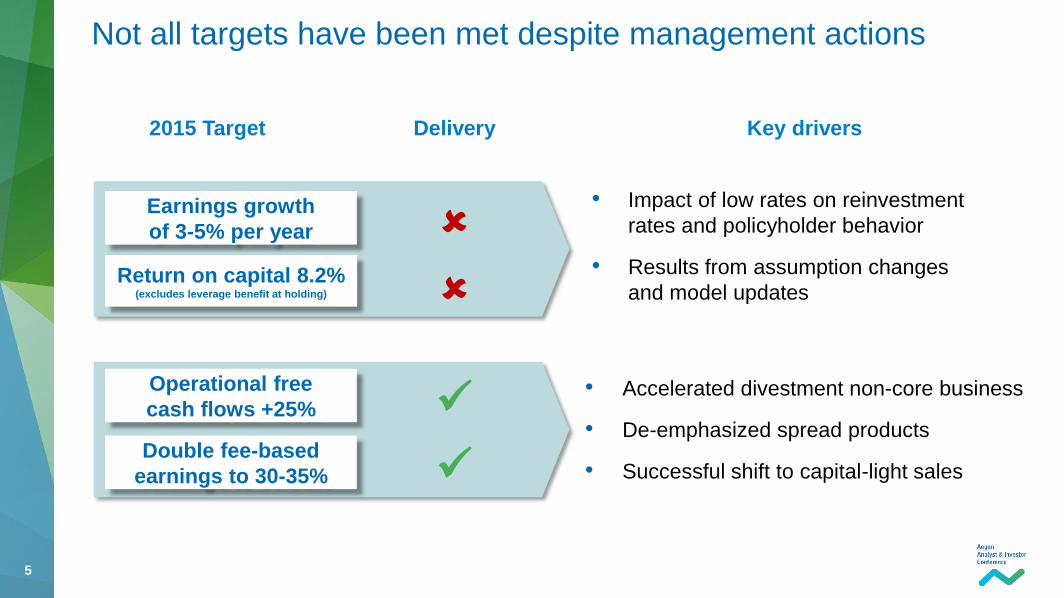
• Impact of low rates on reinvestment
rates and policyholder behavior
• Results from assumption changes
and model updates
Not all targets have been met despite management actions
Earnings growth
of 3-5% per year
Return on capital 8.2% (excludes leverage benefit at holding)
2015 Target
Key drivers Delivery
• Accelerated divestment non-core business
• De-emphasized spread products
• Successful shift to capital-light sales
Operational free
cash flows +25%
Double fee-based
earnings to 30-35%
6 6
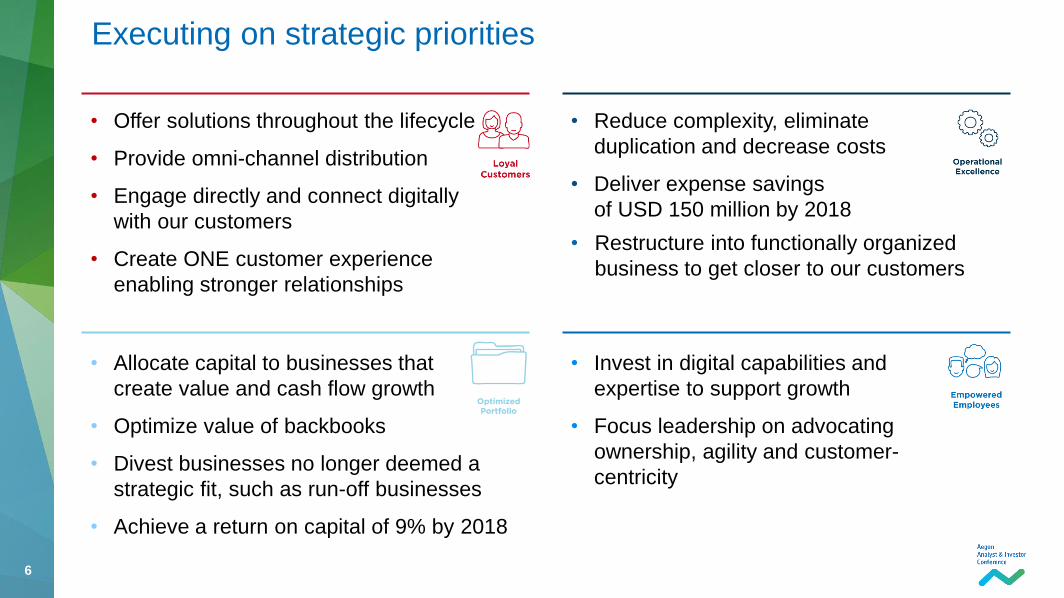
Executing on strategic priorities
• Offer solutions throughout the lifecycle
• Provide omni-channel distribution
• Engage directly and connect digitally
with our customers
• Create ONE customer experience
enabling stronger relationships
• Invest in digital capabilities and
expertise to support growth
• Focus leadership on advocating
ownership, agility and customer-
centricity
• Reduce complexity, eliminate
duplication and decrease costs
• Deliver expense savings
of USD 150 million by 2018
• Restructure into functionally organized
business to get closer to our customers
• Allocate capital to businesses that
create value and cash flow growth
• Optimize value of backbooks
• Divest businesses no longer deemed a
strategic fit, such as run-off businesses
• Achieve a return on capital of 9% by 2018

7
Transforming the organization to best position for the future
8 8
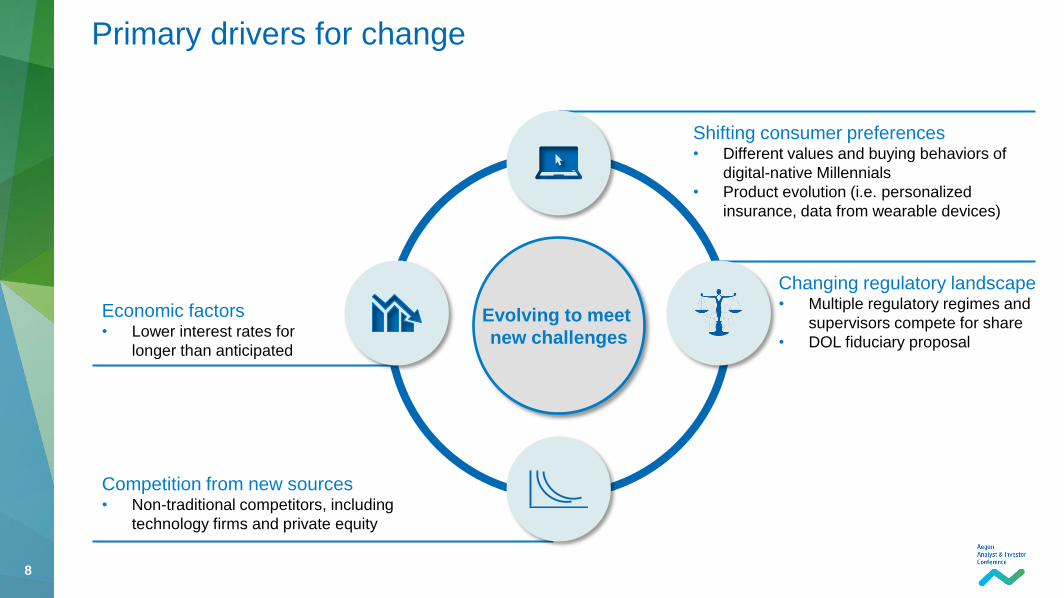
Primary drivers for change
Evolving to meet
new challenges
Economic factors • Lower interest rates for
longer than anticipated
Competition from new sources • Non-traditional competitors, including
technology firms and private equity
Shifting consumer preferences • Different values and buying behaviors of
digital-native Millennials
• Product evolution (i.e. personalized
insurance, data from wearable devices)
Changing regulatory landscape • Multiple regulatory regimes and
supervisors compete for share
• DOL fiduciary proposal
9 9
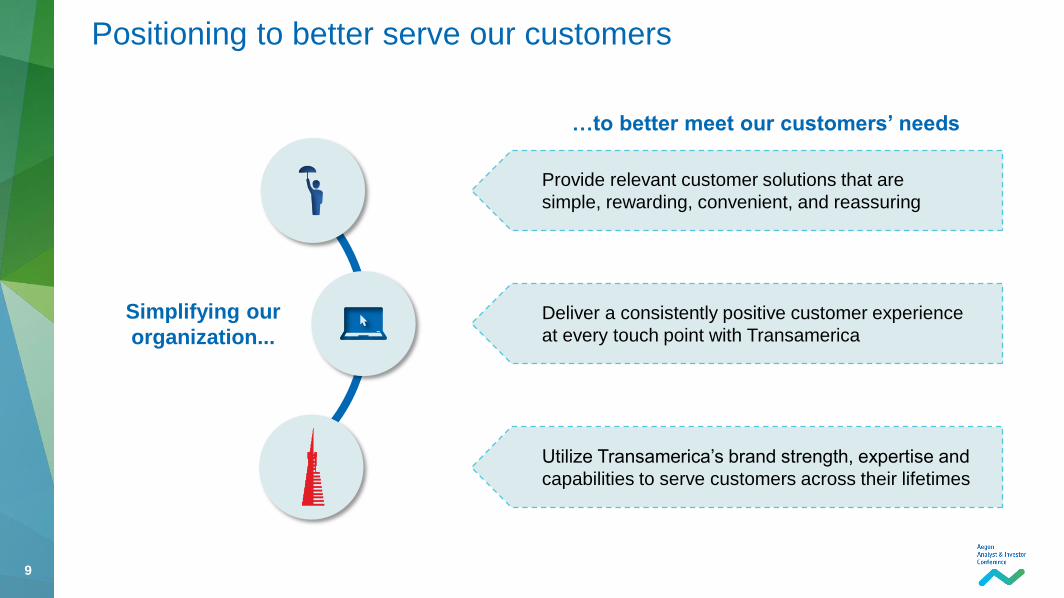
Positioning to better serve our customers
…to better meet our customers’ needs
Provide relevant customer solutions that are
simple, rewarding, convenient, and reassuring
Deliver a consistently positive customer experience
at every touch point with Transamerica
Utilize Transamerica’s brand strength, expertise and
capabilities to serve customers across their lifetimes
Simplifying our
organization...
10 10
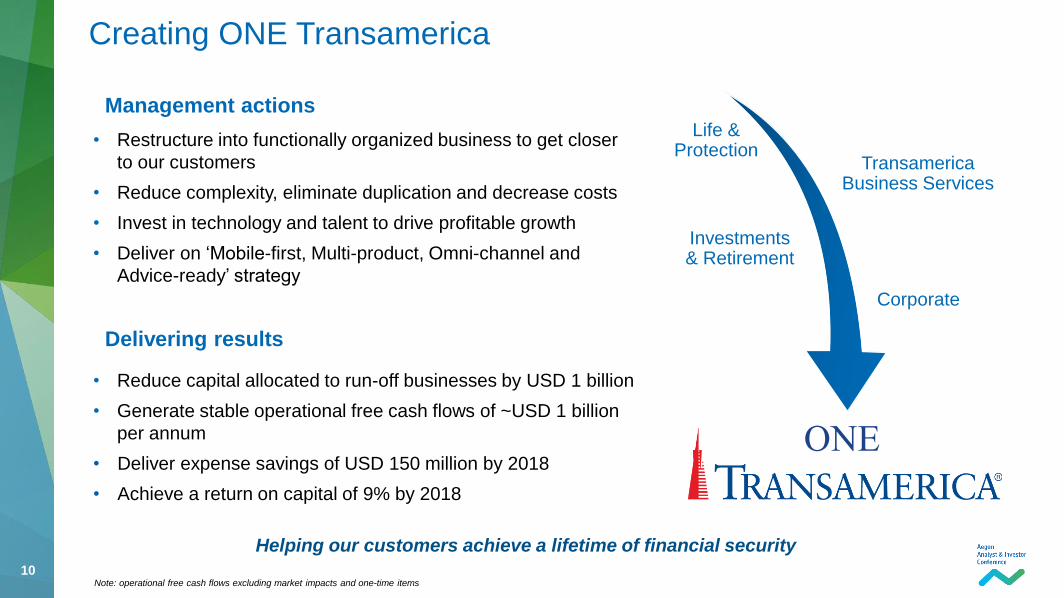
Helping our customers achieve a lifetime of financial security
Creating ONE Transamerica
ONE
• Restructure into functionally organized business to get closer
to our customers
• Reduce complexity, eliminate duplication and decrease costs
• Invest in technology and talent to drive profitable growth
• Deliver on ‘Mobile-first, Multi-product, Omni-channel and
Advice-ready’ strategy
• Reduce capital allocated to run-off businesses by USD 1 billion
• Generate stable operational free cash flows of ~USD 1 billion
per annum
• Deliver expense savings of USD 150 million by 2018
• Achieve a return on capital of 9% by 2018
Life & Protection
Transamerica Business Services
Investments & Retirement
Corporate
Note: operational free cash flows excluding market impacts and one-time items
Management actions
Delivering results
11 11
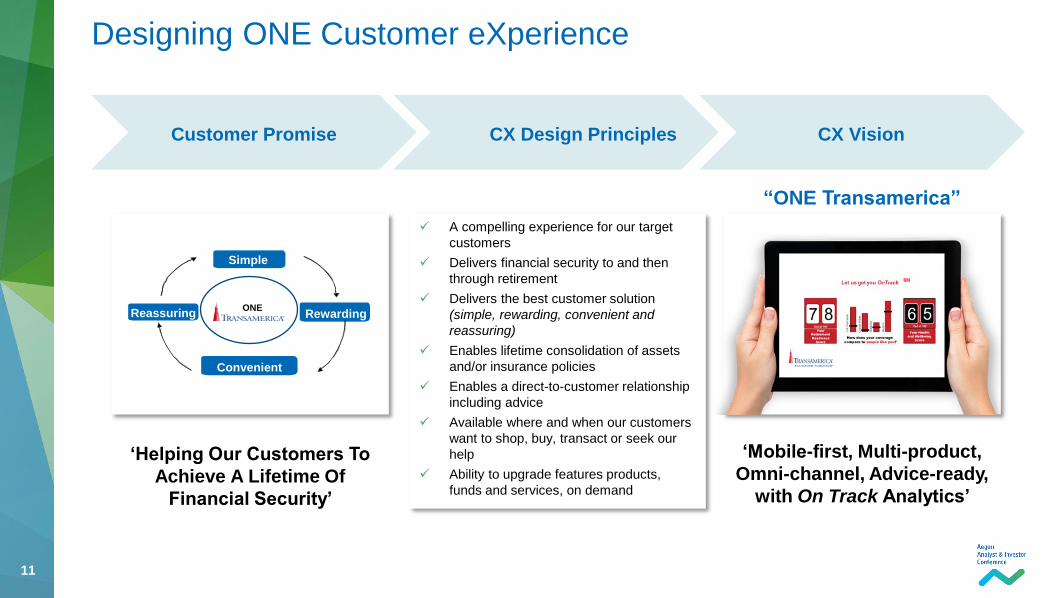
A compelling experience for our target
customers
Delivers financial security to and then
through retirement
Delivers the best customer solution
(simple, rewarding, convenient and
reassuring)
Enables lifetime consolidation of assets
and/or insurance policies
Enables a direct-to-customer relationship
including advice
Available where and when our customers
want to shop, buy, transact or seek our
help
Ability to upgrade features products,
funds and services, on demand
Designing ONE Customer eXperience
Customer Promise CX Design Principles CX Vision
‘Mobile-first, Multi-product,
Omni-channel, Advice-ready,
with On Track Analytics’
‘Helping Our Customers To
Achieve A Lifetime Of
Financial Security’
“ONE Transamerica”
Simple
Rewarding Reassuring
Convenient
ONE
12 12
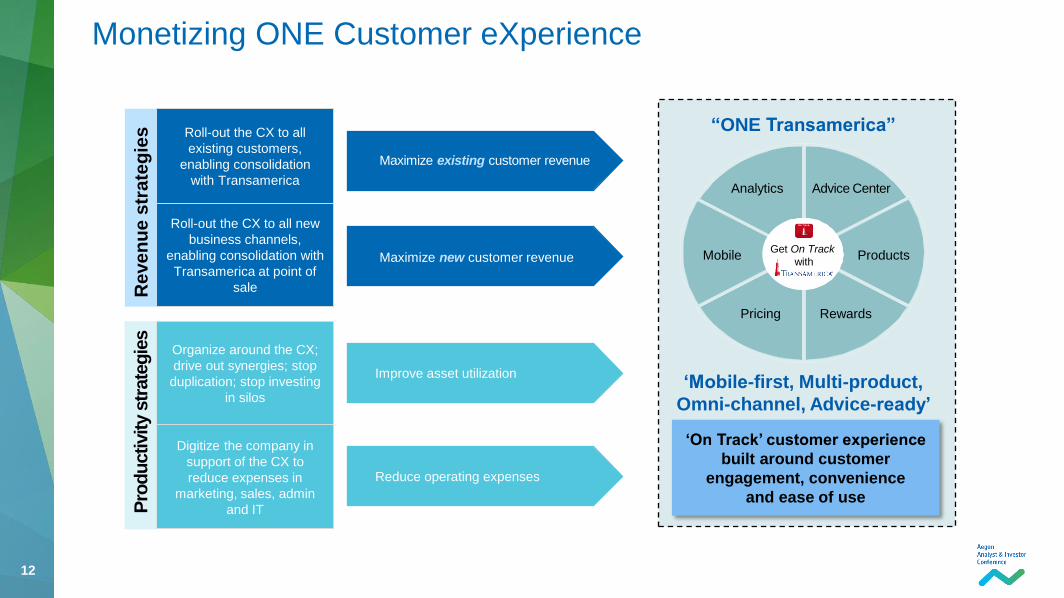
Monetizing ONE Customer eXperience
Roll-out the CX to all new
business channels,
enabling consolidation with
Transamerica at point of
sale
Maximize new customer revenue
Organize around the CX;
drive out synergies; stop
duplication; stop investing
in silos
Improve asset utilization
Roll-out the CX to all
existing customers,
enabling consolidation
with Transamerica
Maximize existing customer revenue
Re
ve
nu
e s
tra
teg
ies
Digitize the company in
support of the CX to
reduce expenses in
marketing, sales, admin
and IT
Reduce operating expenses
Pro
du
ctivity s
trate
gie
s
‘Mobile-first, Multi-product,
Omni-channel, Advice-ready’
“ONE Transamerica”
Advice Center
Products
Rewards Pricing
Mobile
Analytics
Get On Track
with
‘On Track’ customer experience
built around customer
engagement, convenience
and ease of use
13
Improving value through profitable sustainable growth of core businesses
14 14
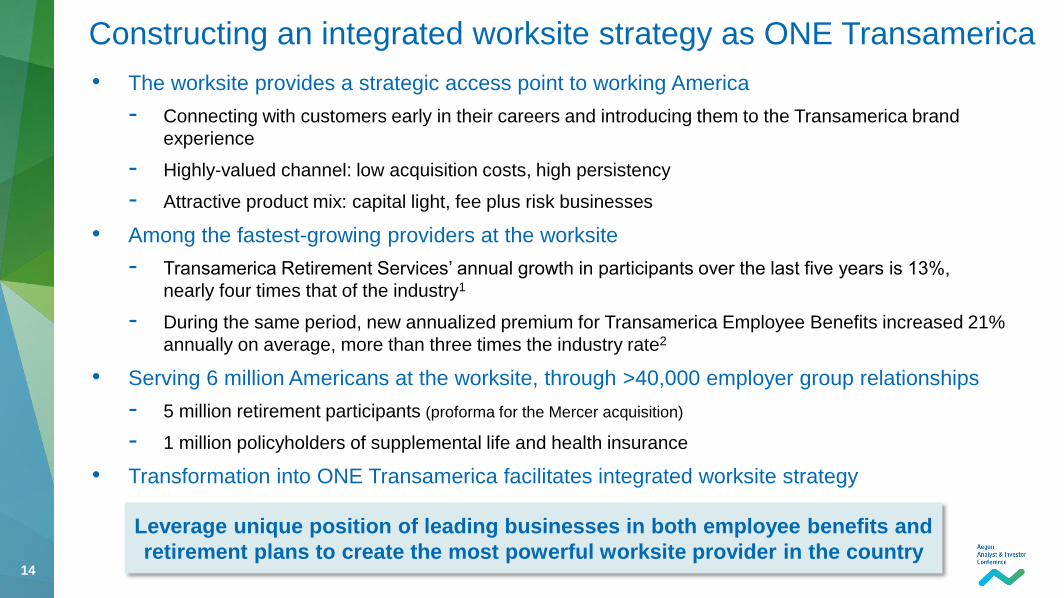
• The worksite provides a strategic access point to working America
- Connecting with customers early in their careers and introducing them to the Transamerica brand
experience
- Highly-valued channel: low acquisition costs, high persistency
- Attractive product mix: capital light, fee plus risk businesses
• Among the fastest-growing providers at the worksite
- Transamerica Retirement Services’ annual growth in participants over the last five years is 13%,
nearly four times that of the industry1
- During the same period, new annualized premium for Transamerica Employee Benefits increased 21%
annually on average, more than three times the industry rate2
• Serving 6 million Americans at the worksite, through >40,000 employer group relationships
- 5 million retirement participants (proforma for the Mercer acquisition)
- 1 million policyholders of supplemental life and health insurance
• Transformation into ONE Transamerica facilitates integrated worksite strategy
Constructing an integrated worksite strategy as ONE Transamerica
Leverage unique position of leading businesses in both employee benefits and
retirement plans to create the most powerful worksite provider in the country
15 15
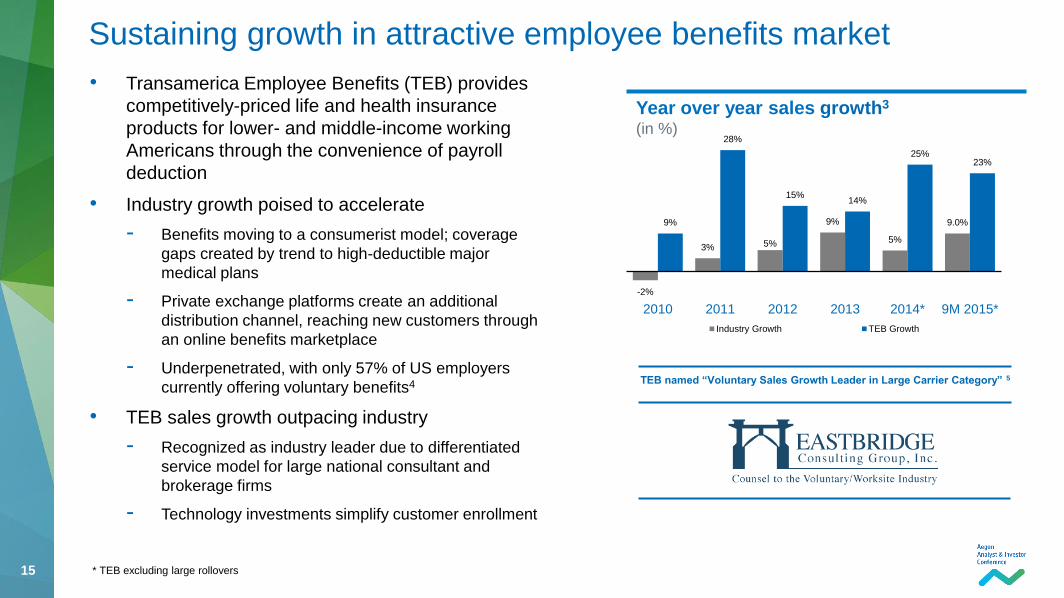
• Transamerica Employee Benefits (TEB) provides
competitively-priced life and health insurance
products for lower- and middle-income working
Americans through the convenience of payroll
deduction
• Industry growth poised to accelerate
- Benefits moving to a consumerist model; coverage
gaps created by trend to high-deductible major
medical plans
- Private exchange platforms create an additional
distribution channel, reaching new customers through
an online benefits marketplace
- Underpenetrated, with only 57% of US employers
currently offering voluntary benefits4
• TEB sales growth outpacing industry
- Recognized as industry leader due to differentiated
service model for large national consultant and
brokerage firms
- Technology investments simplify customer enrollment
Sustaining growth in attractive employee benefits market
Year over year sales growth3 (in %)
-2%
3% 5%
9%
5%
9.0% 9%
28%
15% 14%
25% 23%
2010 2011 2012 2013 2014* 9M 2015*
Industry Growth TEB Growth
* TEB excluding large rollovers
TEB named “Voluntary Sales Growth Leader in Large Carrier Category” 5
16 16
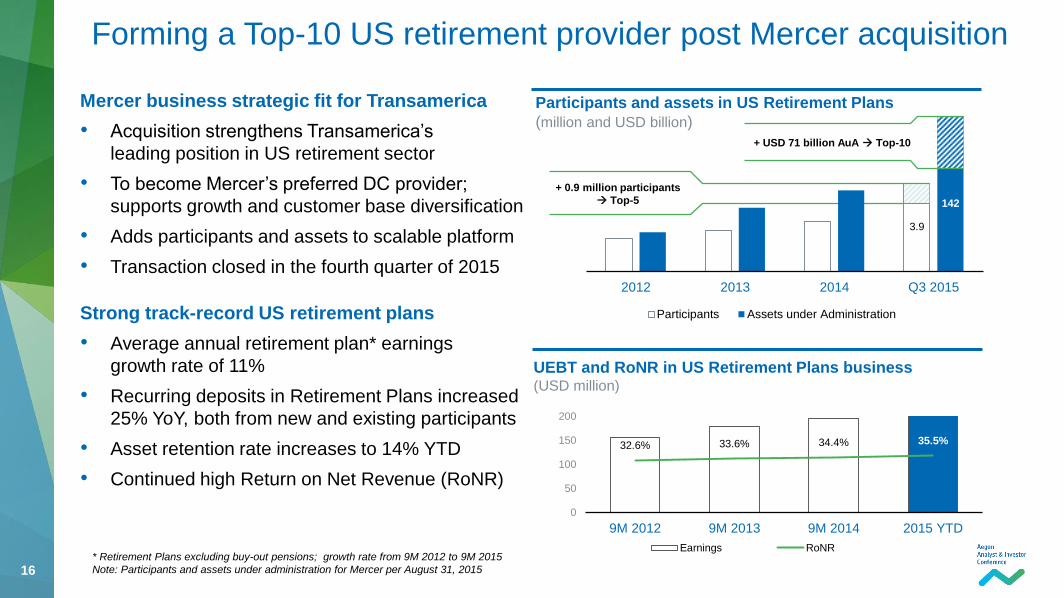
Participants and assets in US Retirement Plans
(million and USD billion)
Mercer business strategic fit for Transamerica
• Acquisition strengthens Transamerica’s
leading position in US retirement sector
• To become Mercer’s preferred DC provider;
supports growth and customer base diversification
• Adds participants and assets to scalable platform
• Transaction closed in the fourth quarter of 2015
Strong track-record US retirement plans
• Average annual retirement plan* earnings
growth rate of 11%
• Recurring deposits in Retirement Plans increased
25% YoY, both from new and existing participants
• Asset retention rate increases to 14% YTD
• Continued high Return on Net Revenue (RoNR)
Forming a Top-10 US retirement provider post Mercer acquisition
32.6% 33.6% 34.4% 35.5%
0
50
100
150
200
9M 2012 9M 2013 9M 2014 2015 YTD
Earnings RoNR
2012 2013 2014 Q3 2015
Participants Assets under Administration
3.9
142
+ 0.9 million participants
Top-5
+ USD 71 billion AuA Top-10
* Retirement Plans excluding buy-out pensions; growth rate from 9M 2012 to 9M 2015
Note: Participants and assets under administration for Mercer per August 31, 2015
UEBT and RoNR in US Retirement Plans business (USD million)
17 17
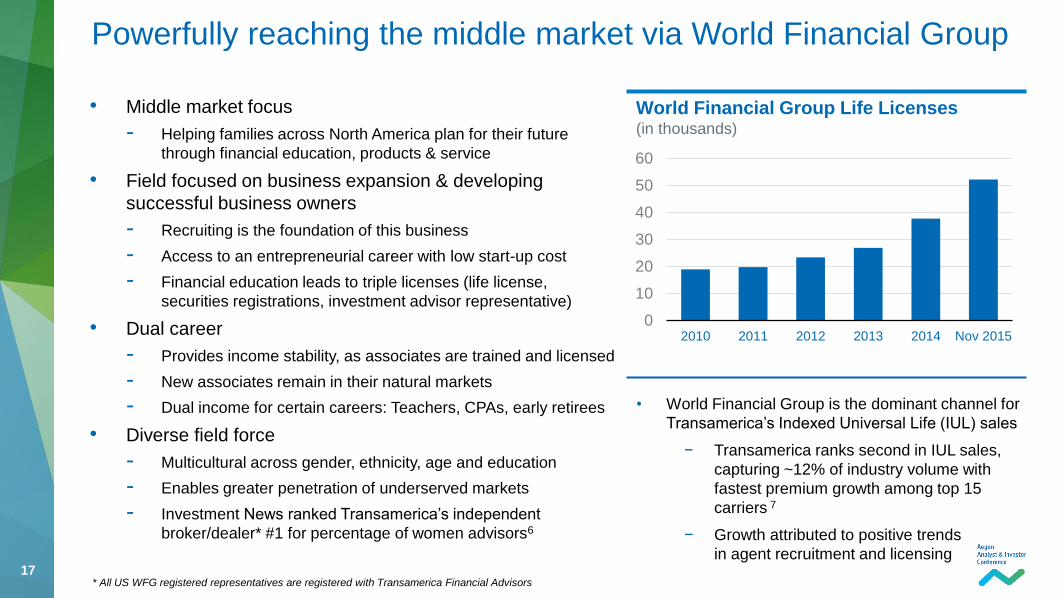
• Middle market focus
- Helping families across North America plan for their future
through financial education, products & service
• Field focused on business expansion & developing
successful business owners
- Recruiting is the foundation of this business
- Access to an entrepreneurial career with low start-up cost
- Financial education leads to triple licenses (life license,
securities registrations, investment advisor representative)
• Dual career
- Provides income stability, as associates are trained and licensed
- New associates remain in their natural markets
- Dual income for certain careers: Teachers, CPAs, early retirees
• Diverse field force
- Multicultural across gender, ethnicity, age and education
- Enables greater penetration of underserved markets
- Investment News ranked Transamerica’s independent
broker/dealer* #1 for percentage of women advisors6
Powerfully reaching the middle market via World Financial Group
World Financial Group Life Licenses (in thousands)
0
10
20
30
40
50
60
2010 2011 2012 2013 2014 Nov 2015
* All US WFG registered representatives are registered with Transamerica Financial Advisors
• World Financial Group is the dominant channel for
Transamerica’s Indexed Universal Life (IUL) sales
− Transamerica ranks second in IUL sales,
capturing ~12% of industry volume with
fastest premium growth among top 15
carriers 7
− Growth attributed to positive trends
in agent recruitment and licensing
18 18
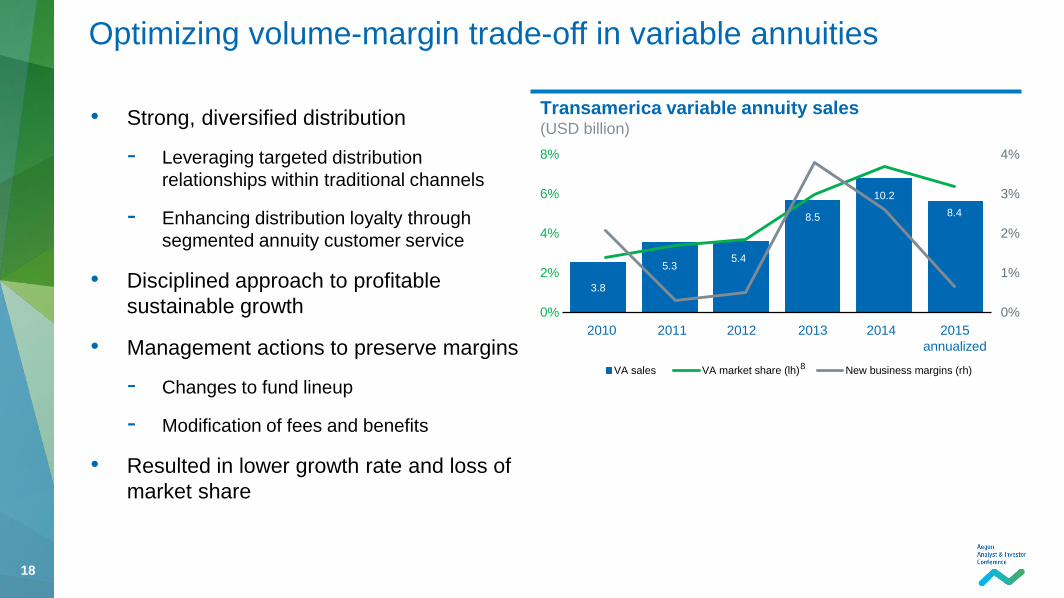
3.8
5.3 5.4
8.5
10.2
8.4
VA sales
0%
1%
2%
3%
4%
0%
2%
4%
6%
8%
VA market share (lh) New business margins (rh)
Transamerica variable annuity sales (USD billion)
• Strong, diversified distribution
- Leveraging targeted distribution
relationships within traditional channels
- Enhancing distribution loyalty through
segmented annuity customer service
• Disciplined approach to profitable
sustainable growth
• Management actions to preserve margins
- Changes to fund lineup
- Modification of fees and benefits
• Resulted in lower growth rate and loss of
market share
Optimizing volume-margin trade-off in variable annuities
2010 2011 2012 2013 2014 2015
annualized
8
19 19
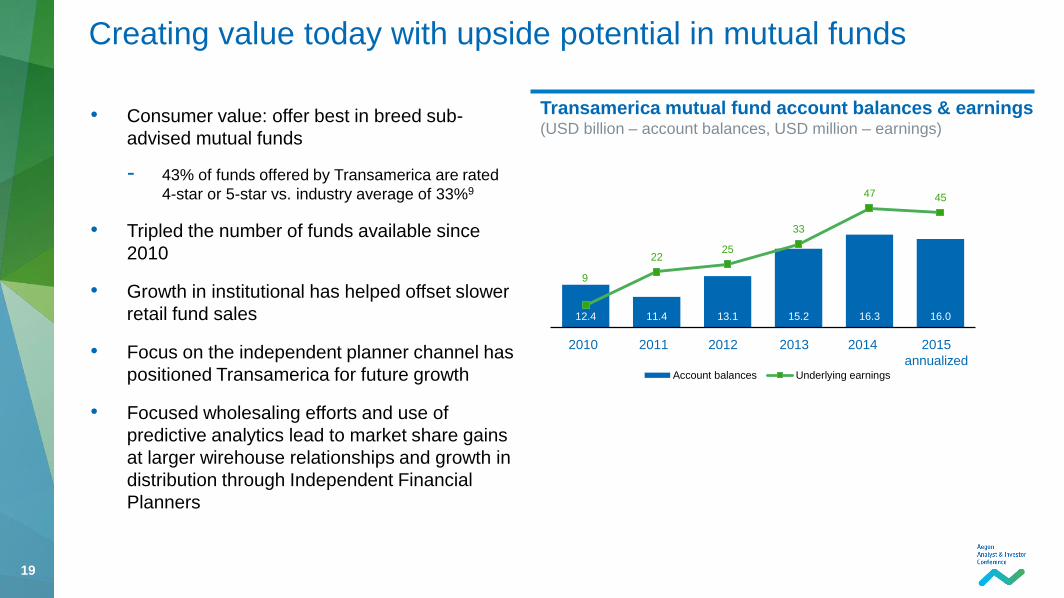
12.4 11.4 13.1 15.2 16.3 16.0
9
22 25
33
47 45
9
12
15
18
Account balances Underlying earnings
• Consumer value: offer best in breed sub-
advised mutual funds
- 43% of funds offered by Transamerica are rated
4-star or 5-star vs. industry average of 33%9
• Tripled the number of funds available since
2010
• Growth in institutional has helped offset slower
retail fund sales
• Focus on the independent planner channel has
positioned Transamerica for future growth
• Focused wholesaling efforts and use of
predictive analytics lead to market share gains
at larger wirehouse relationships and growth in
distribution through Independent Financial
Planners
Creating value today with upside potential in mutual funds
2010 2011 2012 2013 2014 2015
annualized
Transamerica mutual fund account balances & earnings (USD billion – account balances, USD million – earnings)

20
Key deliverables
21 21
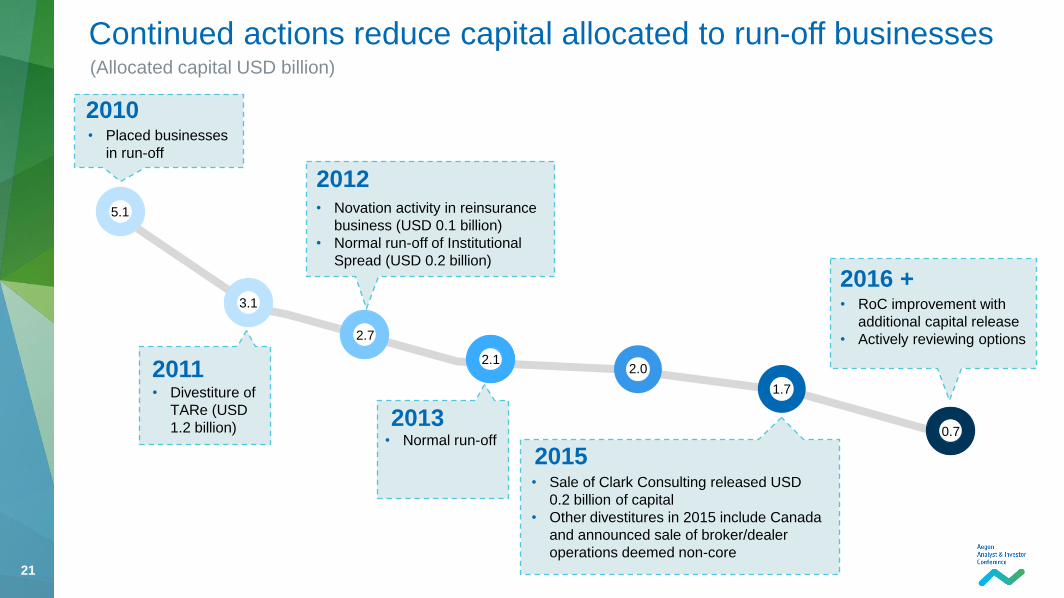
• Divestiture of
TARe (USD
1.2 billion)
2011
Continued actions reduce capital allocated to run-off businesses
2.7
2.1 2.0
(Allocated capital USD billion)
2012 • Novation activity in reinsurance
business (USD 0.1 billion)
• Normal run-off of Institutional
Spread (USD 0.2 billion)
2010 • Placed businesses
in run-off
2013 • Normal run-off
5.1
3.1
2015 • Sale of Clark Consulting released USD
0.2 billion of capital
• Other divestitures in 2015 include Canada
and announced sale of broker/dealer
operations deemed non-core
2016 + • RoC improvement with
additional capital release
• Actively reviewing options
1.7
0.7
22 22
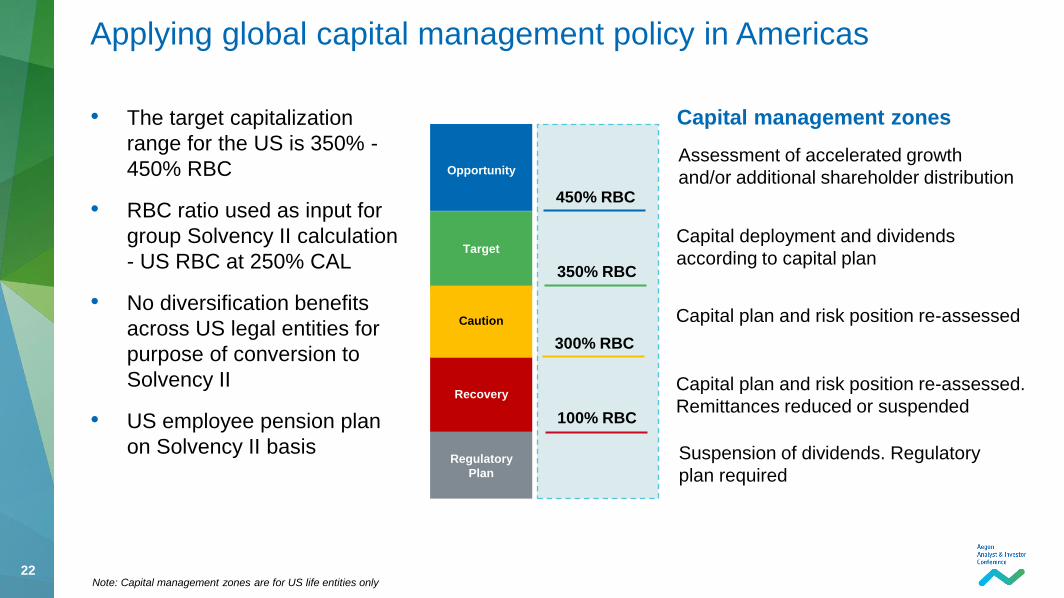
Applying global capital management policy in Americas
• The target capitalization
range for the US is 350% -
450% RBC
• RBC ratio used as input for
group Solvency II calculation
- US RBC at 250% CAL
• No diversification benefits
across US legal entities for
purpose of conversion to
Solvency II
• US employee pension plan
on Solvency II basis
Recovery
Opportunity
Regulatory
Plan
Caution
Target
Assessment of accelerated growth
and/or additional shareholder distribution
Capital deployment and dividends
according to capital plan
Capital plan and risk position re-assessed
Capital plan and risk position re-assessed.
Remittances reduced or suspended
Suspension of dividends. Regulatory
plan required
Capital management zones
100% RBC
450% RBC
350% RBC
300% RBC
Note: Capital management zones are for US life entities only
23 23
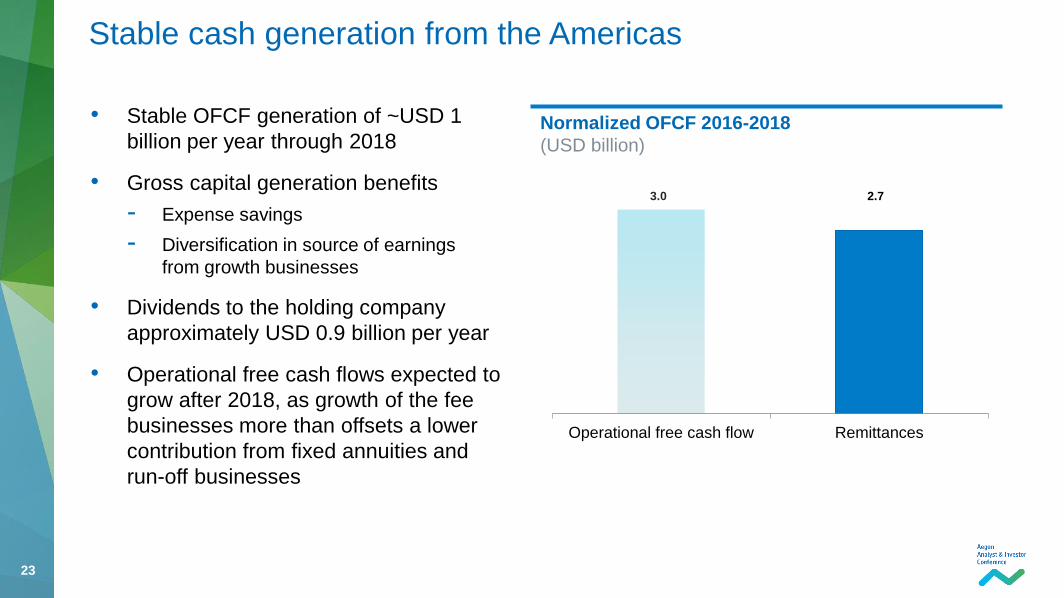
• Stable OFCF generation of ~USD 1
billion per year through 2018
• Gross capital generation benefits
- Expense savings
- Diversification in source of earnings
from growth businesses
• Dividends to the holding company
approximately USD 0.9 billion per year
• Operational free cash flows expected to
grow after 2018, as growth of the fee
businesses more than offsets a lower
contribution from fixed annuities and
run-off businesses
Stable cash generation from the Americas
Normalized OFCF 2016-2018
(USD billion)
Operational free cash flow Remittances
3.0 2.7
24 24
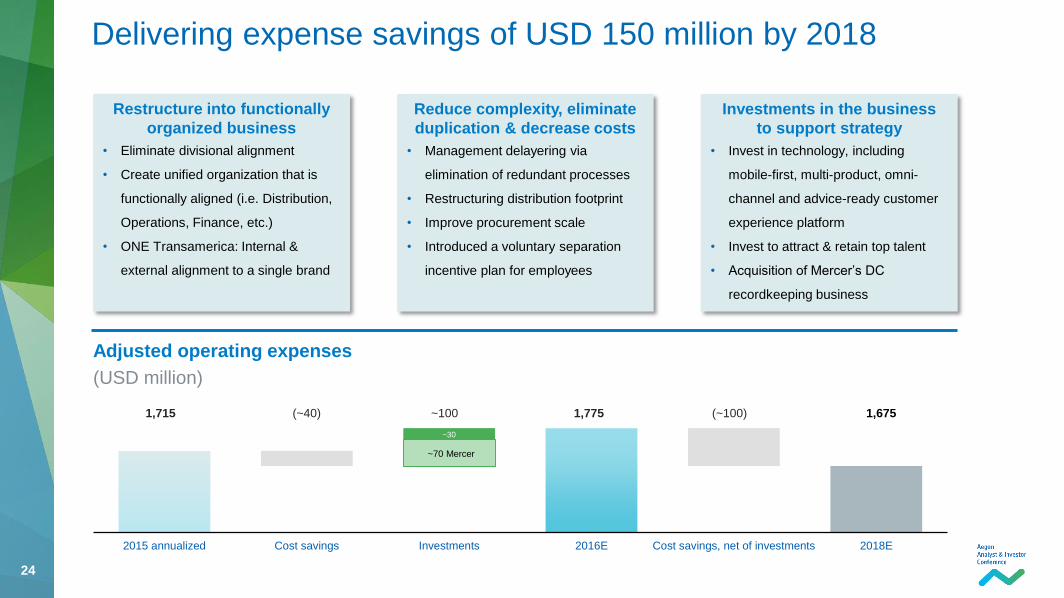
1,715 (~40) ~100 1,775 (~100) 1,675
Delivering expense savings of USD 150 million by 2018
~30
2015 annualized Cost savings Investments 2016E Cost savings, net of investments 2018E
Adjusted operating expenses
(USD million)
Restructure into functionally
organized business
• Eliminate divisional alignment
• Create unified organization that is
functionally aligned (i.e. Distribution,
Operations, Finance, etc.)
• ONE Transamerica: Internal &
external alignment to a single brand
Reduce complexity, eliminate
duplication & decrease costs
• Management delayering via
elimination of redundant processes
• Restructuring distribution footprint
• Improve procurement scale
• Introduced a voluntary separation
incentive plan for employees
Investments in the business
to support strategy
• Invest in technology, including
mobile-first, multi-product, omni-
channel and advice-ready customer
experience platform
• Invest to attract & retain top talent
• Acquisition of Mercer’s DC
recordkeeping business
~70 Mercer
25 25
Q3 2015(annualized)
Assumption changes,one-time items, tax,accounting change
2015 Adjusted Cost savings Investments Organic growth 2018E
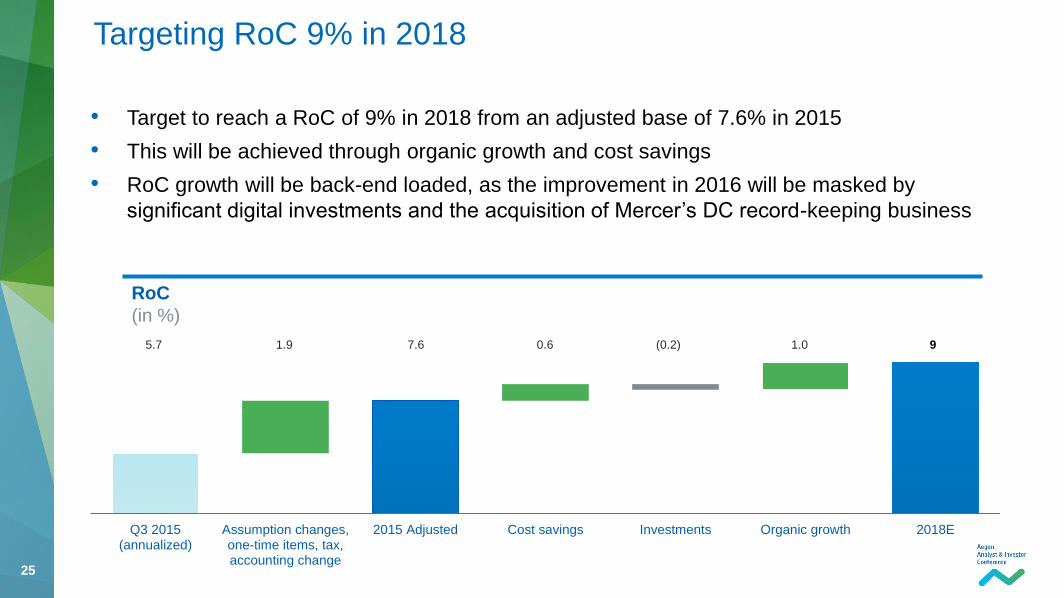
• Target to reach a RoC of 9% in 2018 from an adjusted base of 7.6% in 2015
• This will be achieved through organic growth and cost savings
• RoC growth will be back-end loaded, as the improvement in 2016 will be masked by
significant digital investments and the acquisition of Mercer’s DC record-keeping business
Targeting RoC 9% in 2018
RoC
(in %)
5.7 1.9 7.6 0.6 (0.2) 1.0 9
26 26
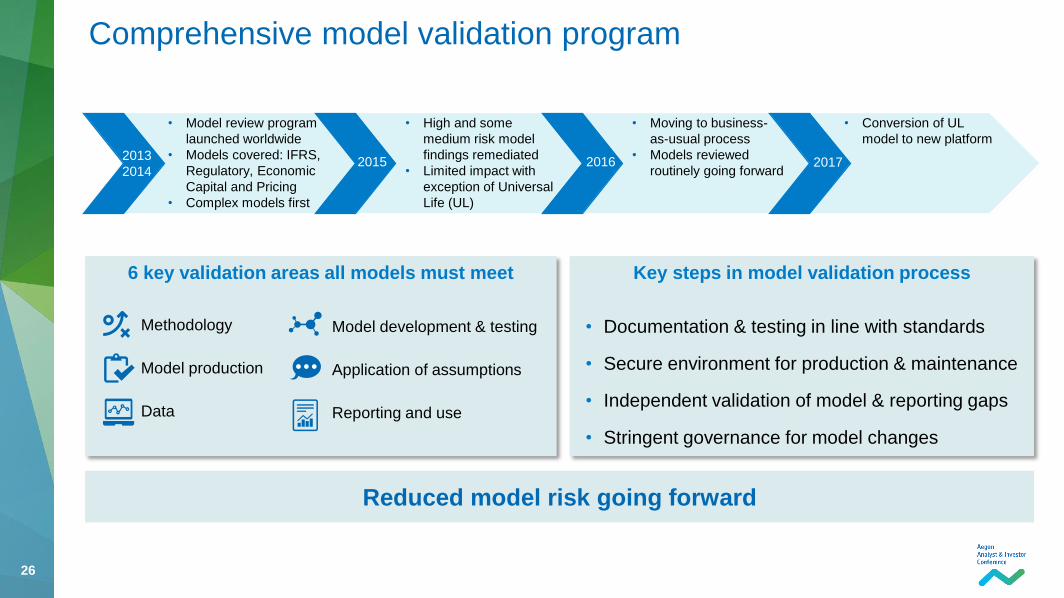
Comprehensive model validation program
2013
2014 2015 2016 2017
6 key validation areas all models must meet
Methodology
Model production
Data
• Model review program
launched worldwide
• Models covered: IFRS,
Regulatory, Economic
Capital and Pricing
• Complex models first
• High and some
medium risk model
findings remediated
• Limited impact with
exception of Universal
Life (UL)
• Moving to business-
as-usual process
• Models reviewed
routinely going forward
• Conversion of UL
model to new platform
Model development & testing
Application of assumptions
Reporting and use
Reduced model risk going forward
Key steps in model validation process
• Documentation & testing in line with standards
• Secure environment for production & maintenance
• Independent validation of model & reporting gaps
• Stringent governance for model changes
27 27
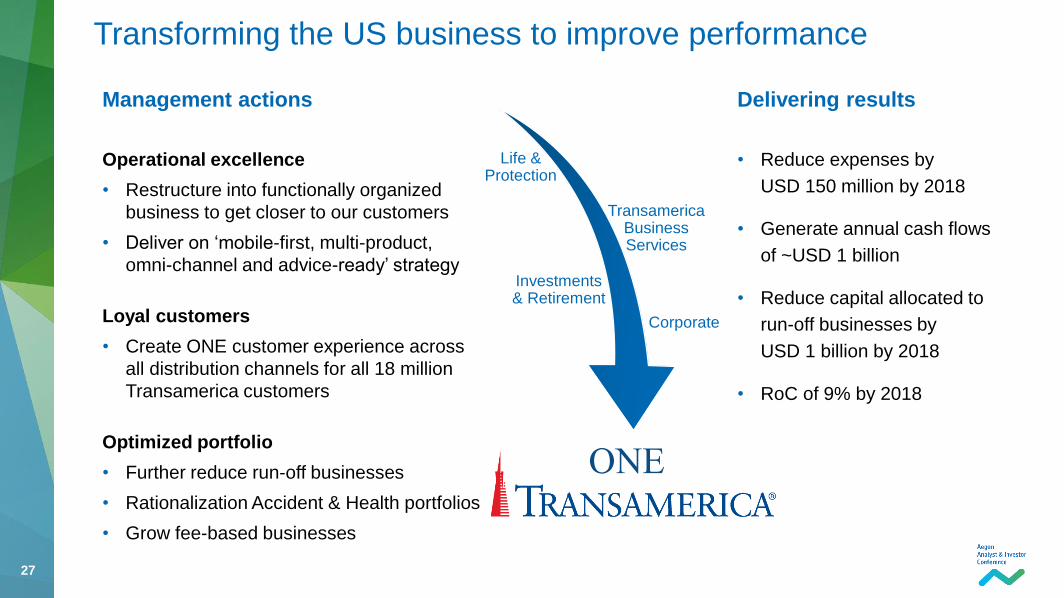
Transforming the US business to improve performance
• Reduce expenses by
USD 150 million by 2018
• Generate annual cash flows
of ~USD 1 billion
• Reduce capital allocated to
run-off businesses by
USD 1 billion by 2018
• RoC of 9% by 2018
Operational excellence
• Restructure into functionally organized
business to get closer to our customers
• Deliver on ‘mobile-first, multi-product,
omni-channel and advice-ready’ strategy
Loyal customers
• Create ONE customer experience across
all distribution channels for all 18 million
Transamerica customers
Optimized portfolio
• Further reduce run-off businesses
• Rationalization Accident & Health portfolios
• Grow fee-based businesses
Delivering results Management actions
ONE
Life & Protection
Transamerica Business Services
Investments & Retirement
Corporate

28
Appendix
29 29
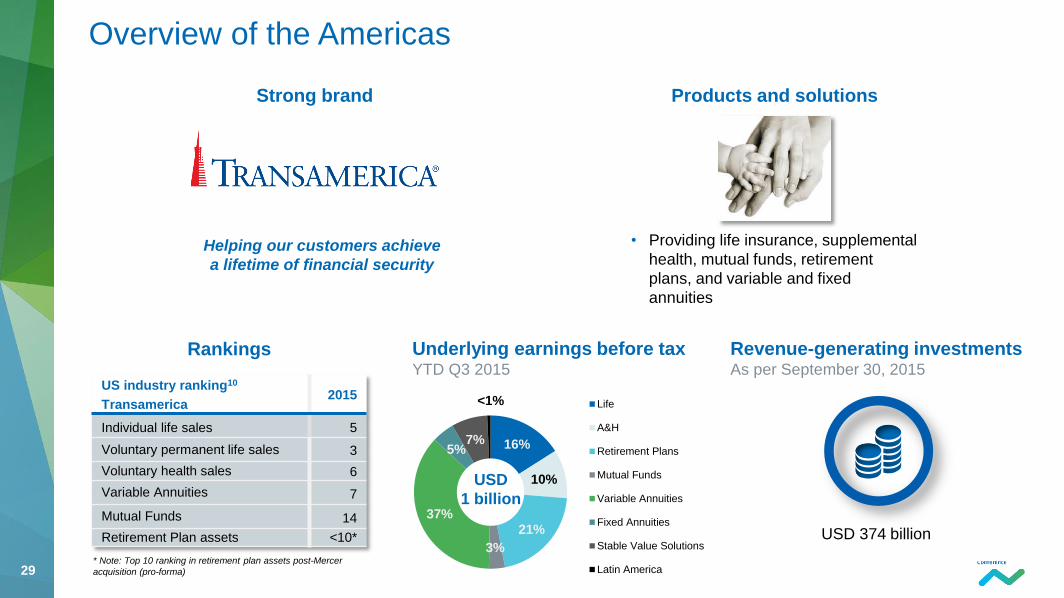
Overview of the Americas
Helping our customers achieve
a lifetime of financial security
• Providing life insurance, supplemental
health, mutual funds, retirement
plans, and variable and fixed
annuities
Products and solutions
Rankings
US industry ranking10
Transamerica 2015
Individual life sales 5
Voluntary permanent life sales 3
Voluntary health sales 6
Variable Annuities 7
Mutual Funds 14
Retirement Plan assets <10*
* Note: Top 10 ranking in retirement plan assets post-Mercer
acquisition (pro-forma)
Underlying earnings before tax YTD Q3 2015
Revenue-generating investments As per September 30, 2015
USD 374 billion
16%
10%
21%
3%
37%
5% 7%
<1% Life
A&H
Retirement Plans
Mutual Funds
Variable Annuities
Fixed Annuities
Stable Value Solutions
Latin America
USD
1 billion
Strong brand
30 30
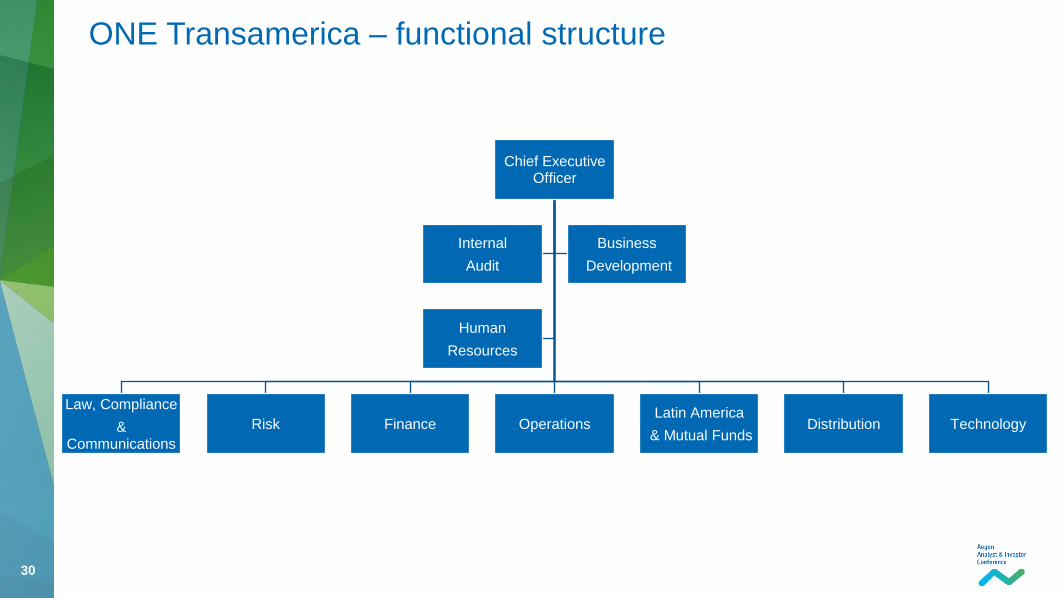
Chief Executive Officer
Law, Compliance
& Communications
Risk Finance Operations Latin America
& Mutual Funds Distribution Technology
Internal
Audit
Business
Development
Human
Resources
ONE Transamerica – functional structure
31 31
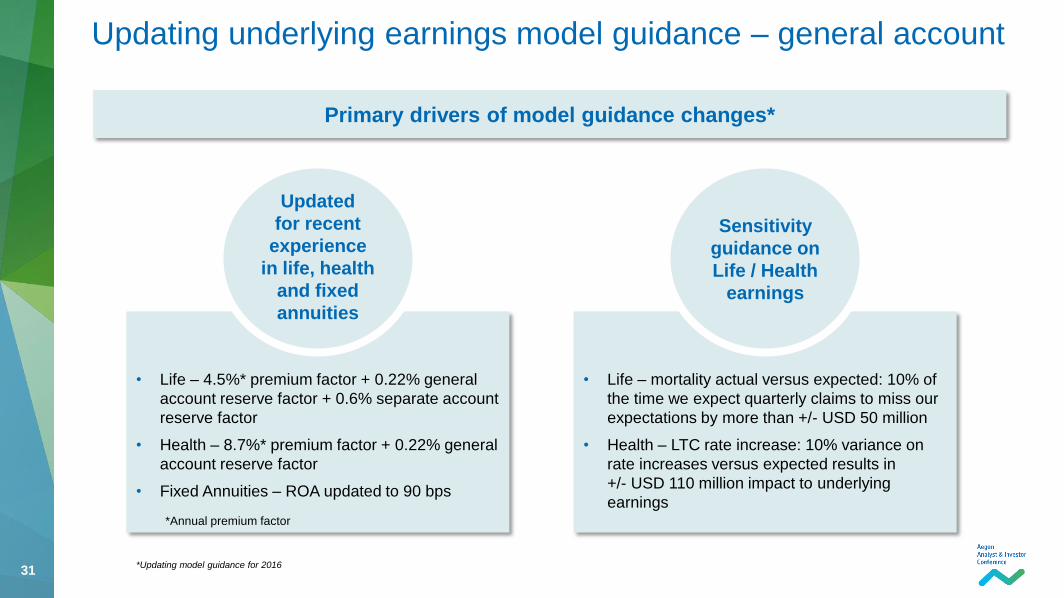
Updating underlying earnings model guidance – general account
Primary drivers of model guidance changes*
Updated
for recent
experience
in life, health
and fixed
annuities
• Life – 4.5%* premium factor + 0.22% general
account reserve factor + 0.6% separate account
reserve factor
• Health – 8.7%* premium factor + 0.22% general
account reserve factor
• Fixed Annuities – ROA updated to 90 bps
*Annual premium factor
*Updating model guidance for 2016
Sensitivity
guidance on
Life / Health
earnings
• Life – mortality actual versus expected: 10% of
the time we expect quarterly claims to miss our
expectations by more than +/- USD 50 million
• Health – LTC rate increase: 10% variance on
rate increases versus expected results in
+/- USD 110 million impact to underlying
earnings
32 32
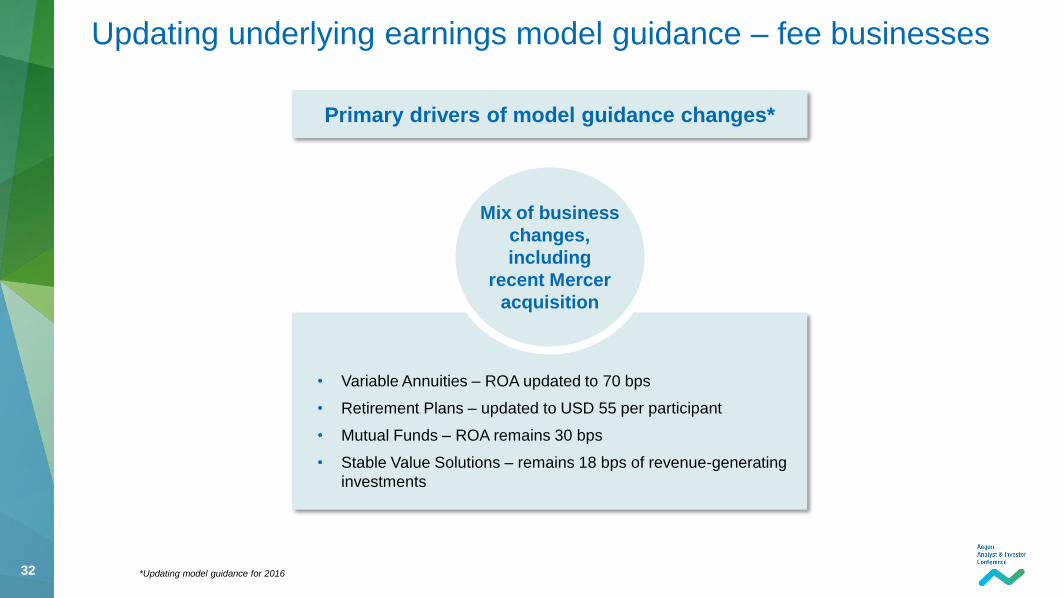
Updating underlying earnings model guidance – fee businesses
Primary drivers of model guidance changes*
Mix of business
changes,
including
recent Mercer
acquisition
• Variable Annuities – ROA updated to 70 bps
• Retirement Plans – updated to USD 55 per participant
• Mutual Funds – ROA remains 30 bps
• Stable Value Solutions – remains 18 bps of revenue-generating
investments
*Updating model guidance for 2016
33 33
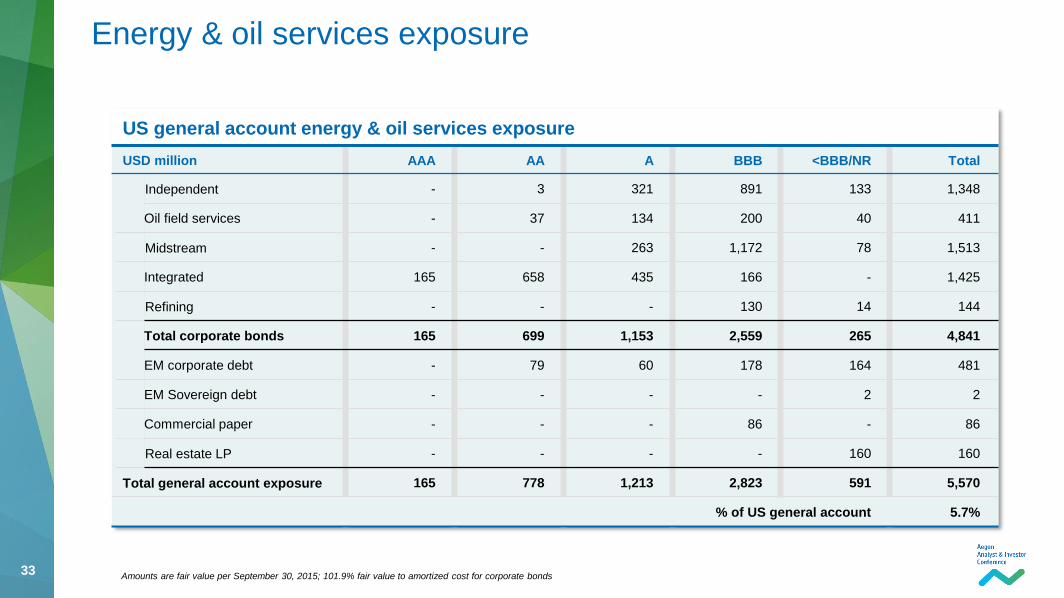
US general account energy & oil services exposure
USD million AAA AA A BBB <BBB/NR Total
Independent - 3 321 891 133 1,348
Oil field services - 37 134 200 40 411
Midstream - - 263 1,172 78 1,513
Integrated 165 658 435 166 - 1,425
Refining - - - 130 14 144
Total corporate bonds 165 699 1,153 2,559 265 4,841
EM corporate debt - 79 60 178 164 481
EM Sovereign debt - - - - 2 2
Commercial paper - - - 86 - 86
Real estate LP - - - - 160 160
Total general account exposure 165 778 1,213 2,823 591 5,570
% of US general account 5.7%
Amounts are fair value per September 30, 2015; 101.9% fair value to amortized cost for corporate bonds
Energy & oil services exposure
34 34
1. Chatham Partners; through 2014
2. LIMRA
3. LIMRA US Worksite Sales Survey Reports; 2014 Industry sales growth is based on Q3 YTD reporting
4. LIMRA Voluntary Worksite Benefits: Penetration and Market Potential 2013
5. U.S. Worksite/Voluntary Sales Report based on 2014 sales; conducted by Eastbridge Consulting Group, Inc.
6. Investment News, April 29, 2015
7. LIMRA, market share of 9M2015 standardized life premium
8. Market share source: Morningstar (VARDS)
9. Morningstar, November 2015
10. Industry ranking source: LIMRA (life, voluntary health-3Q2015), Morningstar (VA-3Q2015), Strategic Insights, based on
assets by sub-advisor firms (MF-3Q2015), Chatham Partners, Plan Sponsor Magazine Recordkeeping Survey, CFO
Buyers Guide, Pensions and Investments (12/31/2014)
Footnotes

Analyst & Investor Conference 2016, January, London
For questions please contact Investor Relations
+31 70 344 8305
P.O. Box 85
2501 CB The Hague
The Netherlands
36 36
Cautionary note regarding non-IFRS measures
This document includes the following non-IFRS financial measures: underlying earnings before tax, income tax and income before tax. These non-IFRS measures are calculated by consolidating on a proportionate basis Aegon’s joint ventures and associated
companies. The reconciliation of these measures to the most comparable IFRS measure is provided in note 3 ‘Segment information’ of Aegon’s Condensed Consolidated Interim Financial Statements. Aegon believes that these non-IFRS measures, together
with the IFRS information, provide meaningful information about the underlying operating results of Aegon’s business including insight into the financial measures that senior management uses in managing the business.
Currency exchange rates
This document contains certain information about Aegon’s results , financial condition and revenue generating investments presented in USD for the Americas and GBP for the United Kingdom, because those businesses operate and are managed primarily in
those currencies. None of this information is a substitute for or superior to financial information about Aegon presented in EUR, which is the currency of Aegon’s primary financial statements.
Forward-looking statements
The statements contained in this document that are not historical facts are forward-looking statements as defined in the US Private Securities Litigation Reform Act of 1995. The following are words that identify such forward-looking statements: aim, believe,
estimate, target, intend, may, expect, anticipate, predict, project, counting on, plan, continue, want, forecast, goal, should, would, is confident, will, and similar expressions as they relate to Aegon. These statements are not guarantees of future performance and
involve risks, uncertainties and assumptions that are difficult to predict. Aegon undertakes no obligation to publicly update or revise any forward-looking statements. Readers are cautioned not to place undue reliance on these forward-looking statements, which
merely reflect company expectations at the time of writing. Actual results may differ materially from expectations conveyed in forward-looking statements due to changes caused by various risks and uncertainties. Such risks and uncertainties include but are not
limited to the following:
• Changes in general economic conditions, particularly in the United States, the Netherlands and the United Kingdom;
• Changes in the performance of financial markets, including emerging markets, such as with regard to:
- The frequency and severity of defaults by issuers in Aegon’s fixed income investment portfolios;
- The effects of corporate bankruptcies and/or accounting restatements on the financial markets and the resulting decline in the value of equity and debt securities Aegon holds; and
- The effects of declining creditworthiness of certain private sector securities and the resulting decline in the value of sovereign exposure that Aegon holds;
• Changes in the performance of Aegon’s investment portfolio and decline in ratings of Aegon’s counterparties;
• Consequences of a potential (partial) break-up of the euro or the potential exit of the United Kingdom from the European Union;
• The frequency and severity of insured loss events;
• Changes affecting longevity, mortality, morbidity, persistence and other factors that may impact the profitability of Aegon’s insurance products;
• Reinsurers to whom Aegon has ceded significant underwriting risks may fail to meet their obligations;
• Changes affecting interest rate levels and continuing low or rapidly changing interest rate levels;
• Changes affecting currency exchange rates, in particular the EUR/USD and EUR/GBP exchange rates;
• Changes in the availability of, and costs associated with, liquidity sources such as bank and capital markets funding, as wel l as conditions in the credit markets in general such as changes in borrower and counterparty creditworthiness;
• Increasing levels of competition in the United States, the Netherlands, the United Kingdom and emerging markets;
• Changes in laws and regulations, particularly those affecting Aegon’s operations’ ability to hire and retain key personnel, the products Aegon sells, and the attractiveness of certain products to its consumers;
• Regulatory changes relating to the pensions, investment, and insurance industries in the jurisdictions in which Aegon operates;
• Standard setting initiatives of supranational standard setting bodies such as the Financial Stability Board and the International Association of Insurance Supervisors or changes to such standards that may have an impact on regional (such as EU), national
or US federal or state level financial regulation or the application thereof to Aegon, including the designation of Aegon by the Financial Stability Board as a Global Systemically Important Insurer (G-SII).
• Changes in customer behavior and public opinion in general related to, among other things, the type of products also Aegon sells, including legal, regulatory or commercial necessity to meet changing customer expectations;
• Acts of God, acts of terrorism, acts of war and pandemics;
• Changes in the policies of central banks and/or governments;
• Lowering of one or more of Aegon’s debt ratings issued by recognized rating organizations and the adverse impact such action may have on Aegon’s ability to raise capital and on its liquidity and financial condition;
• Lowering of one or more of insurer financial strength ratings of Aegon’s insurance subsidiaries and the adverse impact such action may have on the premium writings, policy retention, profitability and liquidity of its insurance subsidiaries;
• The effect of the European Union’s Solvency II requirements and other regulations in other jurisdictions affecting the capita l Aegon is required to maintain;
• Litigation or regulatory action that could require Aegon to pay significant damages or change the way Aegon does business;
• As Aegon’s operations support complex transactions and are highly dependent on the proper functioning of information technology, a computer system failure or security breach may disrupt Aegon’s business, damage its reputation and adversely affect its
results of operations, financial condition and cash flows;
• Customer responsiveness to both new products and distribution channels;
• Competitive, legal, regulatory, or tax changes that affect profitability, the distribution cost of or demand for Aegon’s products;
• Changes in accounting regulations and policies or a change by Aegon in applying such regulations and policies, voluntarily or otherwise, which may affect Aegon’s reported results and shareholders’ equity;
• The impact of acquisitions and divestitures, restructurings, product withdrawals and other unusual items, including Aegon’s ability to integrate acquisitions and to obtain the anticipated results and synergies from acquisitions;
• Catastrophic events, either manmade or by nature, could result in material losses and significantly interrupt Aegon’s business; and
• Aegon’s failure to achieve anticipated levels of earnings or operational efficiencies as well as other cost saving and excess capital and leverage ratio management initiatives.
Further details of potential risks and uncertainties affecting Aegon are described in its filings with the Netherlands Authority for the Financial Markets and the US Securities and Exchange Commission, including the Annual Report. These forward-looking
statements speak only as of the date of this document. Except as required by any applicable law or regulation, Aegon expressly disclaims any obligation or undertaking to release publicly any updates or revisions to any forward-looking statements contained
herein to reflect any change in Aegon’s expectations with regard thereto or any change in events, conditions or circumstances on which any such statement is based.
Disclaimer