Embed Size (px)
Citation preview

Financial results for 2015
Warsaw, 21 March 2016

2
2015 — executive summaryFinancial results for 2015
+46.4%EBITDA (Adj.) growth
Continued optimisation activities and consistent execution of a strategy based on organic growth
Beneficial external environment
Significant decrease in financing costs
22.9%EBITDA (Adj.) margin
+7.1 p.p.EBITDA (Adj.) margin growth
EBITDA (Adj.) – adjusted EBITDA (see the appendix for one-off adjustments), growth measured YoY
1. Market situation and major events
2. Financial results for 2015
3. Outlook for 2016

4
Beneficial external environmentMarket situation
0,88
0,9
0,92
0,94
0,96
0,98
1
2,80
3,20
3,60
4,00
4,40
4,80
USDPLN (L axis) EURPLN (L axis)Q1 2014 Q4 2015
Higher soda prices in Europe caused mainly by CIECH’s successful contracts
and a favourable market situation
Weaker PLN and RON increased export
revenue
Lower energy and raw material prices — beneficial contract
with Kompania Węglowa, lower market prices of gas and coke
14
18
22
26
1-month gas contacts [EUR/Mwh]Q1 2014 Q4 2015
40
50
60
70
80
90
Coal market prices — ARA Index [USD]Q1 2014 Q4 2015

5
Intensive commercial activityMajor events
Sale of additional volumes of soda ash and dry salt from expanded installations
Entry onto new markets
Increased efficiency in
CIECH Sarzynadistribution network, product
portfolio, Chwastox and Agrosar advertising campaigns
Optimisation of the CIECH Pianki
portfoliofocusing
on the highest margin contracts

6
Significant development investmentsMajor events
Q1 2015 Q1 2016 ~ Q2 2016
60,000tonnes
140,000tonnes
Full use of new capabilites
Soda +200 project
Modernised salt installationto intensify dry salt production
Investmementin higher sodium
silicate production power
thanks to a contractwith Solvay

7
Debt refinancingMajor events
Significant decrease in financing costs
It was: 9.5% per year Currently: <2% per year
Influence on Q4 2015 result
Coupon costs: PLN 73 million
Existing unamortized financing costs: PLN 25 million
Floating rates based on WIBOR/EURIBOR plus margin, which
depends on the net debt / EBITDA index
CIRS and IRS transactions for the whole loan amount
* At the end of 2014 ** At the end of 2015
Moody’s rating:
Ba3 / positive perspectiveStandard & Poor’s rating:
BB- / stable perspective
Dual currency loan in PLN and EUR (up to PLN 1.34million) and revolving loan (up to PLN 250 million)
Debt amount**: PLN 1.6 billion
High yield bonds, revolving credit up to PLN 100 million, other loan agreements
Debt amount*: PLN 1.2 billion

1. Market situation and major events
2. Financial results for 2015
3. Outlook for 2016

9
Increase in profits and margins on all levels Financial results for 2015
[PLN million] 2015 2014 YoY Q4 2015 Q4 2014 YoY
Revenue 3,273 3,244 0.9% 814 786 3.6%
Gross sales profit 874 681 28.3% 205 136 50.2%
Gross sales margin 26.7% 21.0% 5.7 p.p. 25.1% 17.3% 7.8 p.p.
EBIT 490 322 52.2% 109 91 20.0%
EBIT margin 15.0% 9.9% 5.1 p.p. 13.4% 11.6% 1.8 p.p.
EBITDA 708 526 34.4% 165 145 13.8%
EBITDA margin 21.6% 16.2% 5.4 p.p. 20.3% 18.5% 1.8 p.p.
Adjusted EBITDA 748 511 46.4% 169 95 77.9%
Adjusted EBITDA margin 22.9% 15.8% 7.1 p.p. 20.7% 12.1% 8.6 p.p.
Net result 346 166 108.0% 88 112 -21.3%
Net margin 10.6% 5.1% 5.5 p.p. 10.8% 14.2% -3.4 p.p.
Adjusted EBITDA – see the appendix for one-off adjustments
Soda trading (PLN 166 million)
Soda trading (approx. PLN 6.5 million)
10
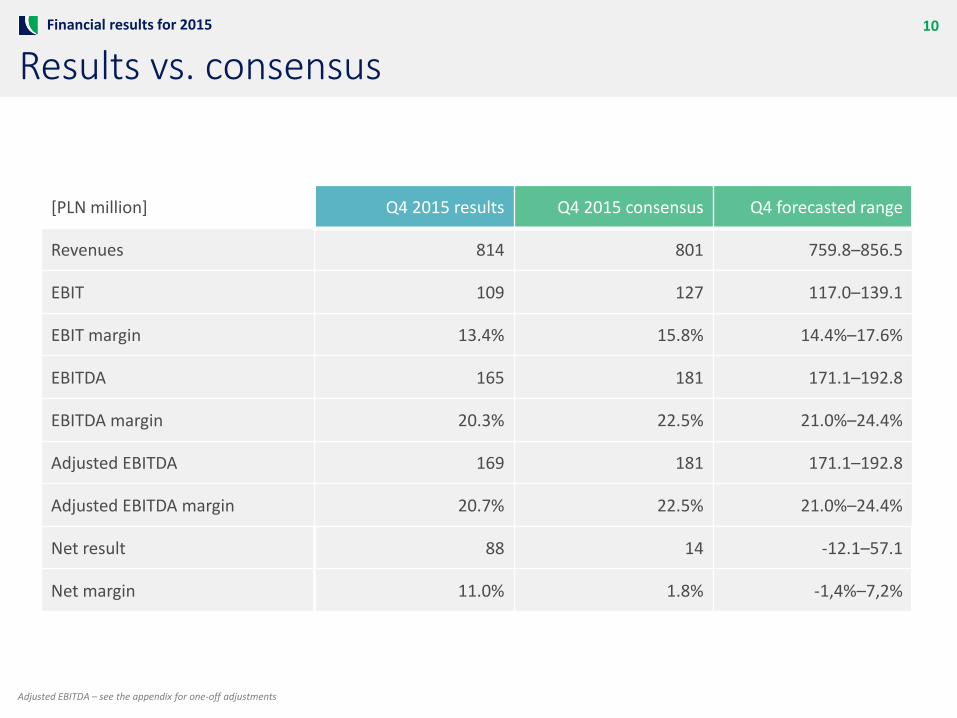
Results vs. consensusFinancial results for 2015
[PLN million] Q4 2015 results Q4 2015 consensus Q4 forecasted range
Revenues 814 801 759.8–856.5
EBIT 109 127 117.0–139.1
EBIT margin 13.4% 15.8% 14.4%–17.6%
EBITDA 165 181 171.1–192.8
EBITDA margin 20.3% 22.5% 21.0%–24.4%
Adjusted EBITDA 169 181 171.1–192.8
Adjusted EBITDA margin 20.7% 22.5% 21.0%–24.4%
Net result 88 14 -12.1–57.1
Net margin 11.0% 1.8% -1,4%–7,2%
Adjusted EBITDA – see the appendix for one-off adjustments

51% 55% 61% 66% 59% 62% 61%71% 66% 66% 72% 71%
33%
20% 21% 18% 27% 27%24%
19% 27% 25% 19% 22%
10%
9% 11% 10%
13% 10%12% 9%
5% 6%6%
5%
Q1 Q2 Q3 Q4 Q1 Q2 Q3 Q4 Q1 Q2 Q3 Q4
11
Stable revenueFinancial results for 2015
2013
Organic segment Glass and silicates segment Transport segment OtherSoda segment
2014 2015
993 889 823 795 845 814 799 786 817 841 801 814

12
EBITDA (Adj.) increaseFinancial results for 2015
75% 71%
88%124% 77%
82% 86%
101%
82% 84%
93%
92%
30% 22%
12%
6% 22%
15%11%
3%
17%9%
5%
15%
4% 7%
7%
6%
5%
7%7%
9%
4%
6%
5%
3%
Q1 Q2 Q3 Q4 Q1 Q2 Q3 Q4 Q1 Q2 Q3 Q4
2013
Organic segment Glass and silicates segment Transport segment OtherSoda segment
2014 2015
112 125 129 79 119 154 143 95 193 188 199 169
EBITDA (Adj.) – adjusted EBITDA (see the appendix for one-off adjustments)

13
Soda segmentFinancial results for 2015
+9.2%
Revenue [PLN million] Q1 Q2 Q3 Q4
499 536
504 557
490574
560574
2 0532,241
2014 2015
+50.5%
EBITDA (Adj.) [PLN million]
91158
126
158124
18595
155
436
656
2014 2015
Positive:
Higher soda prices on European markets, effective sales negotiations
Higher sales volume due to new production capabilities in Poland and Romania
Stronger USD and EUR, price competitiveness of European manufacturers compared to North American import
Lower prices of energy carriers (coal, gas) and fuels (coke, anthracite)
Increased soda production efficiency, lower energy and raw material consumption
Negative:
Lower demand for light soda among cleaning agent manufacturers
High supply and active competitors in the salt market
Lower electricity prices in Germany
Downturn in the Chinese soda market leading to a decrease in prices and greater activity of Chinese suppliers overseas, in markets where the Group operates
Production capabilities of the salt installation not utilised in full
Share in total revenue (main products)
Dense soda ash 38.7%
Light soda ash 13.3%
Salt 5.2%
Sodium bicarbonate 4.7%
EBITDA (Adj.) – adjusted EBITDA (see the appendix for one-off adjustments)

14
Organic segmentFinancial results for 2015
-1.82%
Revenue [PLN million] Q1 Q2 Q3 Q4
225 224
217 209
193154
149183
784 770
2014 2015
+25.1%
2633
2318
16 10
2468
85
2014 2015
Positive:
Very low oil prices (lower by approx. 30% YoY) resulting in low raw material prices
Epoxy resins — an increase in the sales volume, improved results by selling specialist products (maintaining a favourable ratio between product prices and raw material prices)
Unsaturated polyester resins — expanding sales of profitableproducts (gel coats and top coats)
PUR foams — optimisation of the client portfolio by focusing on high margin clients
AGRO products — successful preseason sales
Negative:
AGRO products — unfavourable weather conditions, dynamic activities of new distributors, less purchases done by farmers
Epoxy resins and unsaturated polyester resins — a decrease in raw material prices resulting in pressure on prices, continuing oversupply (flow of cheap resins from the Far East)
Unsaturated polyester resins — a decrease in the sales volume, intensified price competition due to the low use of capabilities by competitors.
Share in total revenue (main products)
Resins 10.5%
PUR foams 6.7%
Plant protection chemicals 5.9%
EBITDA (Adj.) [PLN million]
EBITDA (Adj.) – adjusted EBITDA (see the appendix for one-off adjustments)

15
Silicates and glass segmentFinancial results for 2015
-50.08%
Revenue [PLN million] Q1 Q2 Q3 Q4
107
37
84
50
93
51
67
38
351
175
2014 2015
-7.47%
6 7
11 10
11 11
8 5
3633
2014 2015
Positive:
Packaging glass — good sales results
Improved production efficiency (lower gas consumption, lower number of production losses)
Negative:
No trading sales of sulphur (supply contract with Grupa Azoty hasended)
Lower sales of potassium silicates
Higher competition on the domestic glass packaging market
Share in total revenue (main products)
Glass blocks and packaging 2.6%
Sodium silicate cullets 1.6%
Sodium water glass 0.9%
After adjusting for soda trading in 2014:
Revenue: PLN 166 million
EBITDA: approx. PLN 6.5 million
185 175
2014 2015
30 33
2014 2015
-5.4% +11.9%
Revenue [PLN million] EBITDA [PLN million]
EBITDA (Adj.) [PLN million]
EBITDA (Adj.) – adjusted EBITDA (see the appendix for one-off adjustments)
16
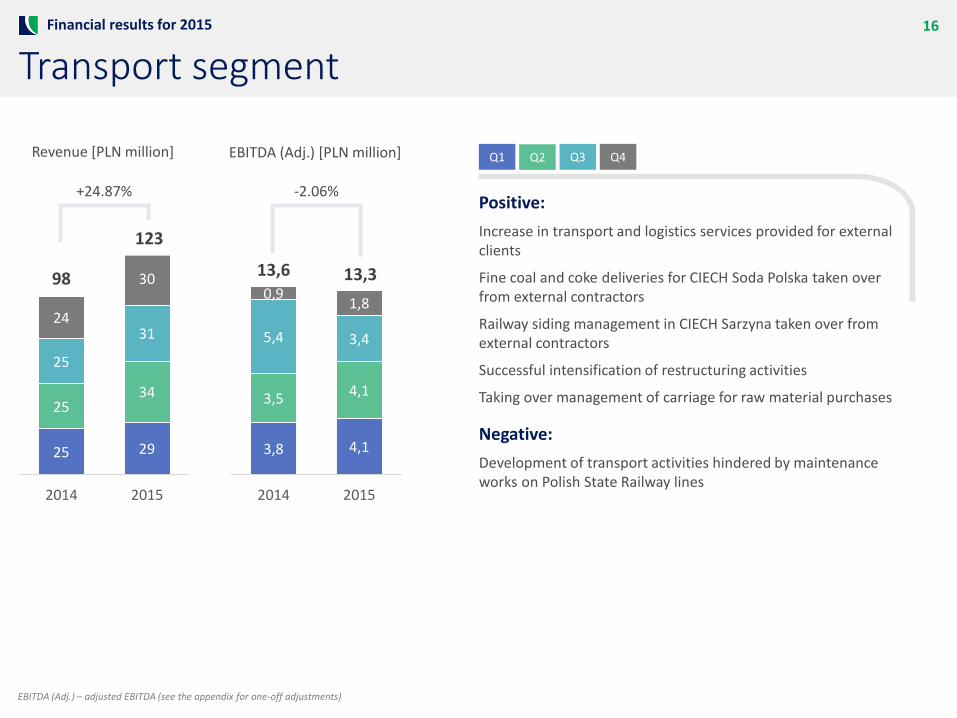
Transport segmentFinancial results for 2015
+24.87%
Revenue [PLN million] Q1 Q2 Q3 Q4
25 29
2534
25
3124
3098
123
2014 2015
-2.06%
3,8 4,1
3,5 4,1
5,4 3,4
0,91,8
13,6 13,3
2014 2015
Positive:
Increase in transport and logistics services provided for external clients
Fine coal and coke deliveries for CIECH Soda Polska taken over from external contractors
Railway siding management in CIECH Sarzyna taken over from external contractors
Successful intensification of restructuring activities
Taking over management of carriage for raw material purchases
Negative:
Development of transport activities hindered by maintenance works on Polish State Railway lines
EBITDA (Adj.) [PLN million]
EBITDA (Adj.) – adjusted EBITDA (see the appendix for one-off adjustments)

17
DebtFinancial results for 2015
1 261
1 479
1 213 1 182
1 4033,93,5
2,72,3
1,9
2011 2012 2013 2014 2015
Net debt Net debt/EBITDA (Adj.)
[PLN million] 2015 2014 YoY
Debt ratio 65.7% 69.3% -3.6 p.p.
Long-term debt ratio 46.1% 45.9% 0.2 p.p.
Debt to equity ratio 191.5% 225.3% -33.8 p.p.
Gross financial liabilities (PLN million) 1,605 1,232 30.3%
Net financial liabilities (PLN million) 1,403 1,183 18.6%
The Group’s debt is consistently decreasing. At the end of 2015, the ratio of net debt to EBITDA (Adj.) was 1.9. The Group’s strategy is to lower the ratio to below 1 in 2019.
Debt ratio is lowerthan in December 2014 and equals 65.7%.
Methodology for calculating the metrics is consistent with the financial statement

18
Cash flowFinancial results for 2015
[PLN million] 2015 2014
EBITDA 708 526
Working capital -97 96
Interest paid -127 -114
Taxes paid -21 -19
Other -6 -46
Cash flow from operating activities 457 443
CAPEX -504 -289
Other 18 5
Cash flow from investment activities -486 -284
Free cash flow -29 159
Debt financing 180 -153
Dividends 0 -60
Other 3 0
Cash flow from financial activities 183 -213
Total net flow 154 -54
Closing balance of cash 203 49
Simplified

1. Market situation and major events
2. Financial results for 2015
3. Outlook for 2016

20
Market environment — challengesOutlook for 2016
Soda market — supply and prices
Macroeconomic context, including the economic situation
in China
Prices of energy sources

21
Further development of the soda segmentOutlook for 2016
Sales of additional soda volumesfrom expanded installations
Higher quality of products and a focus on highly processed products
Higher share of dry salt in revenue, lower exposure to weather conditions
Optimisation of the salt products portfolio
Entry to new markets
22
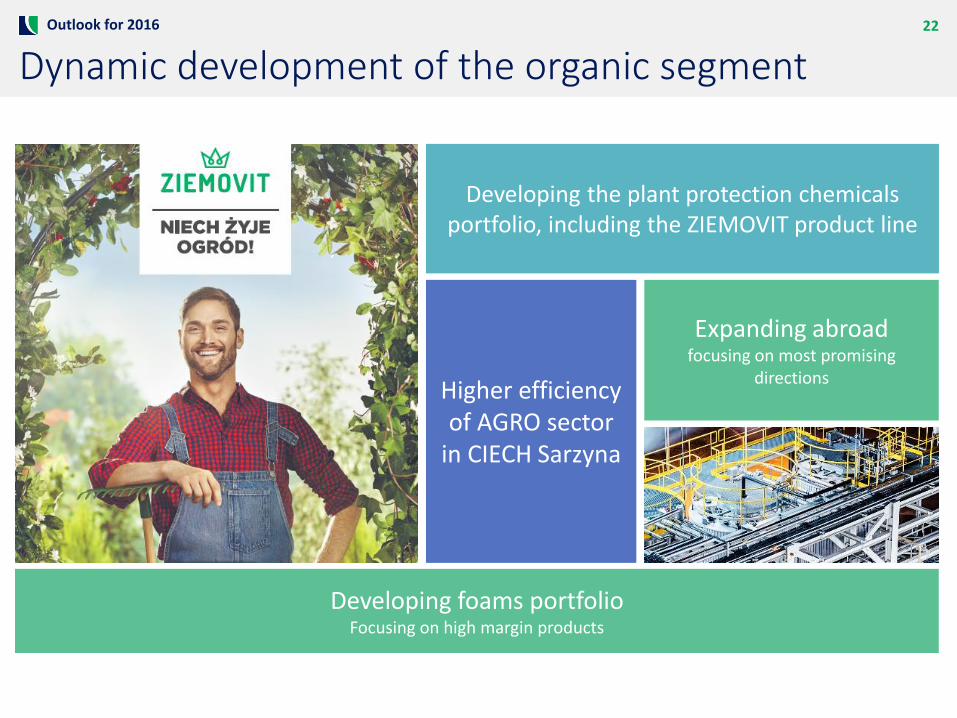
Dynamic development of the organic segmentOutlook for 2016
Developing the plant protection chemicals portfolio, including the ZIEMOVIT product line
Higher efficiency of AGRO sector
in CIECH Sarzyna
Developing foams portfolio Focusing on high margin products
Expanding abroadfocusing on most promising
directions

23
Other investments and projectsOutlook for 2016
Increased innovationthrough new R&D projects
Modernisationand expansion of
the sodium silicate furnace
Transport servicesfor external clients
Continued construction of a fume treatment installation to remove
nitrogen and sulphur oxides

24
Why CIECH?CIECH vs. its competitors
Modern and diversified chemical groupon a stable progress path
Innovative approach to business
Diversification, also within segments
Stable increase in profits and margins since 2013 and potential for furthereffective growth in all segments
Financial backing from a strong dominant shareholder
Dynamic development of the organic segmentand increasing its share in the Group’s revenue
Extending the portfolio based on recent consumer trends
Modernised plants
Appendices

26
One-off adjustmentsAppendices
[PLN thousand] 2015 2014
EBITDA 707,538 526,302
One-off events, including: (40,884) 15,176
Impairment write-offs (a) (2,119) 17,791
Cash items (b) (1,143) 625
Non-cash items (excluding impairment write-offs) (c) (37,622) (3,239)
Adjusted EBITDA 748,422 511,126
(a) Impairment write-offs refer to creating/reversing write-offs of assets.
(b) Cash items include, but are not limited to, profit/loss from the sale of fixed tangible assets and other items(including costs of abandoned activities, penalties and compensation received or paid).
(c) Non-cash items include, but are not limited to, fair value of investment properties, costs of liquidating inventoryand fixed tangible assets, costs of suspended investments, environmental provisions, liability and compensationprovisions, costs of unused production capabilities and other items (including extraordinary costs and otherprovisions).

27
ShareholdersAppendices
KI Chemistry
OFE Nationale-Nederlanden
Other
52,699,909shares
=52,699,909
votes
Since 9 July 2014 KI Chemistry (company
belonging to the Kulczyk Investments
group) is a major shareholder
of CIECH
9%51%
40%As of 18 March 2016
28
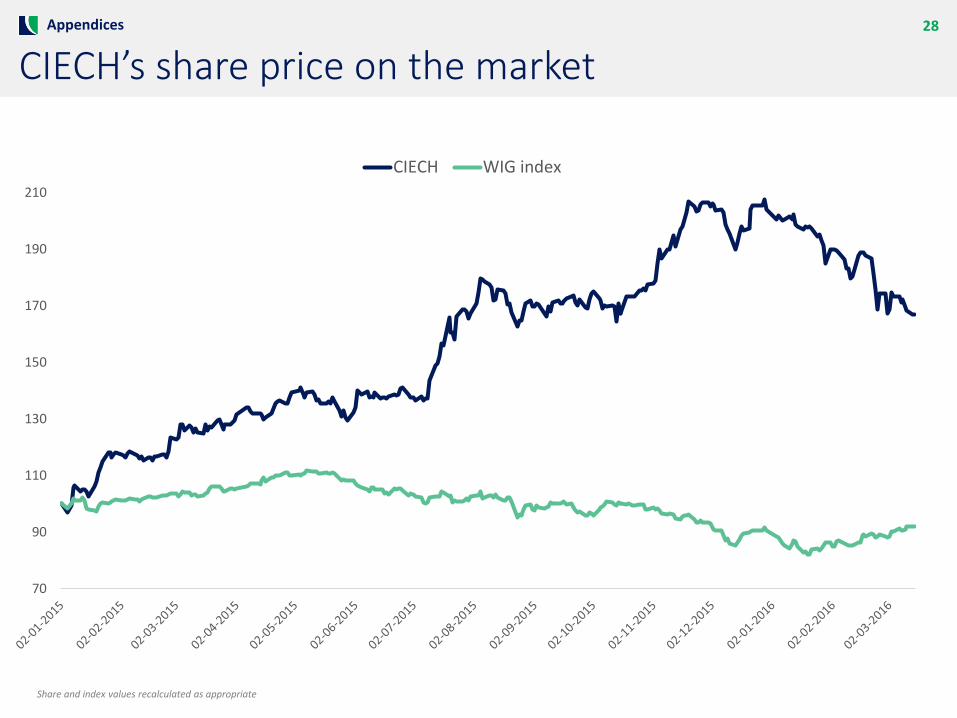
CIECH’s share price on the marketAppendices
70
90
110
130
150
170
190
210
CIECH WIG index
Share and index values recalculated as appropriate

Segment
29CIECH Group — 2016
CIECH group — business segments
Soda segment
Salt
Organic segment
Transport segment
Glass and silicates segment
CIECH Soda PolskaCIECH Soda Deutschland
CIECH Soda Romania
CIECH Cargo
CIECH SarzynaCIECH Pianki
CIECH Vitrosilicon

30Appendices
This document has been prepared solely for informational purposes. It includes only summary information, is not exhaustive, and may not be usedas a sole basis for any assessment or analysis. CIECH S.A. makes no guarantees (explicit or implicit) regarding information presented herein andsuch information, including forecasts, estimates and opinions, should not be unduly relied upon. CIECH S.A. does not accept any responsibility forpossible mistakes, omissions or irregularities found herein. The document is based on sources of information which CIECH S.A. deems to be reliableand accurate, however, it does not guarantee them to be exhaustive nor to fully reflect the actual situation. This document does not constitute anadvertisement or a public offer of securities. It may include forward-looking statements that involve investment risks or uncertainties and maysignificantly differ from actual results. CIECH S.A does not accept any responsibility for consequences of decisions made based on this document.The responsibility lies exclusively with the party using the document. This document is protected by the Copyright and Related Rights Act. Copying,publishing or distributing it requires prior written consent of CIECH S.A.
CONTACT FOR INVESTORS:
Joanna SiedlaczekInvestor Relations Expert
+48 669 600 [email protected]


![CIECH S.A.: Strona główna · Grupa CIECH Rodzaje sody produkowane przez Grupe CIECH soda do dializ (w chorobach nerek) [sobic health care] soda oczyszczona farmaceutyczna [sobic](https://img.pdfslide.net/doc/110x75/602b2c5c9bd2180a40534d43/ciech-sa-strona-gwna-grupa-ciech-rodzaje-sody-produkowane-przez-grupe-ciech.jpg)
![Financial results for 1Q16 - CIECH · Extinguishment of the business of the CIECH Transclean company Financial results for 1Q16 +12.1% +0.1% Q1 Q2 Q3 Q4 Revenue [PLN million] EBITDA](https://img.pdfslide.net/doc/110x75/5ed7b04886e8a75e3f299114/financial-results-for-1q16-ciech-extinguishment-of-the-business-of-the-ciech-transclean.jpg)


![CIECH Soda Rom nia (CSR)...18 04 Impact ul Grupului CIECH YkmhjY] [gfgea]ajge f] la f 2018 26 05 Impact ul Grupului CIECH YkmhjY] [gfgea]a a [gemfal"{aabm\]{mdma N d[]Y 36 06 A nexe](https://img.pdfslide.net/doc/110x75/60e93d0d07a30f79367199b3/ciech-soda-rom-nia-csr-18-04-impact-ul-grupului-ciech-ykmhjy-gfgeaajge.jpg)