Embed Size (px)
Citation preview
Title
Arial, Bold, 40 pt, red
Subtitle
Arial, Bold, 40 pt, grey
Q4 2014 results – 13 February 2015 Bengt Baron, CEO
Danko Maras, CFO
Jacob Broberg, SVP IR
Title
Arial, Bold, 40 pt, red
Text/Bullets, Level 1-5
Arial, Regular, 20 pt, grey
Subtitle
Arial, Bold, 40 pt, grey
Q4 highlights
2
Increased sales, improved operating profit (EBIT) and
very strong cash flow
• Net sales for the quarter increased by 9.6 per cent to SEK 1,579m (1,441),
including a positive impact from foreign exchange rates of 3.1 per cent.
• Operating profit was SEK 262m (175)
• Underlying EBIT was SEK 244m (231)
• Cash flow from operating activities was SEK 290m (116)
• Net debt/EBITDA was 3.97x (4.19). In the quarter, loans of
SEK 34m were repaid.
• No dividend payout proposed for the year in line with
financial strategy to reduce net debt.
Title
Arial, Bold, 40 pt, red
Text/Bullets, Level 1-5
Arial, Regular, 20 pt, grey
Subtitle
Arial, Bold, 40 pt, grey
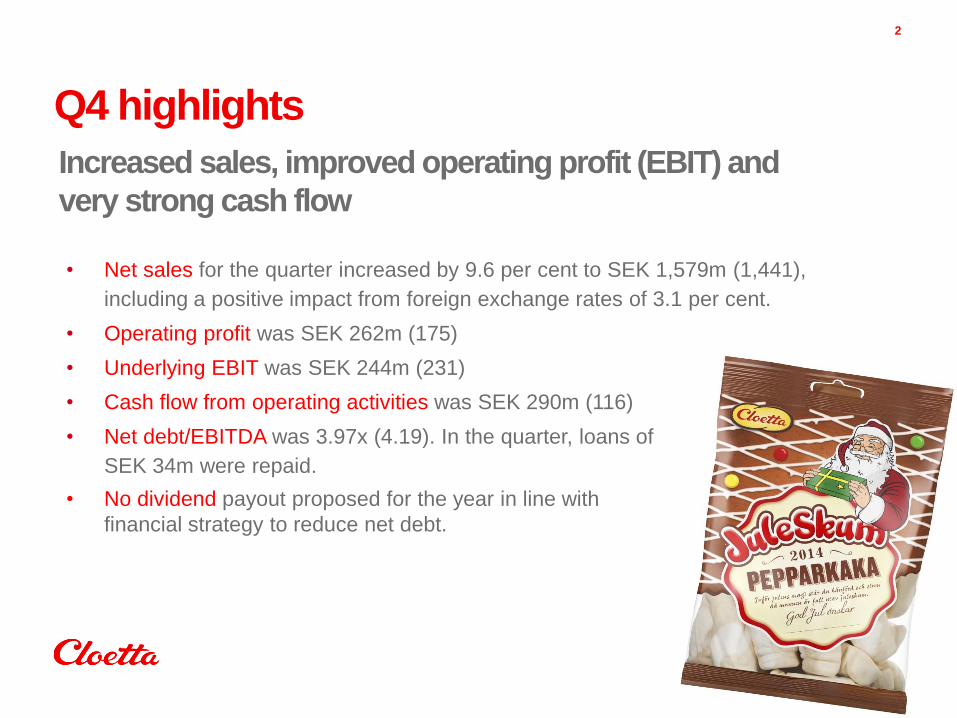
Overall market and sales development
Sales growth of 9.6 per cent
• Flat to slightly positive total market
developments, except Finland and Denmark
• Organic growth +1.7 per cent for the quarter
• Particularly strong sales trend in Denmark
• Sales grew or remained flat in all markets, except
Italy, Germany and the UK
• Decline in sales and weak market conditions in
Italy makes it necessary to adapt the Italian
organisation
• Sales of nuts under Nutisal brand grew, while
sales of contract manufacturing decreased
substantially
3
Cloetta´s main markets
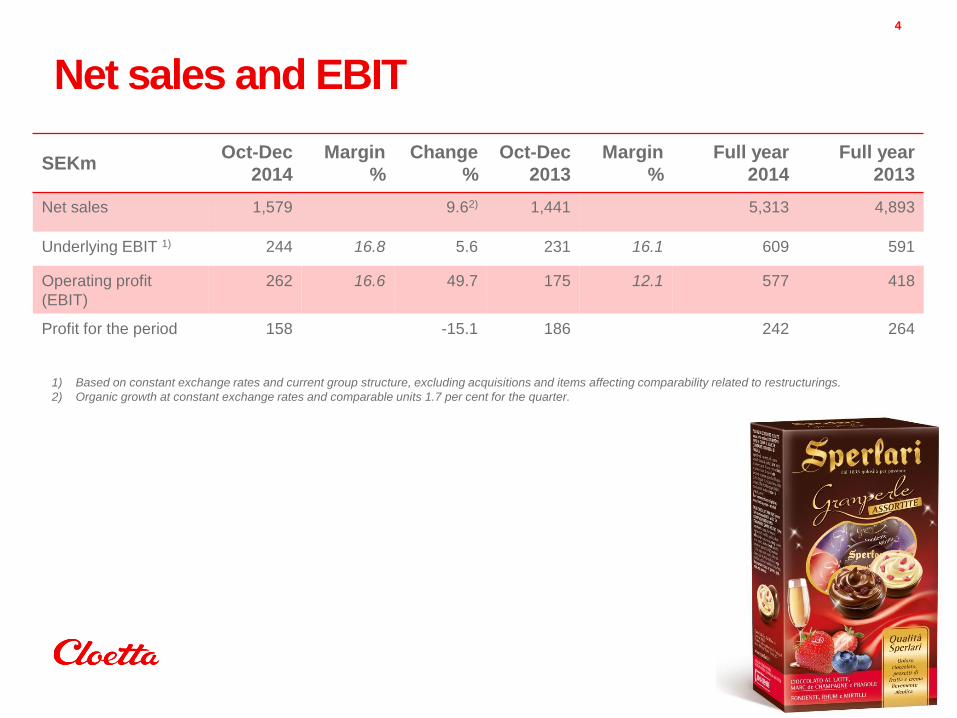
SEKm Oct-Dec
2014
Margin
%
Change
%
Oct-Dec
2013
Margin
%
Full year
2014
Full year
2013
Net sales 1,579 9.62) 1,441 5,313 4,893
Underlying EBIT 1) 244 16.8 5.6 231 16.1 609 591
Operating profit
(EBIT)
262 16.6 49.7 175 12.1 577 418
Profit for the period 158 -15.1 186 242 264
1) Based on constant exchange rates and current group structure, excluding acquisitions and items affecting comparability related to restructurings.
2) Organic growth at constant exchange rates and comparable units 1.7 per cent for the quarter.
Net sales and EBIT
4
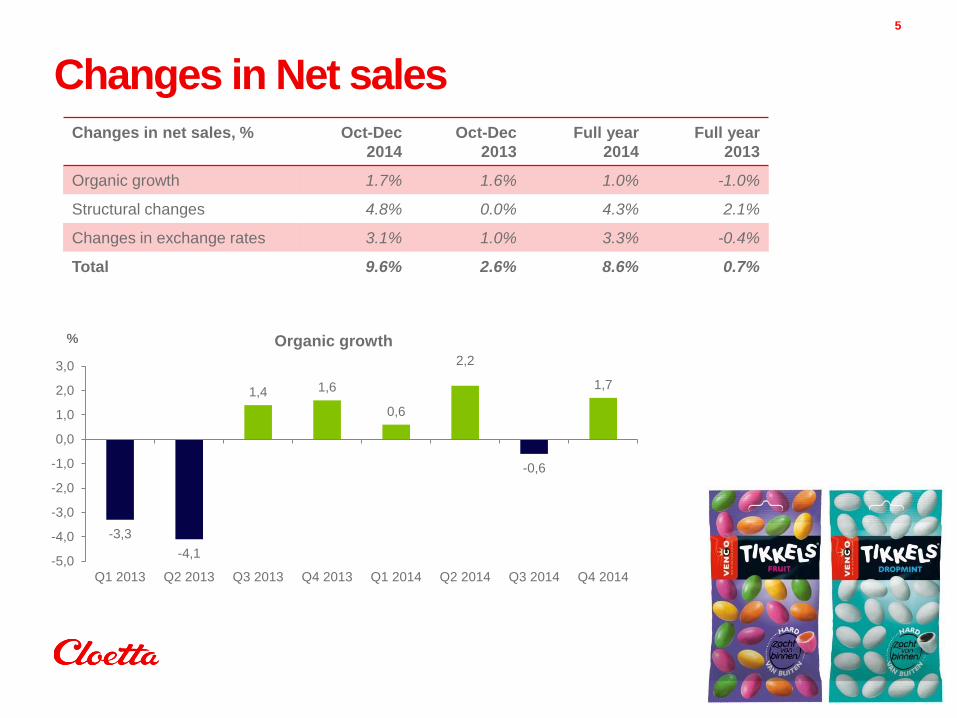
Changes in Net sales
5
-3,3
-4,1
1,4 1,6
0,6
2,2
-0,6
1,7
-5,0
-4,0
-3,0
-2,0
-1,0
0,0
1,0
2,0
3,0
Q1 2013 Q2 2013 Q3 2013 Q4 2013 Q1 2014 Q2 2014 Q3 2014 Q4 2014
% Organic growth
Changes in net sales, % Oct-Dec
2014
Oct-Dec
2013
Full year
2014
Full year
2013
Organic growth 1.7% 1.6% 1.0% -1.0%
Structural changes 4.8% 0.0% 4.3% 2.1%
Changes in exchange rates 3.1% 1.0% 3.3% -0.4%
Total 9.6% 2.6% 8.6% 0.7%
Title
Arial, Bold, 40 pt, red
Text/Bullets, Level 1-5
Arial, Regular, 20 pt, grey
Subtitle
Arial, Bold, 40 pt, grey
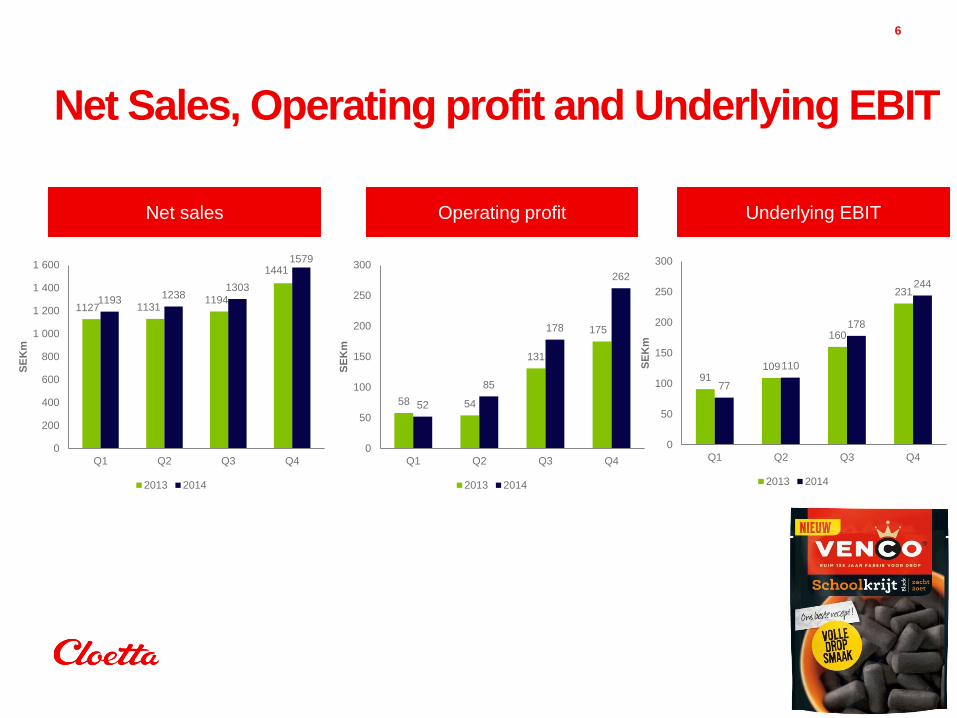
Net Sales, Operating profit and Underlying EBIT
6
Net sales Operating profit Underlying EBIT
1127 1131 1194
1441
1193 1238
1303
1579
0
200
400
600
800
1 000
1 200
1 400
1 600
Q1 Q2 Q3 Q4
SE
Km
2013 2014
58 54
131
175
52
85
178
262
0
50
100
150
200
250
300
Q1 Q2 Q3 Q4
SE
Km
2013 2014
91 109
160
231
77
110
178
244
0
50
100
150
200
250
300
Q1 Q2 Q3 Q4
SE
Km
2013 2014
Title
Arial, Bold, 40 pt, red
Text/Bullets, Level 1-5
Arial, Regular, 20 pt, grey
Subtitle
Arial, Bold, 40 pt, grey
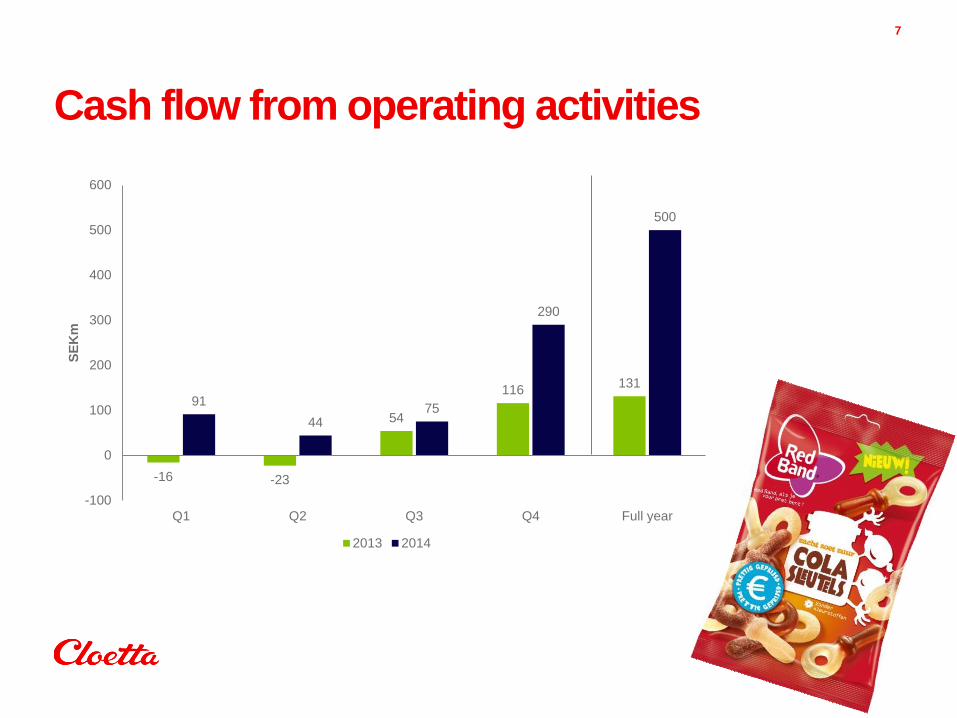
Cash flow from operating activities
7
-16 -23
54
116 131
91
44 75
290
500
-100
0
100
200
300
400
500
600
Q1 Q2 Q3 Q4 Full year
SE
Km
2013 2014
Title
Arial, Bold, 40 pt, red
Text/Bullets, Level 1-5
Arial, Regular, 20 pt, grey
Subtitle
Arial, Bold, 40 pt, grey
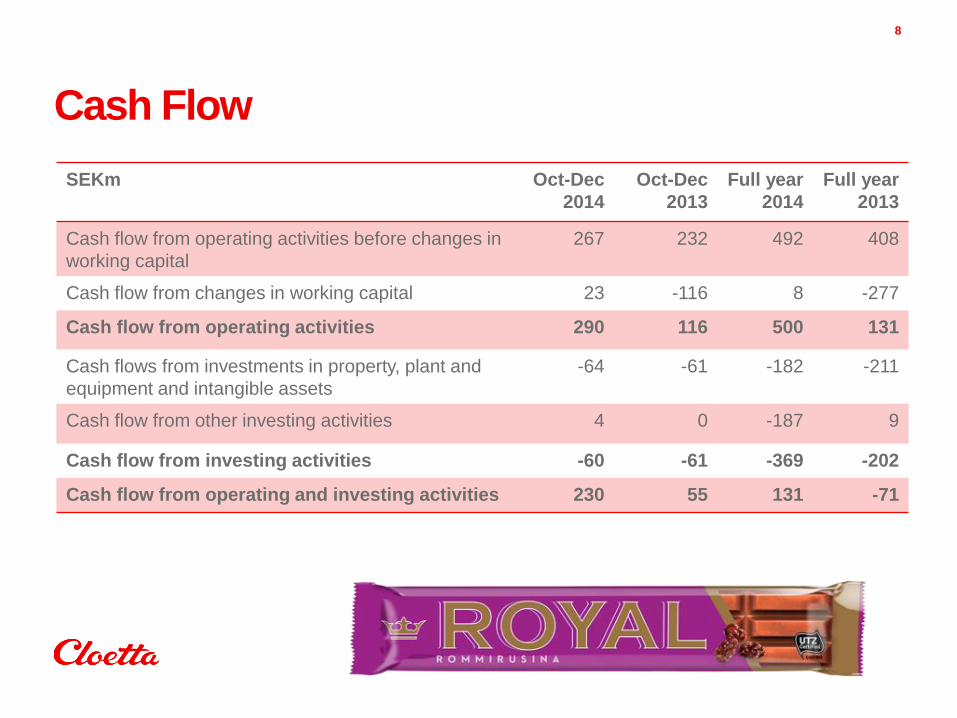
Cash Flow
8
SEKm Oct-Dec
2014
Oct-Dec
2013
Full year
2014
Full year
2013
Cash flow from operating activities before changes in
working capital
267 232 492 408
Cash flow from changes in working capital 23 -116 8 -277
Cash flow from operating activities 290 116 500 131
Cash flows from investments in property, plant and
equipment and intangible assets
-64 -61 -182 -211
Cash flow from other investing activities 4 0 -187 9
Cash flow from investing activities -60 -61 -369 -202
Cash flow from operating and investing activities 230 55 131 -71
Title
Arial, Bold, 40 pt, red
Text/Bullets, Level 1-5
Arial, Regular, 20 pt, grey
Subtitle
Arial, Bold, 40 pt, grey
9
• Ambition to continue to repay loans, but also provide financial flexibility for
complementary acquisitions and share dividends
• Net debt/EBITDA decreased to 3.97x (4.19)
• The long-term target of a net debt/EBITDA of 2.5 remains
Decreased Net debt/EBITDA
Title
Arial, Bold, 40 pt, red
Text/Bullets, Level 1-5
Arial, Regular, 20 pt, grey
Subtitle
Arial, Bold, 40 pt, grey
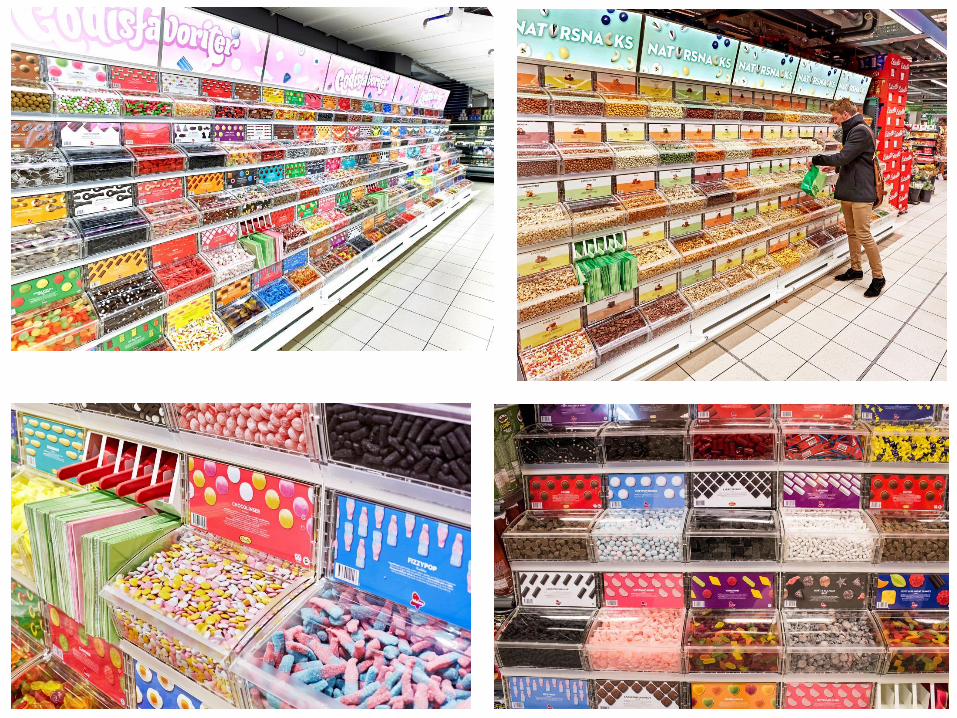
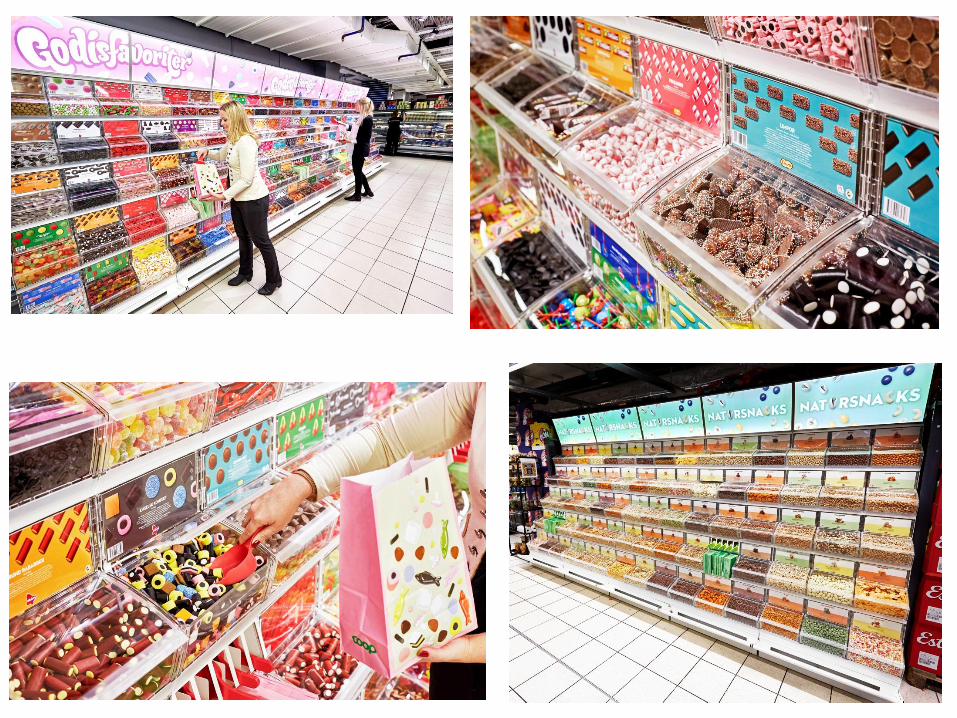
New pick-and-mix concept in Coop
10
• Roll-out of the new pick-and-mix concept is proceeding according to plan
• The vast majority of Coop’s approximately 700 stores have implemented the
new candy concept. Natural snacks under implementation
• The aim is to refit all stores ahead of the Easter peak
Title
Arial, Bold, 40 pt, red
Text/Bullets, Level 1-5
Arial, Regular, 20 pt, grey
Subtitle
Arial, Bold, 40 pt, grey
11
Title
Arial, Bold, 40 pt, red
Text/Bullets, Level 1-5
Arial, Regular, 20 pt, grey
Subtitle
Arial, Bold, 40 pt, grey
12
Title
Arial, Bold, 40 pt, red
Text/Bullets, Level 1-5
Arial, Regular, 20 pt, grey
Subtitle
Arial, Bold, 40 pt, grey
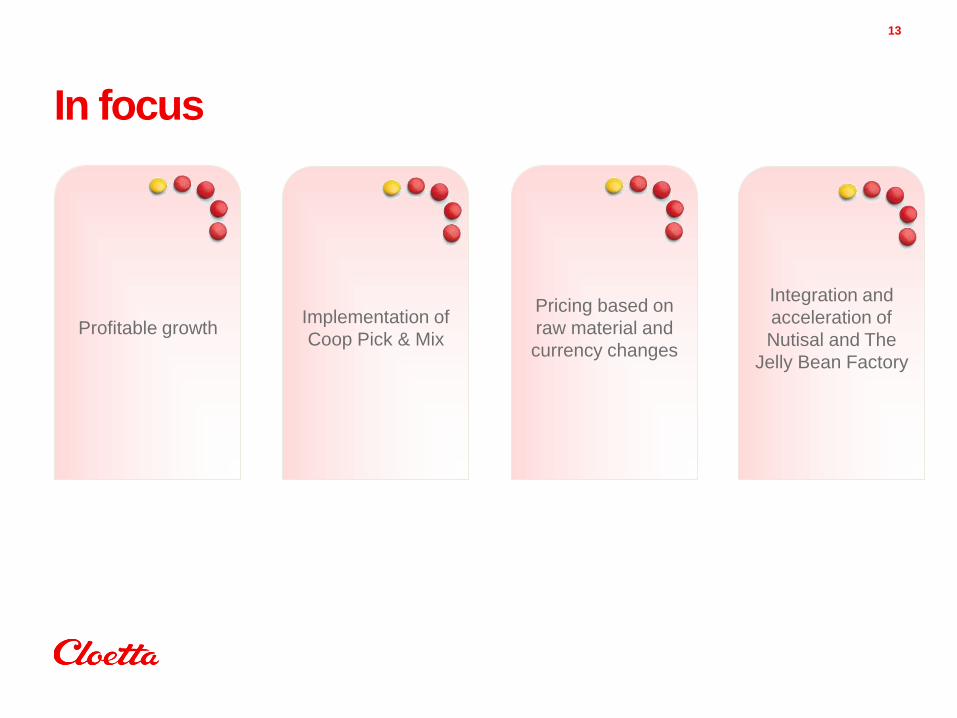
In focus
13
Profitable growth
Pricing based on
raw material and
currency changes
Implementation of
Coop Pick & Mix
Integration and
acceleration of
Nutisal and The
Jelly Bean Factory
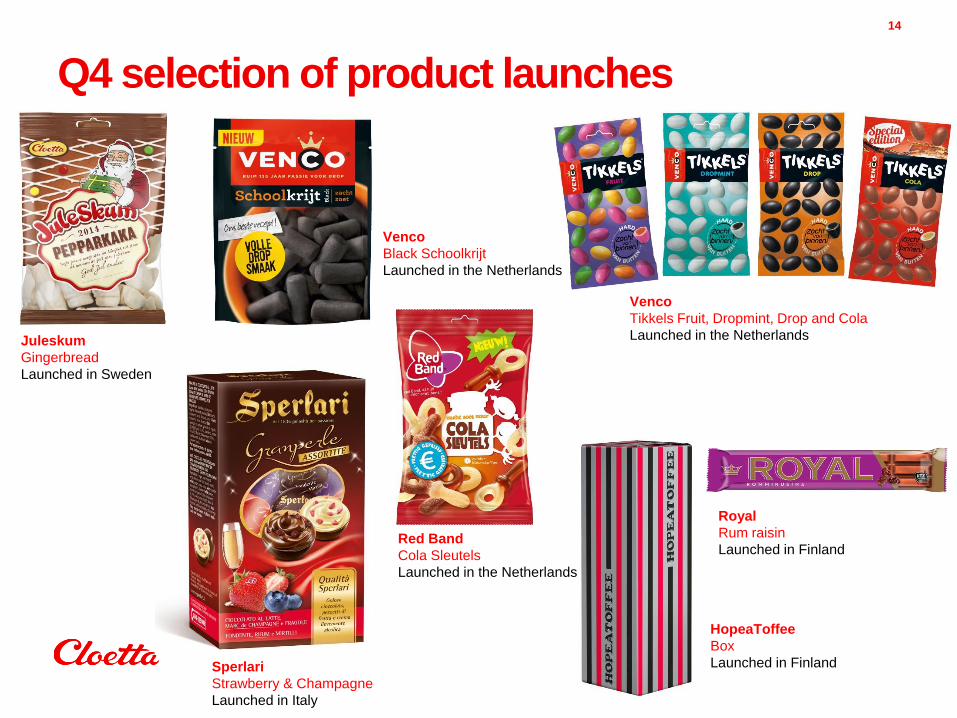
Q4 selection of product launches
14
Venco
Tikkels Fruit, Dropmint, Drop and Cola
Launched in the Netherlands Juleskum
Gingerbread
Launched in Sweden
Sperlari
Strawberry & Champagne
Launched in Italy
HopeaToffee
Box
Launched in Finland
Red Band
Cola Sleutels
Launched in the Netherlands
Royal
Rum raisin
Launched in Finland
Venco
Black Schoolkrijt
Launched in the Netherlands
Title
Arial, Bold, 80 pt, white Q&A
Title
Arial, Bold, 40 pt, red
Text/Bullets, Level 1-5
Arial, Regular, 20 pt, grey
Subtitle
Arial, Bold, 40 pt, grey
Disclaimer
• This presentation has been prepared by Cloetta AB (publ) (the “Company”) solely for use at this presentation and is furnished to you solely for your information and may not be reproduced or redistributed, in whole or in part, to any other person. The presentation does not constitute an invitation or offer to acquire, purchase or subscribe for securities. By attending the meeting where this presentation is made, or by reading the presentation slides, you agree to be bound by the following limitations.
• This presentation is not for presentation or transmission into the United States or to any U.S. person, as that term is defined under Regulation S promulgated under the Securities Act of 1933, as amended.
• This presentation contains various forward-looking statements that reflect management’s current views with respect to future events and financial and operational performance. The words “believe,” “expect,” “anticipate,” “intend,” “may,” “plan,” “estimate,” “should,” “could,” “aim,” “target,” “might,” or, in each case, their negative, or similar expressions identify certain of these forward-looking statements. Others can be identified from the context in which the statements are made. These forward-looking statements involve known and unknown risks, uncertainties and other factors, which are in some cases beyond the Company’s control and may cause actual results or performance to differ materially from those expressed or implied from such forward-looking statements. These risks include but are not limited to the Company’s ability to operate profitably, maintain its competitive position, to promote and improve its reputation and the awareness of the brands in its portfolio, to successfully operate its growth strategy and the impact of changes in pricing policies, political and regulatory developments in the markets in which the Company operates, and other risks.
• The information and opinions contained in this document are provided as at the date of this presentation and are subject to change without notice.
• No representation or warranty (expressed or implied) is made as to, and no reliance should be placed on, the fairness, accuracy or completeness of the information contained herein. Accordingly, none of the Company, or any of its principal shareholders or subsidiary undertakings or any of such person’s officers or employees accepts any liability whatsoever arising directly or indirectly from the use of this document.
16