Embed Size (px)
Citation preview

APRIL 28, 2016
FIRST QUARTER 2016 RESULTS
Issued on April 28, 2016 2
Pro Forma Adjustment and Cautionary Statement
Comparisons to prior periods are being presented on a “pro forma” (PF) basis, representing results adjusted to exclude the company’s Venezuelan subsidiary’s operations which were deconsolidated at the end of the third quarter 2015. Growth rates disclosed in thepresentation are on a year-over-year basis. Revenue comparisons to prior periods are provided on a constant currency basis, unless otherwise noted. The reported first quarter 2015 results have been adjusted to reflect changes made to customer assignments between the wholesale and enterprise channels as of the beginning of 2016.
Some statements made in this presentation are forward-looking in nature and are based on management's current expectations or beliefs. These forward-looking statements are not a guarantee of performance and are subject to a number of uncertainties and other factors, many of which are outside Level 3's control, which could cause actual events to differ materially from those expressed or implied by the statements. Important factors that could prevent Level 3 from achieving its stated goals include, but are not limited to, the company's ability to: increase revenue from its services to realize its targets for financial and operating performance; develop and maintain effective business support systems; manage system and network failures or disruptions; avert the breach of its network and computer system security measures; develop new services that meet customer demands and generate acceptable margins; manage the future expansion or adaptation of its network to remain competitive; defend intellectual property and proprietary rights; manage risks associated with continued uncertainty in the global economy; manage continued or accelerated decreases in market pricing for communications services; obtain capacity for its network from other providers and interconnect its network with other networks on favorable terms; successfully integrate future acquisitions; effectively manage political, legal, regulatory, foreign currency and other risks it is exposed to due to its substantial international operations; mitigate its exposure to contingent liabilities; and meet all of the terms and conditions of its debt obligations. Additional information concerning these and other important factors can be found within Level 3's filings with the Securities and Exchange Commission. Statements in this presentation should be evaluated in light of these important factors. Level 3 is under no obligation to, and expressly disclaims any such obligation to, update or alter its forward-looking statements, whether as a result of new information, future events, or otherwise.

Issued on April 28, 2016 3
Executing on Initiatives
Focus on Operational Excellence
Continued Sales Momentum
Systems Consolidation
Investments in Products and Network

Issued on April 28, 2016 4
1Q16 Highlights
(1) On a pro forma, constant currency basis, excluding UK Government
YoY CNS Enterprise Revenue Growth(1)
• Sequential North America CNS Enterprise Revenue Growth of Approximately 2%
Delivered 15% YoY pro forma Adjusted EBITDA growth
Strong Free Cash Flow generation
6.2%
$710million
$213million

Issued on April 28, 2016 5
$1,904 $1,947
1Q15 PF 1Q16
CNS and Enterprise Revenue
3.6% growthConstant currency
CNS Revenue($ in Millions)
1Q16 CNS Revenue Growth(1)
1Q16 CNS Revenue Churn(3)
(1) On a pro forma basis(2) Excluding UK Government(3) Level 3 measures revenue churn as disconnects of Core Network Services (CNS) monthly recurring revenue as a percentage of CNS
revenue. This calculation excludes churn from customers who disconnected existing service in a particular location but replaced it with new services in the same location. The calculation also excludes usage.
1.1%
Revenue Constant Currency
YoY%As Reported
YoY%
Total CNS 3.6% 2.3%
Enterprise 5.7% 4.3%
Wholesale (1.4%) (2.7%)
North America 4.4% 4.4%
Enterprise 6.4% 6.5%
Wholesale (0.9%) (0.9%)
EMEA (4.9%) (7.7%)
Enterprise(2) (0.5%) (2.7%)
Wholesale (5.3%) (8.5%)
Latin America 7.6% (4.9%)
Enterprise 10% (2.5%)
Wholesale - (11%)
Issued on April 28, 2016 6
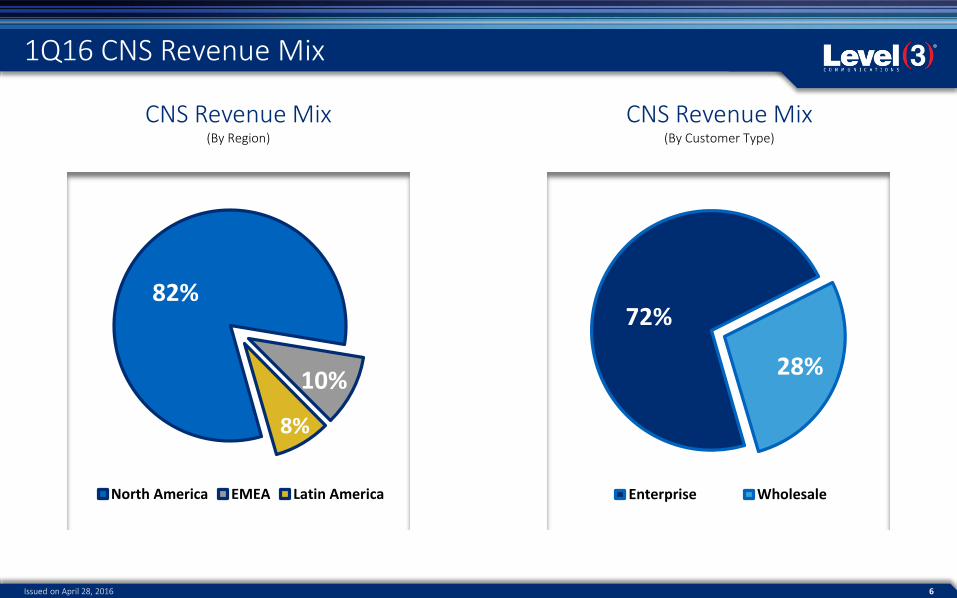
1Q16 CNS Revenue Mix
CNS Revenue Mix(By Region)
CNS Revenue Mix(By Customer Type)
82%
10%
8%
North America EMEA Latin America
72%
28%
Enterprise Wholesale

Issued on April 28, 2016 7
1Q16 CNS Services Revenue
CNS Revenue by Service Type 1Q16 CNS Services Revenue
IP & Data Services
$918M
7.2%
5.6%
Constant Currency
Transport & Fiber
$579M
Voice Services
$303M
Colocation & Datacenter
$147M
(0.3%)
(1.2%)
2.4%
1.7%
(0.5%)
(2.6%)
As Reported
Constant Currency
As Reported
Constant Currency
As Reported
Constant Currency
As Reported
IP & Data
Transport & Fiber
Colocation & Datacenter
Voice Services
Note: Growth rates are on a year-over-year, pro forma basis
47%
30%16%
7%

Issued on April 28, 2016 8
Network Related (NRE) and SG&A Expenses
($ in millions)
Network Access Costs and Operating Expenses
Network Access Costs & Margin($ in millions)
(1) Excludes non-cash compensation expense of $5 million and $7 million in NRE for 1Q15PF and 1Q16, respectively and $26 million and $40 million in SG&A for 1Q15PF and 1Q16, respectively.
(1)
$720
$694
64.5%
66.2%
1Q15 PF 1Q16
Network Access Costs Network Access Margin
$349 $331
$341 $316
34.0%
31.5%
1Q15 PF 1Q16
NRE SG&A NRE and SG&A Expenses % Total Revenue
$647$690
Issued on April 28, 2016 9
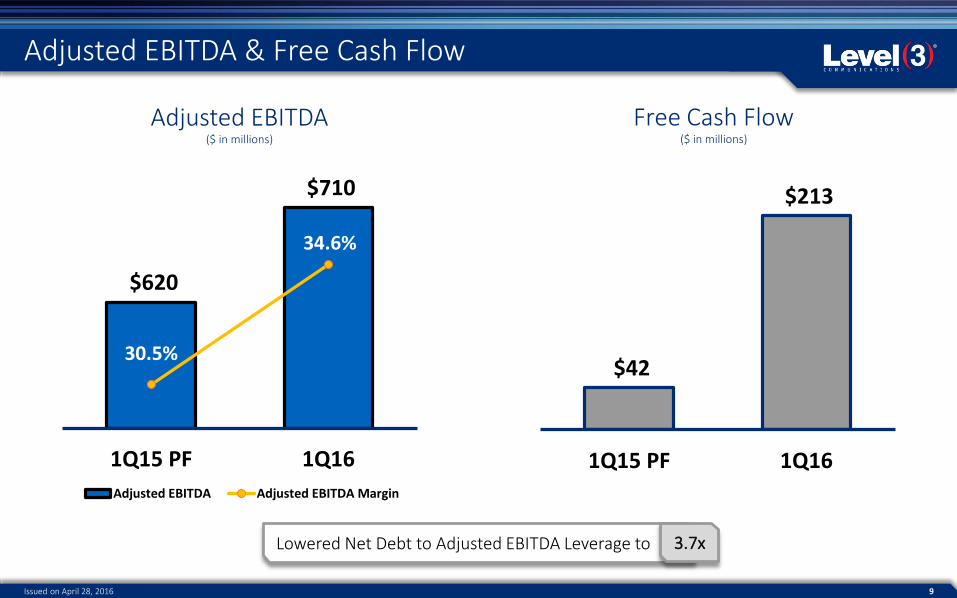
Adjusted EBITDA & Free Cash Flow
Adjusted EBITDA($ in millions)
Free Cash Flow($ in millions)
$620
$710
30.5%
34.6%
1Q15 PF 1Q16
Adjusted EBITDA Adjusted EBITDA Margin
$42
$213
1Q15 PF 1Q16
Lowered Net Debt to Adjusted EBITDA Leverage to 3.7x

Issued on April 28, 2016 10
Adjusted EBITDA(1)(2)
Free Cash Flow
GAAP Interest Expense(2)
Cash Interest Expense(2)
Capital Expenditures
Depreciation & Amortization
Non-Cash Compensation(2)
Cash Income Tax
2016 Business Outlook
(1) From a starting point of $2.592 billion, which represents 2015 Adjusted EBITDA, on a pro forma basis to exclude results from Venezuela(2) Updated as of 1Q16
YoY Growth of 10% to 12%
$1.0 to $1.1 billion
$555 million
$510 million
15% of Total Revenue
$1.230 billion
$170 million
$40 million
Outlook Metric
Full Year Income Tax Rate ~30%

Issued on April 28, 2016 11
Appendix
Appendix

Issued on April 28, 2016 12
Financial and Operational Metrics (1Q16)
CNS Revenue by Geography 82% North America 10% EMEA 8% Latin America
CNS Revenue by Product Group 47% IP & Data 30% Transport & Fiber 16% Voice Services 7% Colocation & Datacenter
CNS vs. WVS Revenue 95% CNS 5% WVS
CNS Revenue by Channel 72% Enterprise 28% Wholesale
Customers Total: ~51,000 96% Enterprise 4% Wholesale
HeadcountTotal Employees: ~12,700QBHC: ~1,140
On-net Buildings Total: 43,900 78% North America 17% Latin America 5% EMEA
Shares Outstanding 357 million
U.S. Federal NOL Balance $9.8 billion
Net Debt to Adjusted EBITDA ratio 3.7x Focused on the low end of
target leverage range of 3 to 4 times
Revenue Metrics
Total Revenue by Currency 91% USD 4% GBP 2% EUR 2% BRL 1% All Other Currencies
CNS Revenue by Currency 90% USD 4% GBP 3% EUR 2% BRL 1% All Other Currencies
Capital Expenditures as a Percent of Total Revenue 1Q16: 14%
CNS Revenue Churn 1.1% (Monthly)
Operational Metrics Financial Metrics

Issued on April 28, 2016 13
Appendix
Level 3 Non-GAAP Reconciliation

14Issued on April 28, 2016
Schedule to Reconcile to Non-GAAP Financial Metrics
Pursuant to Regulation G, the company is hereby providing definitions of non-GAAP financial metrics and reconciliations to the most directly comparable GAAP measures.
The following describes and reconciles those financial measures as reported under accounting principles generally accepted in the United States (GAAP) with those financial measures as adjusted by the items detailed below and presented in the accompanying news release. These calculations are not prepared in accordance with GAAP and should not be viewed as alternatives to GAAP. In keeping with its historical financial reporting practices, the company believes that the supplemental presentation of these calculations provides meaningful non-GAAP financial measures to help investors understand and compare business trends among different reporting periods on a consistent basis.
In addition, measures referred to in the accompanying news release as being calculated “on a constant currency basis” or "in constant currency terms" are non-GAAP metrics intended to present the relevant information assuming a constant exchange rate between the two periods being compared. Such metrics are calculated by applying the currency exchange rates used in the preparation of the prior period financial results to the subsequent period results.
Core Network Services Revenue includes revenue from colocation and datacenter services, transport and fiber, IP and data services, and voice services (local and enterprise).
Network Access Costs includes leased capacity, right-of-way costs, access charges, satellite transponder lease costs and other third party costs directly attributable to providing access to customer locations from the Level 3 network, but excludes Network Related Expenses, and depreciation and amortization. Network Access Costs do not include any employee expenses or impairment expenses; these expenses are allocated to Network Related Expenses or Selling, General and Administrative Expenses.

15Issued on April 28, 2016
Schedule to Reconcile to Non-GAAP Financial Metrics
Network Related Expenses includes certain expenses associated with the delivery of services to customers and the operation and maintenance of the Level 3 network, such as facility rent, utilities, maintenance and other costs, each related to the operation of its communications network, as well as salaries, wages and related benefits (including non-cash stock-based compensation expenses) associated with personnel who are responsible for the delivery of services, operation and maintenance of its communications network, and accretion expense on asset retirement obligations, but excludes depreciation and amortization.
Network Access Margin ($) is defined as total Revenue less Network Access Costs from the Consolidated Statements of Operations, and excludes Network Related Expenses.
Network Access Margin (%) is defined as Network Access Margin ($) divided by total Revenue. Management believes that network access margin is a relevant metric to provide to investors, as it is a metric that management uses to measure the margin available to the company after it pays third party network services costs; in essence, a measure of the efficiency of the company’s network.
Adjusted EBITDA is defined as net income (loss) from the Consolidated Statements of Operations before income taxes, total other income (expense), non-cash impairment charges, depreciation and amortization and non-cash stock compensation expense.
Adjusted EBITDA Margin is defined as Adjusted EBITDA divided by total Revenue.

16Issued on April 28, 2016
Schedule to Reconcile to Non-GAAP Financial Metrics
Management believes that Adjusted EBITDA and Adjusted EBITDA Margin are relevant and useful metrics to provide to investors, as they are an important part of the company’s internal reporting and are key measures used by Management to evaluate profitabilityand operating performance of the company and to make resource allocation decisions. Management believes such measures are especially important in a capital-intensive industry such as telecommunications. Management also uses Adjusted EBITDA and Adjusted EBITDA Margin to compare the company’s performance to that of its competitors and to eliminate certain non-cash and non-operating items in order to consistently measure from period to period its ability to fund capital expenditures, fund growth, service debt and determine bonuses. Adjusted EBITDA excludes non-cash impairment charges and non-cash stock compensation expense because of the non-cash nature of these items. Adjusted EBITDA also excludes interest income, interest expense and income taxes because these items are associated with the company’s capitalization and tax structures. Adjusted EBITDA also excludes depreciation and amortization expense because these non-cash expenses primarily reflect the impact of historical capital investments, as opposed to the cash impacts of capital expenditures made in recent periods, which may be evaluated through cash flow measures. Adjusted EBITDA excludes the gain (or loss) on extinguishment and modification of debt and other, net becausethese items are not related to the primary operations of the company.
There are limitations to using Adjusted EBITDA as a financial measure, including the difficulty associated with comparing companies that use similar performance measures whose calculations may differ from the company’s calculations. Additionally, this financial measure does not include certain significant items such as interest income, interest expense, income taxes, depreciation and amortization, non-cash impairment charges, non-cash stock compensation expense, the gain (or loss) on extinguishment and modification of debt and net other income (expense). Adjusted EBITDA and Adjusted EBITDA Margin should not be considered a substitute for other measures of financial performance reported in accordance with GAAP.

17Issued on April 28, 2016
Schedule to Reconcile to Non-GAAP Financial Metrics
Pro Forma Debt is defined as total gross debt, including capital leases from the Footnotes to the Consolidated Financial Statements, adjusted for the repayment of the 7% Senior Notes due 2020 on April 21, 2016.
Net Debt to Last Twelve Months (LTM) Adjusted EBITDA Ratio is defined as Pro Forma Debt, reduced by cash and cash equivalents and divided by LTM Adjusted EBITDA.
Unlevered Cash Flow is defined as net cash provided by (used in) operating activities less capital expenditures, plus cash interest paid and less interest income all as disclosed in the Consolidated Statements of Cash Flows or the Consolidated Statements ofOperations. Management believes that Unlevered Cash Flow is a relevant metric to provide to investors, as it is an indicator of the operational strength and performance of the company and, measured over time, provides management and investors with a sense of the underlying business’ growth pattern and ability to generate cash. Unlevered Cash Flow excludes cash used for acquisitions and debt service and the impact of exchange rate changes on cash and cash equivalents balances.
There are material limitations to using Unlevered Cash Flow to measure the company’s cash performance as it excludes certain material items such as payments on and repurchases of long-term debt, interest income, cash interest expense and cash used to fund acquisitions. Comparisons of Level 3’s Unlevered Cash Flow to that of some of its competitors may be of limited usefulness since Level 3 does not currently pay a significant amount of income taxes due to net operating losses, and therefore, generates higher cash flow than a comparable business that does pay income taxes. Additionally, this financial measure is subject to variability quarter over quarter as a result of the timing of payments related to accounts receivable and accounts payable and capital expenditures. Unlevered Cash Flow should not be used as a substitute for net change in cash and cash equivalents in the Consolidated Statements of Cash Flows.
18Issued on April 28, 2016
Schedule to Reconcile to Non-GAAP Financial Metrics
Free Cash Flow is defined as net cash provided by (used in) operating activities less capital expenditures as disclosed in the Consolidated Statements of Cash Flows. Management believes that Free Cash Flow is a relevant metric to provide to investors, as it is an indicator of the company’s ability to generate cash to service its debt. Free Cash Flow excludes cash used for acquisitions, principal repayments and the impact of exchange rate changes on cash and cash equivalents balances.
There are material limitations to using Free Cash Flow to measure the company’s performance as it excludes certain material items such as principal payments on and repurchases of long-term debt and cash used to fund acquisitions. Comparisons of Level 3’s Free Cash Flow to that of some of its competitors may be of limited usefulness since Level 3 does not currently pay a significant amount of income taxes due to net operating losses, and therefore, generates higher cash flow than a comparable business that does pay income taxes. Additionally, this financial measure is subject to variability quarter over quarter as a result of the timing of payments related to interest expense, accounts receivable and accounts payable and capital expenditures. Free Cash Flow should not be used as a substitute for net change in cash and cash equivalents on the Consolidated Statements of Cash Flows.

19Issued on April 28, 2016
Schedule to Reconcile to Non-GAAP Financial Metrics
Adjusted EBITDA
($ in millions)
1Q15
(as reported)
1Q15
(Pro Forma) (1)
1Q16
(as reported)
Net Income 122$ 109$ 124$
Income Tax Expense (Benefit) 5 5 94
Total Other Expense 189 189 144
Depreciation and Amortization Expense 288 286 301
Non-Cash Compensation Expense 31 31 47
Adjusted EBITDA 635$ 620$ 710$
Total Revenue 2,053$ 2,030$ 2,051$
Adjusted EBITDA Margin 30.9 % 30.5 % 34.6 %
Level 3 Communications, Inc. and Consolidated Subsidiaries
(1) Represents the consolidated results pro forma to exclude the Company's Venezuelan
subsidiary's operations that was deconsolidated as of September 30, 2015.

20Issued on April 28, 2016
Schedule to Reconcile to Non-GAAP Financial Metrics
Cash Flows
($ in millions)
1Q15
(as reported)
1Q15
(Pro Forma) (1)
1Q16
(as reported)
Net Cash Provided by Operating
Activities 305$ 293$ 510$
Capital Expenditures (254) (251) (297)
Free Cash Flow 51$ 42$ 213$
Cash Interest Paid 147 147 112
Interest Income (1) (1) (1)
Unlevered Cash Flow 197$ 188$ 324$
Level 3 Communications, Inc. and Consolidated
(1) Represents the consolidated results pro forma to exclude the Company's Venezuelan
subsidiary's operations that was deconsolidated as of September 30, 2015.
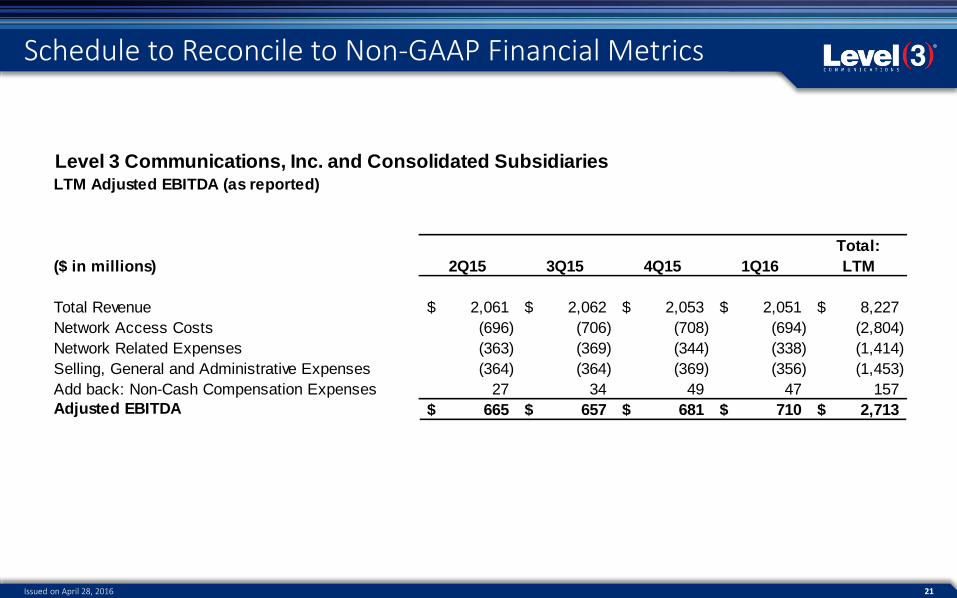
21Issued on April 28, 2016
Schedule to Reconcile to Non-GAAP Financial Metrics
($ in millions) 2Q15 3Q15 4Q15 1Q16
Total:
LTM
Total Revenue 2,061$ 2,062$ 2,053$ 2,051$ 8,227$
Network Access Costs (696) (706) (708) (694) (2,804)
Network Related Expenses (363) (369) (344) (338) (1,414)
Selling, General and Administrative Expenses (364) (364) (369) (356) (1,453)
Add back: Non-Cash Compensation Expenses 27 34 49 47 157
Adjusted EBITDA 665$ 657$ 681$ 710$ 2,713$
Level 3 Communications, Inc. and Consolidated SubsidiariesLTM Adjusted EBITDA (as reported)

22Issued on April 28, 2016
Schedule to Reconcile to Non-GAAP Financial Metrics
($ in millions)
Pro Forma Debt 11,025$
Cash and Cash Equivalents (1,004)
Net Debt 10,021
Adjusted EBITDA (1)2,713$
Net Debt to LTM Adjusted EBITDA Ratio 3.7
Level 3 Communications, Inc. and Consolidated SubsidiariesNet Debt to LTM Adjusted EBITDA ratio as of March 31, 2016
(1) Please refer to the computation on Slide 21.