Embed Size (px)
Citation preview
Goldman Sachs Global Metals & Mining Conference November 2016
Newmont Mining Corporation I Goldman Sachs Conference I Slide 2 November 2016
Cautionary statement This presentation contains “forward-looking statements” within the meaning of Section 27A of the Securities Act of 1933, as amended, and Section 21E of the Securities Exchange Act of 1934, as amended, which are intended to be covered by the safe harbor created by such sections and other applicable laws. Such forward-looking statements may include, without limitation: (i) estimates of future production and sales; (ii) estimates of future costs applicable to sales and All-in sustaining costs; (iii) estimates of future capital expenditures; (iv) estimates of future cost reductions and efficiencies; (v) expectations regarding the development, growth and potential of the Company’s operations, projects and investment, including, without limitation, returns, IRR, schedule, commercial start and first production and upside; (vi) expectations regarding future debt repayments and reductions; (vii) expectations regarding future free cash flow generation, liquidity and balance sheet strength; and (viii) expectations regarding the completion of the sale the Company’s interest in PTNNT, including, without limitation, the timing of closing, anticipated receipt of sale consideration and contingent payments, expected use of proceeds, expected accounting impacts resulting from the proposed transaction, future operation and transition of Batu Hijau (including Phase 7) and future development of Elang. Estimates or expectations of future events or results are based upon certain assumptions, which may prove to be incorrect. Such assumptions, include, but are not limited to: (i) there being no significant change to current geotechnical, metallurgical, hydrological and other physical conditions; (ii) permitting, development, operations and expansion of the Company’s operations and projects being consistent with current expectations and mine plans, including without limitation receipt of export approvals; (iii) political developments in any jurisdiction in which the Company operates being consistent with its current expectations; (iv) certain exchange rate assumptions for the Australian dollar to the U.S. dollar, as well as other the exchange rates being approximately consistent with current levels; (v) certain price assumptions for gold, copper and oil; (vi) prices for key supplies being approximately consistent with current levels; (vii) the accuracy of our current mineral reserve and mineralized material estimates; (viii) the acceptable outcome of negotiation of the amendment to the Contract of Work and/or resolution of export issues in Indonesia; and (ix) other assumptions noted herein. Investors are cautioned that no assurances can be made with respect to the closing of the pending sale of the Company’s interest in PTNNT, which remains contingent on the conditions precedent, including, without limitation, maintenance of valid export license at closing, the concurrent closing of the PTMDB sale of its 24 percent stake to the buyer, and no occurrence of material adverse events that would substantially impact the future value of Batu Hijau. Potential additional risks include other political, regulatory or legal challenges and community and labor issues. The amount of contingent payment will also remain subject to risks and uncertainties, including copper prices and future production and development at Batu Hijau and Elang. Where the Company expresses or implies an expectation or belief as to future events or results, such expectation or belief is expressed in good faith and believed to have a reasonable basis. However, such statements are subject to risks, uncertainties and other factors, which could cause actual results to differ materially from future results expressed, projected or implied by the “forward-looking statements”. Other risks relating to forward looking statements in regard to the Company’s business and future performance may include, but are not limited to, gold and other metals price volatility, currency fluctuations, increased production costs and variances in ore grade or recovery rates from those assumed in mining plans, political and operational risks, community relations, conflict resolution and outcome of projects or oppositions and governmental regulation and judicial outcomes. For a more detailed discussion of such risks and other factors, see the Company’s 2015 Annual Report on Form 10-K, filed on February 17, 2016, with the Securities and Exchange Commission (SEC), and the Company’s Form 10-Q for the quarter ended September 30, 2016, filed with the SEC on October 26, 2016, as well as the Company’s other SEC filings. The Company does not undertake any obligation to release publicly revisions to any “forward-looking statement,” including, without limitation, outlook, to reflect events or circumstances after the date of this presentation, or to reflect the occurrence of unanticipated events, except as may be required under applicable securities laws. Investors should not assume that any lack of update to a previously issued “forward-looking statement” constitutes a reaffirmation of that statement. Continued reliance on “forward-looking statements” is at investors' own risk. Investors are reminded that this presentation should be read in conjunction with Newmont’s Form 10-Q which has been filed on October 26, 2016 with the SEC (also available at www.newmont.com).
Newmont Mining Corporation I Goldman Sachs Conference I Slide 3 November 2016
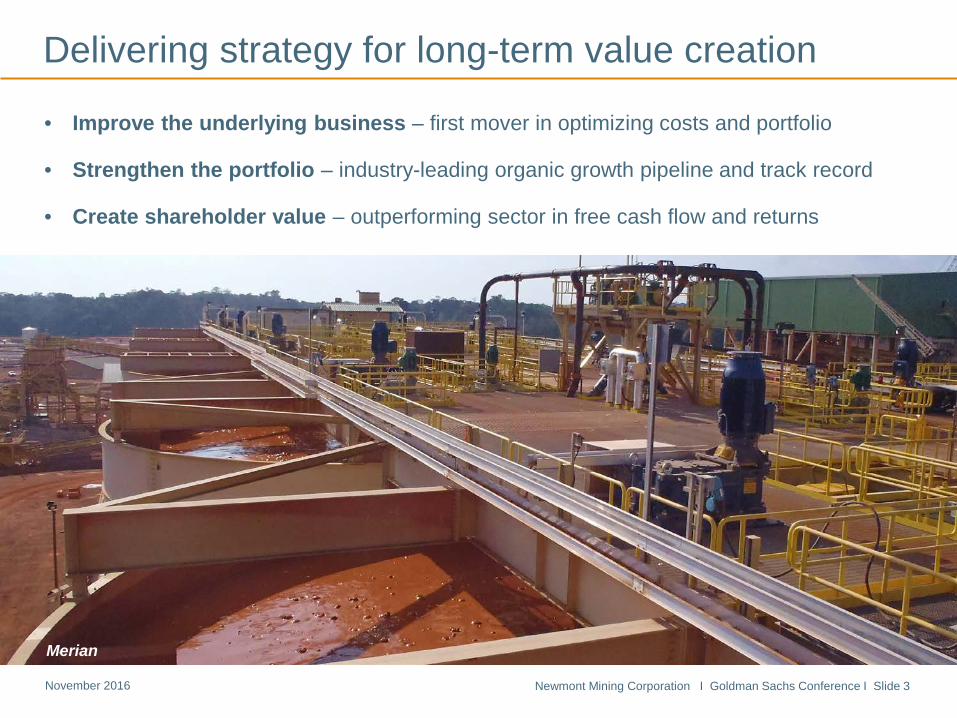
• Improve the underlying business – first mover in optimizing costs and portfolio
• Strengthen the portfolio – industry-leading organic growth pipeline and track record
• Create shareholder value – outperforming sector in free cash flow and returns
Delivering strategy for long-term value creation
Merian
Newmont Mining Corporation I Goldman Sachs Conference I Slide 4 November 2016
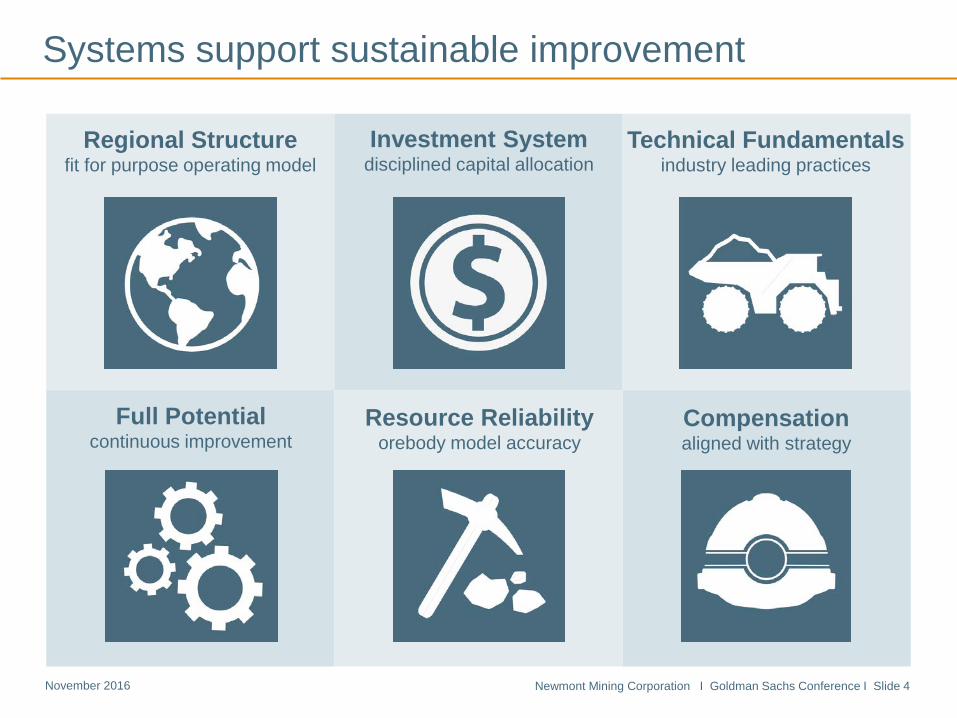
Systems support sustainable improvement
Investment System disciplined capital allocation
Full Potential continuous improvement
Compensation aligned with strategy
Regional Structure fit for purpose operating model
Technical Fundamentals industry leading practices
Resource Reliability orebody model accuracy
Newmont Mining Corporation I Goldman Sachs Conference I Slide 5 November 2016
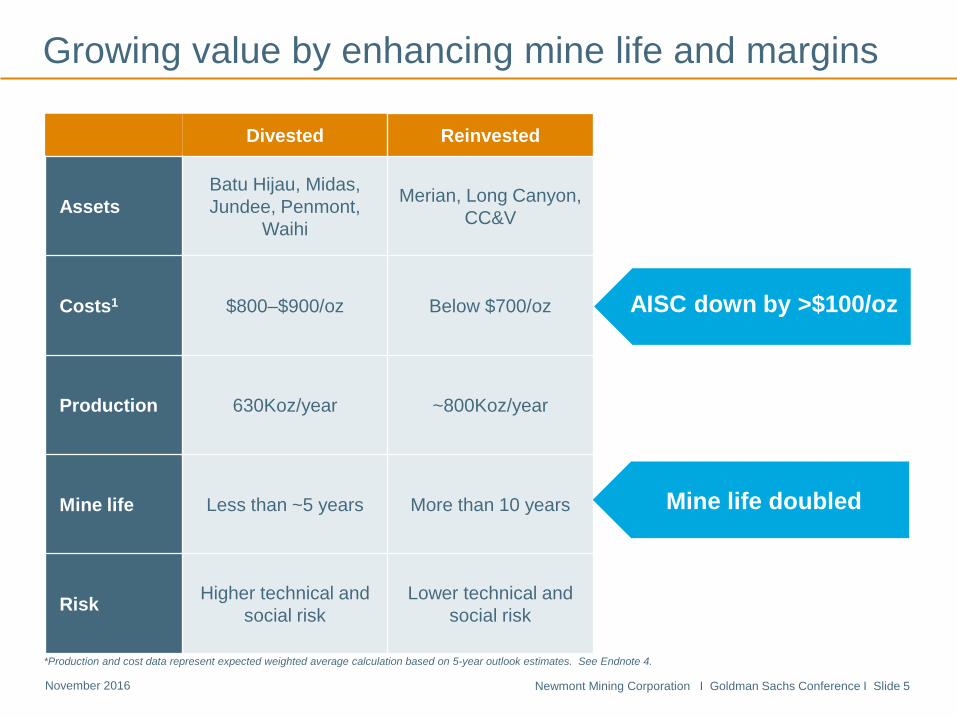
AISC down by >$100/oz
Divested Reinvested
Assets Batu Hijau, Midas, Jundee, Penmont,
Waihi
Merian, Long Canyon, CC&V
Costs1 $800–$900/oz Below $700/oz
Production 630Koz/year ~800Koz/year
Mine life Less than ~5 years More than 10 years
Risk Higher technical and social risk
Lower technical and social risk
Mine life doubled
*Production and cost data represent expected weighted average calculation based on 5-year outlook estimates. See Endnote 4.
Growing value by enhancing mine life and margins
Newmont Mining Corporation I Goldman Sachs Conference I Slide 6 November 2016
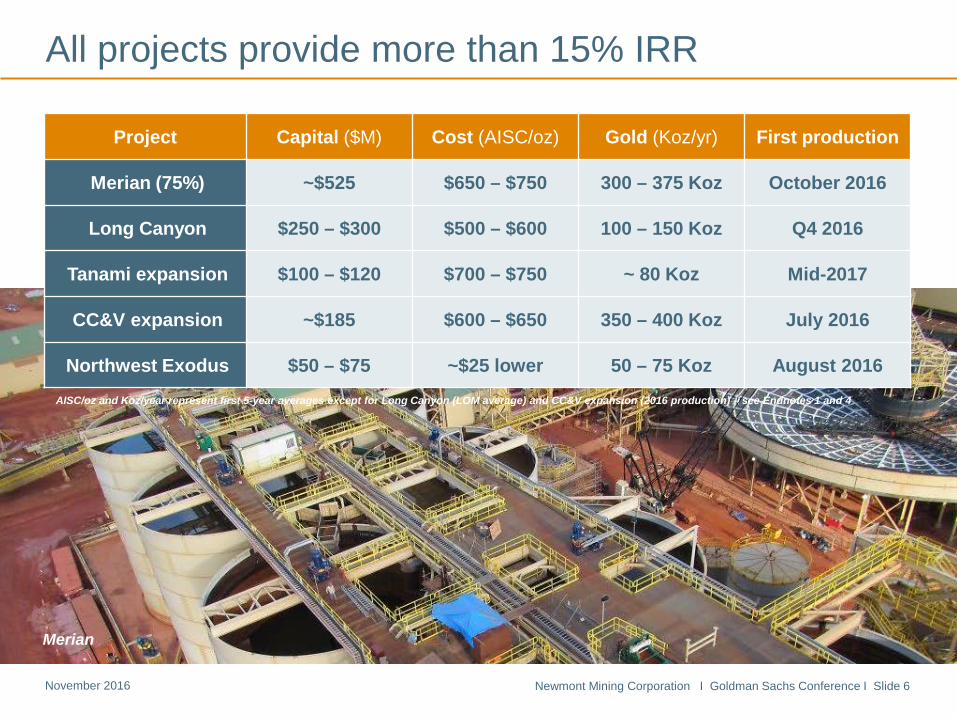
All projects provide more than 15% IRR
Insert picture of CC&V
Merian
AISC/oz and Koz/year represent first 5-year averages except for Long Canyon (LOM average) and CC&V expansion (2016 production) – see Endnotes 1 and 4
Project Capital ($M) Cost (AISC/oz) Gold (Koz/yr) First production
Merian (75%) ~$525 $650 – $750 300 – 375 Koz October 2016
Long Canyon $250 – $300 $500 – $600 100 – 150 Koz Q4 2016
Tanami expansion $100 – $120 $700 – $750 ~ 80 Koz Mid-2017
CC&V expansion ~$185 $600 – $650 350 – 400 Koz July 2016
Northwest Exodus $50 – $75 ~$25 lower 50 – 75 Koz August 2016
Newmont Mining Corporation I Goldman Sachs Conference I Slide 7 November 2016
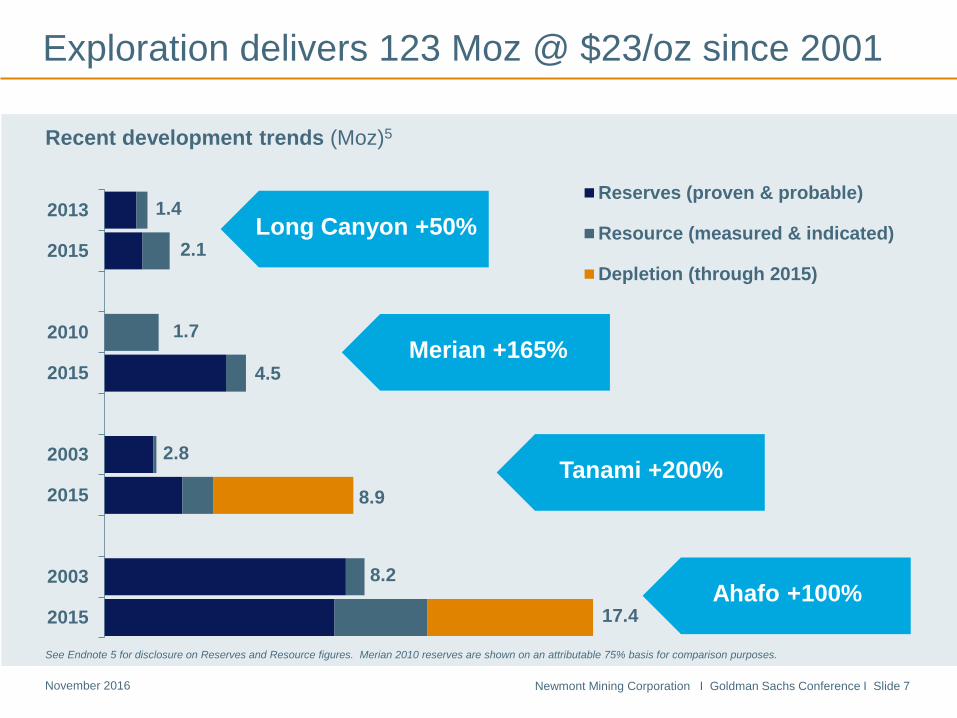
Exploration delivers 123 Moz @ $23/oz since 2001
17.4
8.2
8.9
2.8
4.5
1.7
2.1
1.4
2015
2003
2015
2003
2015
2010
2015
2013Reserves (proven & probable)
Resource (measured & indicated)
Depletion (through 2015)
Recent development trends (Moz)5
Long Canyon +50%
Merian +165%
Tanami +200%
Ahafo +100%
See Endnote 5 for disclosure on Reserves and Resource figures. Merian 2010 reserves are shown on an attributable 75% basis for comparison purposes.
Newmont Mining Corporation I Goldman Sachs Conference I Slide 8 November 2016
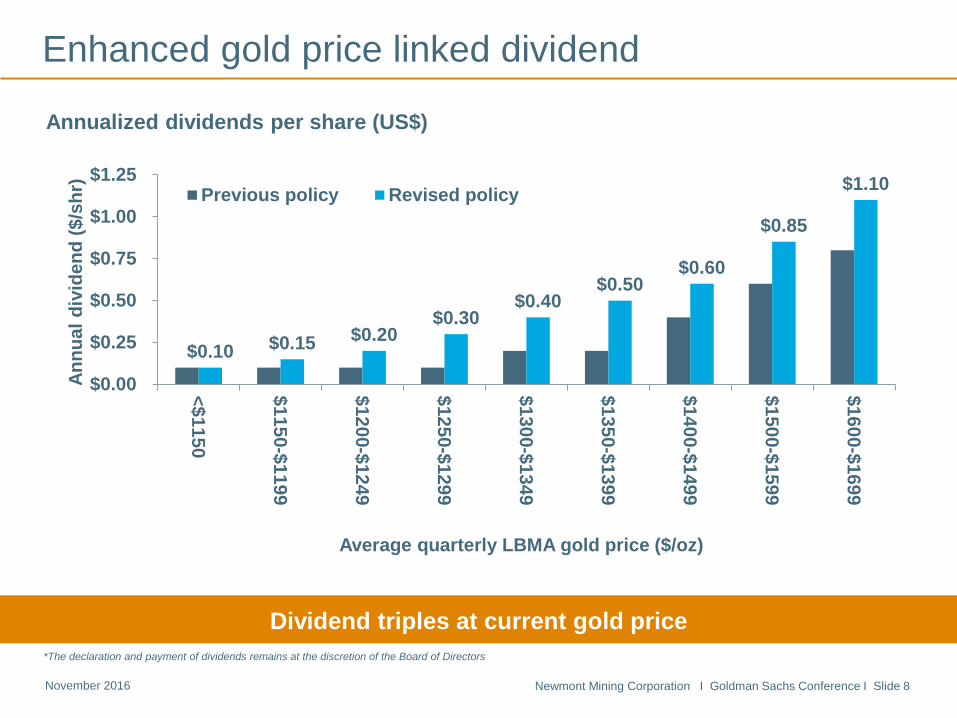
Enhanced gold price linked dividend
Down 30% since 2012
Dividend triples at current gold price
Annualized dividends per share (US$)
*The declaration and payment of dividends remains at the discretion of the Board of Directors
$0.10 $0.15 $0.20 $0.30
$0.40 $0.50
$0.60
$0.85
$1.10
$0.00
$0.25
$0.50
$0.75
$1.00
$1.25
<$1150
$1150-$1199
$1200-$1249
$1250-$1299
$1300-$1349
$1350-$1399
$1400-$1499
$1500-$1599
$1600-$1699An
nual
div
iden
d ($
/shr
)
Average quarterly LBMA gold price ($/oz)
Previous policy Revised policy
Newmont Mining Corporation I Goldman Sachs Conference I Slide 9 November 2016
Convertibles Other corporate debt
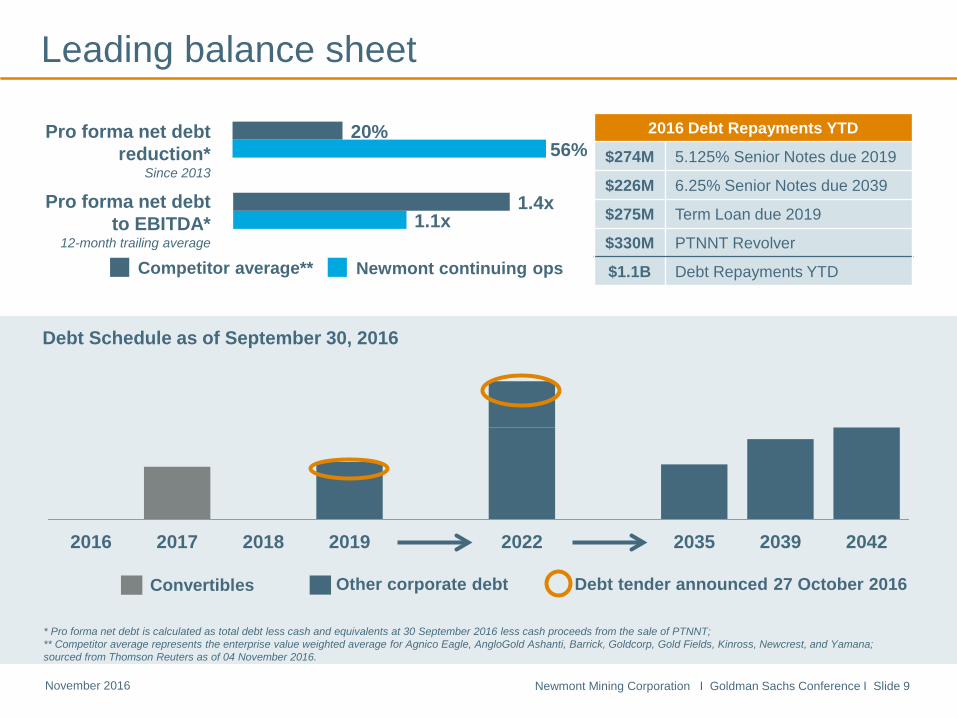
Leading balance sheet
Debt Schedule as of September 30, 2016
Pro forma net debt reduction*
Since 2013
Pro forma net debt to EBITDA*
12-month trailing average
Competitor average** Newmont continuing ops
* Pro forma net debt is calculated as total debt less cash and equivalents at 30 September 2016 less cash proceeds from the sale of PTNNT; ** Competitor average represents the enterprise value weighted average for Agnico Eagle, AngloGold Ashanti, Barrick, Goldcorp, Gold Fields, Kinross, Newcrest, and Yamana; sourced from Thomson Reuters as of 04 November 2016.
2016 Debt Repayments YTD
$274M 5.125% Senior Notes due 2019
$226M 6.25% Senior Notes due 2039
$275M Term Loan due 2019
$330M PTNNT Revolver
$1.1B Debt Repayments YTD
2016 2017 2018 2019 2022 2035 2039 2042
Debt tender announced 27 October 2016
56% 20%
1.1x 1.4x
Newmont Mining Corporation I Goldman Sachs Conference I Slide 10 November 2016
Goldcorp
Average
Barrick
Randgold
AngloG
old
Kinross
Gold Fields
New
crest
Agnico
Yamana
New
mont
without B
atu
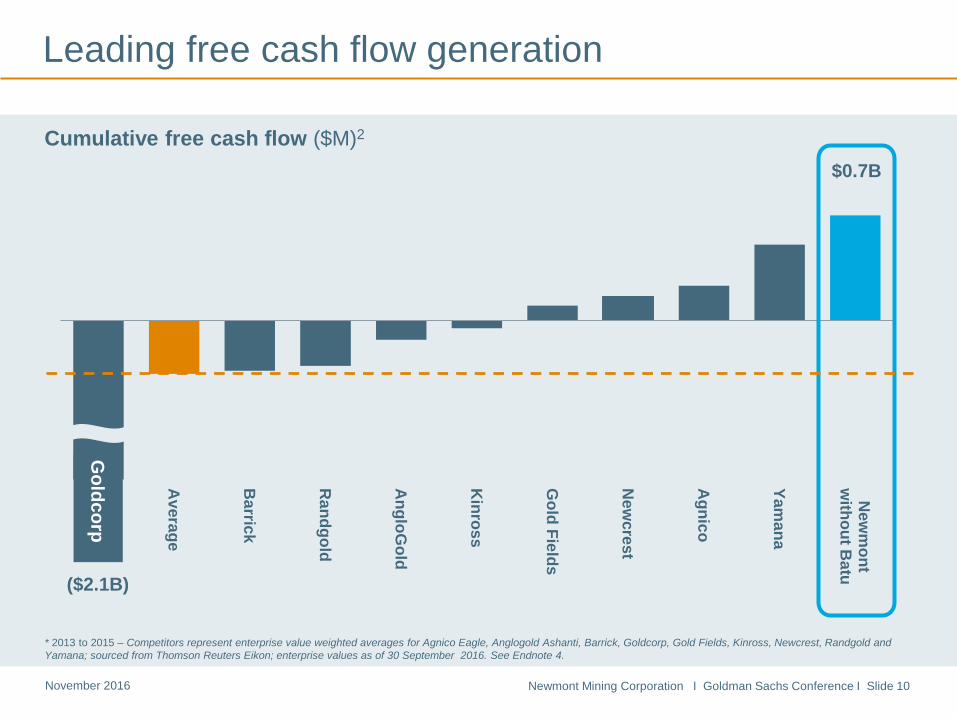
Leading free cash flow generation
* 2013 to 2015 – Competitors represent enterprise value weighted averages for Agnico Eagle, Anglogold Ashanti, Barrick, Goldcorp, Gold Fields, Kinross, Newcrest, Randgold and Yamana; sourced from Thomson Reuters Eikon; enterprise values as of 30 September 2016. See Endnote 4.
Cumulative free cash flow ($M)2
($2.1B)
$0.7B
Goldcorp
Appendix
Newmont Mining Corporation I Goldman Sachs Conference I Slide 12 November 2016
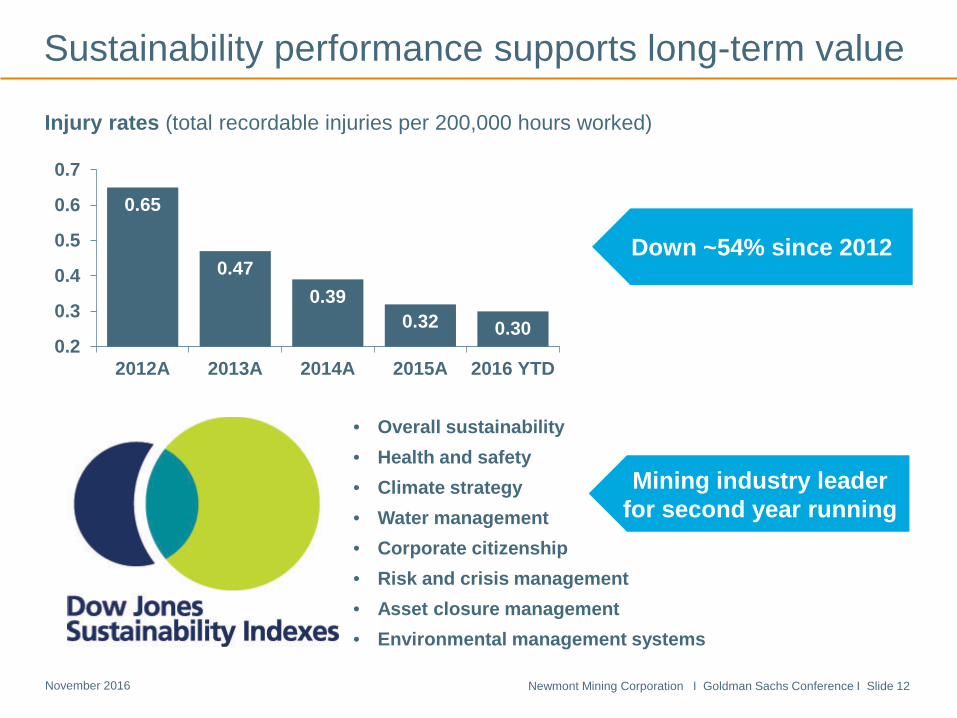
0.65
0.47 0.39
0.32 0.30 0.2
0.3
0.4
0.5
0.6
0.7
2012A 2013A 2014A 2015A 2016 YTD
Sustainability performance supports long-term value
Injury rates (total recordable injuries per 200,000 hours worked)
Down ~54% since 2012
Mining industry leader for second year running
• Overall sustainability • Health and safety • Climate strategy • Water management • Corporate citizenship • Risk and crisis management • Asset closure management • Environmental management systems
Newmont Mining Corporation I Goldman Sachs Conference I Slide 13 November 2016
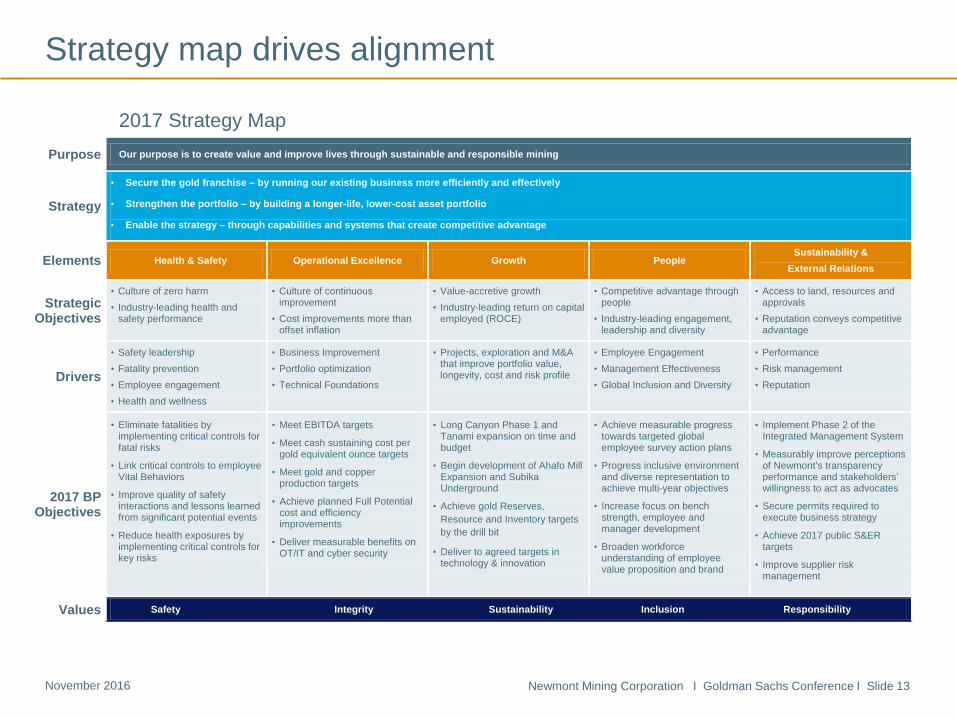
Strategy map drives alignment
2017 Strategy Map Purpose Our purpose is to create value and improve lives through sustainable and responsible mining
Strategy
• Secure the gold franchise – by running our existing business more efficiently and effectively
• Strengthen the portfolio – by building a longer-life, lower-cost asset portfolio
• Enable the strategy – through capabilities and systems that create competitive advantage
Elements Health & Safety Operational Excellence Growth People Sustainability &
External Relations
Strategic Objectives
• Culture of zero harm • Industry-leading health and
safety performance
• Culture of continuous improvement
• Cost improvements more than offset inflation
• Value-accretive growth • Industry-leading return on capital
employed (ROCE)
• Competitive advantage through people
• Industry-leading engagement, leadership and diversity
• Access to land, resources and approvals
• Reputation conveys competitive advantage
Drivers
• Safety leadership • Fatality prevention • Employee engagement • Health and wellness
• Business Improvement • Portfolio optimization • Technical Foundations
• Projects, exploration and M&A that improve portfolio value, longevity, cost and risk profile
• Employee Engagement • Management Effectiveness • Global Inclusion and Diversity
• Performance • Risk management • Reputation
2017 BP Objectives
• Eliminate fatalities by implementing critical controls for fatal risks
• Link critical controls to employee Vital Behaviors
• Improve quality of safety interactions and lessons learned from significant potential events
• Reduce health exposures by implementing critical controls for key risks
• Meet EBITDA targets
• Meet cash sustaining cost per gold equivalent ounce targets
• Meet gold and copper production targets
• Achieve planned Full Potential cost and efficiency improvements
• Deliver measurable benefits on OT/IT and cyber security
• Long Canyon Phase 1 and Tanami expansion on time and budget
• Begin development of Ahafo Mill Expansion and Subika Underground
• Achieve gold Reserves, Resource and Inventory targets by the drill bit
• Deliver to agreed targets in technology & innovation
• Achieve measurable progress towards targeted global employee survey action plans
• Progress inclusive environment and diverse representation to achieve multi-year objectives
• Increase focus on bench strength, employee and manager development
• Broaden workforce understanding of employee value proposition and brand
• Implement Phase 2 of the Integrated Management System
• Measurably improve perceptions of Newmont’s transparency performance and stakeholders’ willingness to act as advocates
• Secure permits required to execute business strategy
• Achieve 2017 public S&ER targets
• Improve supplier risk management
Values Safety Integrity Sustainability Inclusion Responsibility
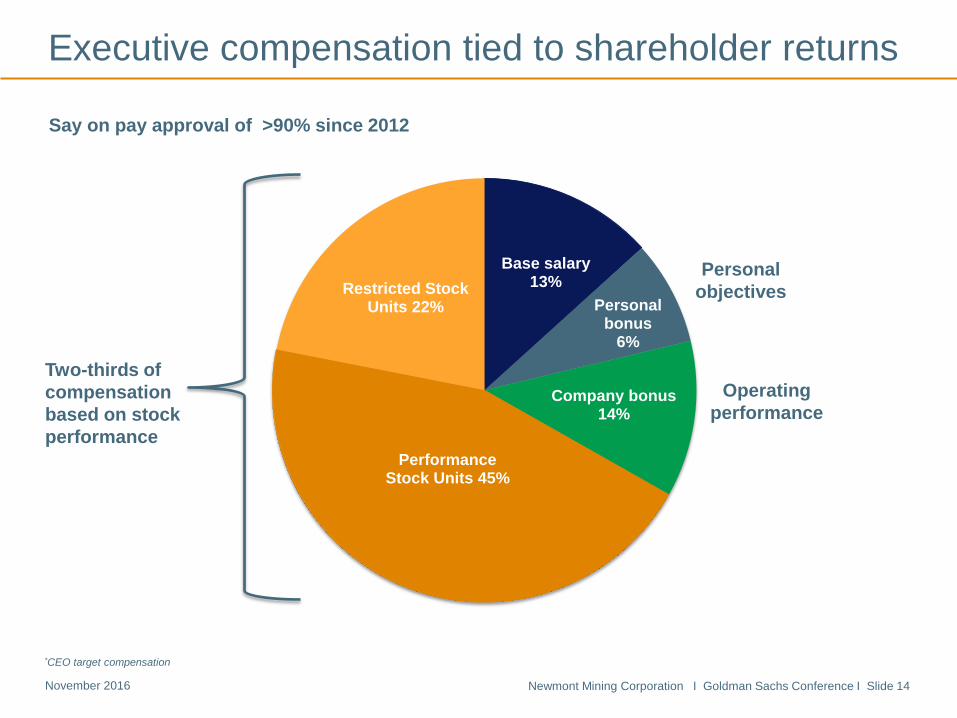
Newmont Mining Corporation I Goldman Sachs Conference I Slide 14 November 2016
Base salary 13%
Personal bonus
6%
Company bonus 14%
Performance Stock Units 45%
Restricted Stock Units 22%
Personal objectives
Two-thirds of compensation based on stock performance
Operating performance
Say on pay approval of >90% since 2012
Executive compensation tied to shareholder returns
*CEO target compensation
Newmont Mining Corporation I Goldman Sachs Conference I Slide 15 November 2016
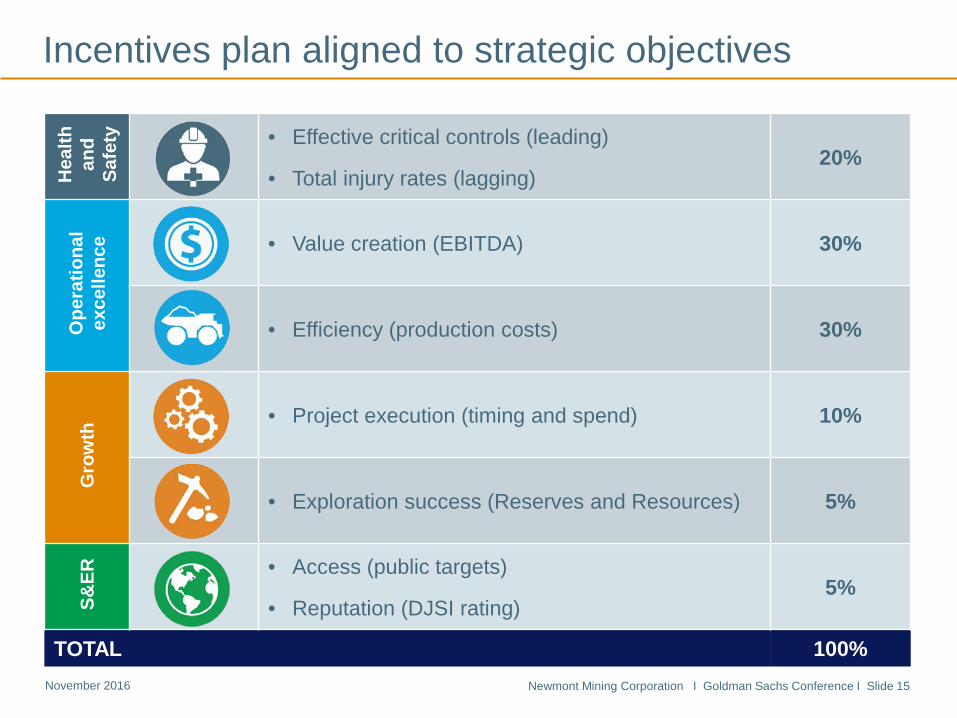
Incentives plan aligned to strategic objectives H
ealth
an
d Sa
fety
• Effective critical controls (leading)
• Total injury rates (lagging) 20%
Ope
ratio
nal
exce
llenc
e • Value creation (EBITDA) 30%
• Efficiency (production costs) 30%
Gro
wth
• Project execution (timing and spend) 10%
• Exploration success (Reserves and Resources) 5%
S&ER
• Access (public targets)
• Reputation (DJSI rating) 5%
TOTAL 100%
Newmont Mining Corporation I Goldman Sachs Conference I Slide 16 November 2016
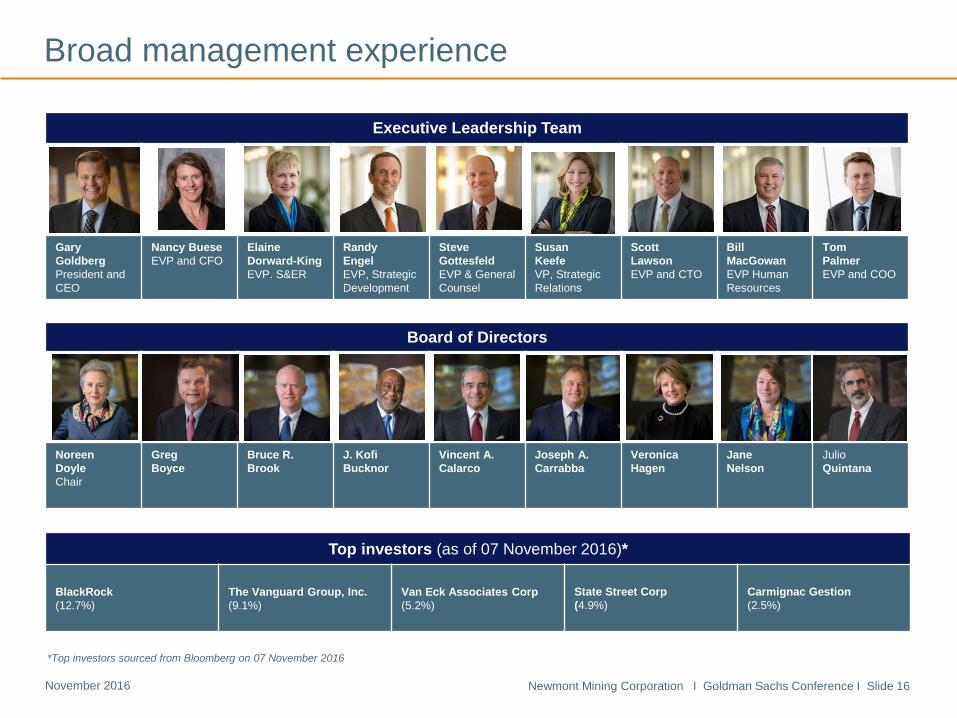
Executive Leadership Team
Gary Goldberg President and CEO
Nancy Buese EVP and CFO
Elaine Dorward-King EVP. S&ER
Randy Engel EVP, Strategic Development
Steve Gottesfeld EVP & General Counsel
Susan Keefe VP, Strategic Relations
Scott Lawson EVP and CTO
Bill MacGowan EVP Human Resources
Tom Palmer EVP and COO
Broad management experience
Board of Directors
Noreen Doyle Chair
Greg Boyce
Bruce R. Brook
J. Kofi Bucknor
Vincent A. Calarco
Joseph A. Carrabba
Veronica Hagen
Jane Nelson
Julio Quintana
Top investors (as of 07 November 2016)*
BlackRock (12.7%)
The Vanguard Group, Inc. (9.1%)
Van Eck Associates Corp (5.2%)
State Street Corp (4.9%)
Carmignac Gestion (2.5%)
*Top investors sourced from Bloomberg on 07 November 2016
Newmont Mining Corporation I Goldman Sachs Conference I Slide 17 November 2016
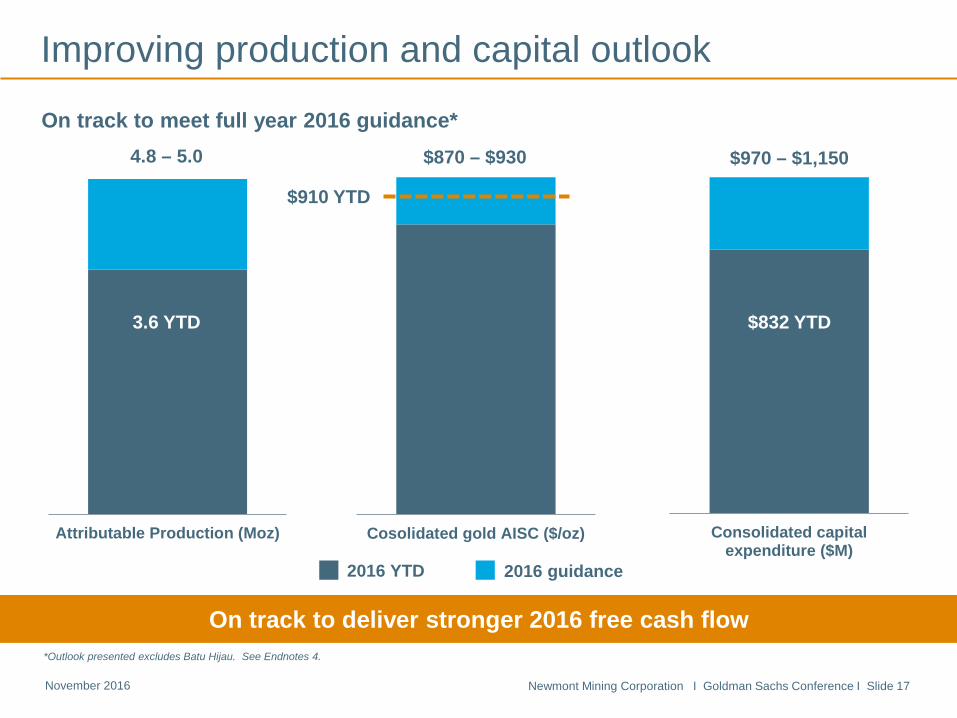
Improving production and capital outlook
On track to deliver stronger 2016 free cash flow *Outlook presented excludes Batu Hijau. See Endnotes 4.
Attributable Production (Moz) Cosolidated gold AISC ($/oz) Consolidated capitalexpenditure ($M)
$970 – $1,150
$832 YTD
$910 YTD
3.6 YTD
$870 – $930 4.8 – 5.0
On track to meet full year 2016 guidance*
2016 YTD 2016 guidance
Newmont Mining Corporation I Goldman Sachs Conference I Slide 18 November 2016
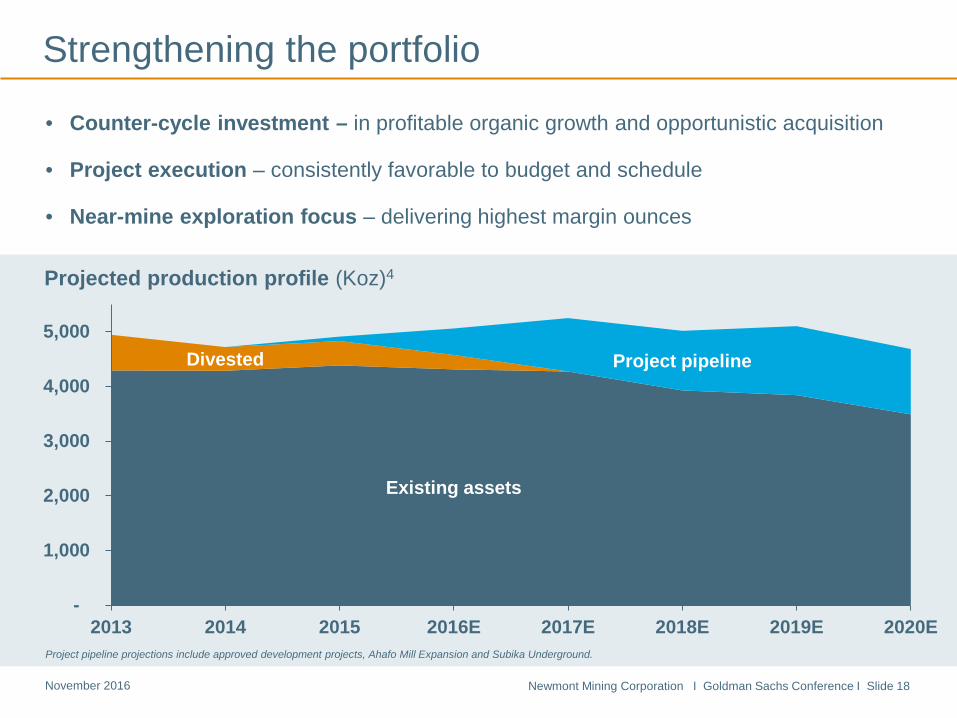
Existing assets
Divested Project pipeline
-
1,000
2,000
3,000
4,000
5,000
2013 2014 2015 2016E 2017E 2018E 2019E 2020E
Projected production profile (Koz)4
• Counter-cycle investment – in profitable organic growth and opportunistic acquisition
• Project execution – consistently favorable to budget and schedule
• Near-mine exploration focus – delivering highest margin ounces
Strengthening the portfolio
Project pipeline projections include approved development projects, Ahafo Mill Expansion and Subika Underground.
Newmont Mining Corporation I Goldman Sachs Conference I Slide 19 November 2016
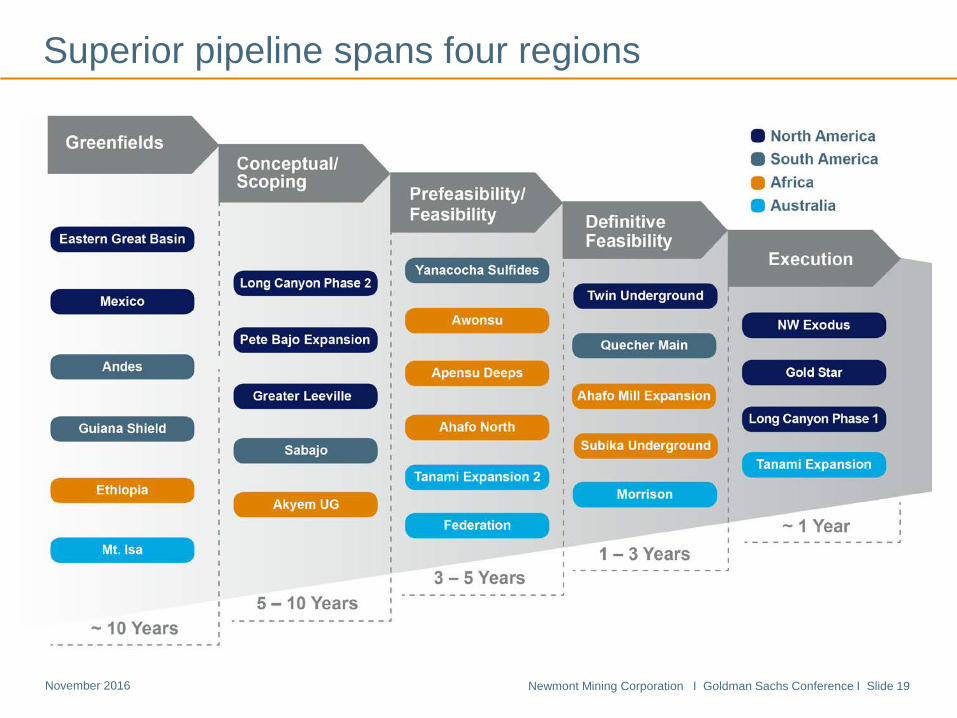
Superior pipeline spans four regions
Newmont Mining Corporation I Goldman Sachs Conference I Slide 20 November 2016
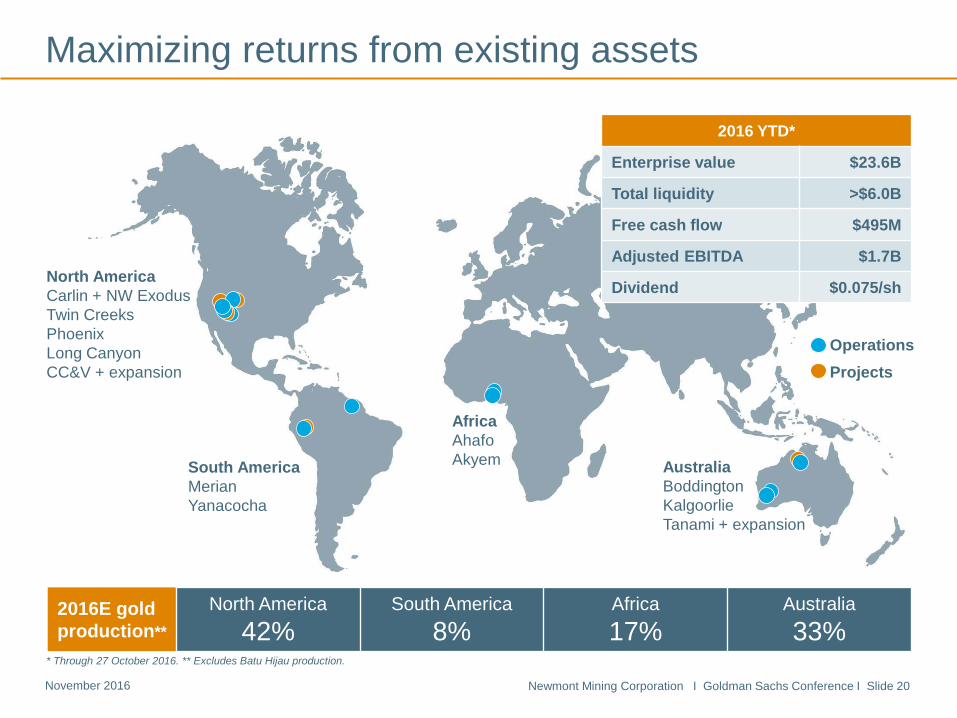
* Through 27 October 2016. ** Excludes Batu Hijau production.
Operations Projects
North America Carlin + NW Exodus Twin Creeks Phoenix Long Canyon CC&V + expansion
South America Merian Yanacocha
Africa Ahafo Akyem Australia
Boddington Kalgoorlie Tanami + expansion
2016E gold production**
North America 42%
South America 8%
Africa 17%
Australia 33%
Maximizing returns from existing assets
2016 YTD*
Enterprise value $23.6B
Total liquidity >$6.0B
Free cash flow $495M
Adjusted EBITDA $1.7B
Dividend $0.075/sh
Newmont Mining Corporation I Goldman Sachs Conference I Slide 21 November 2016
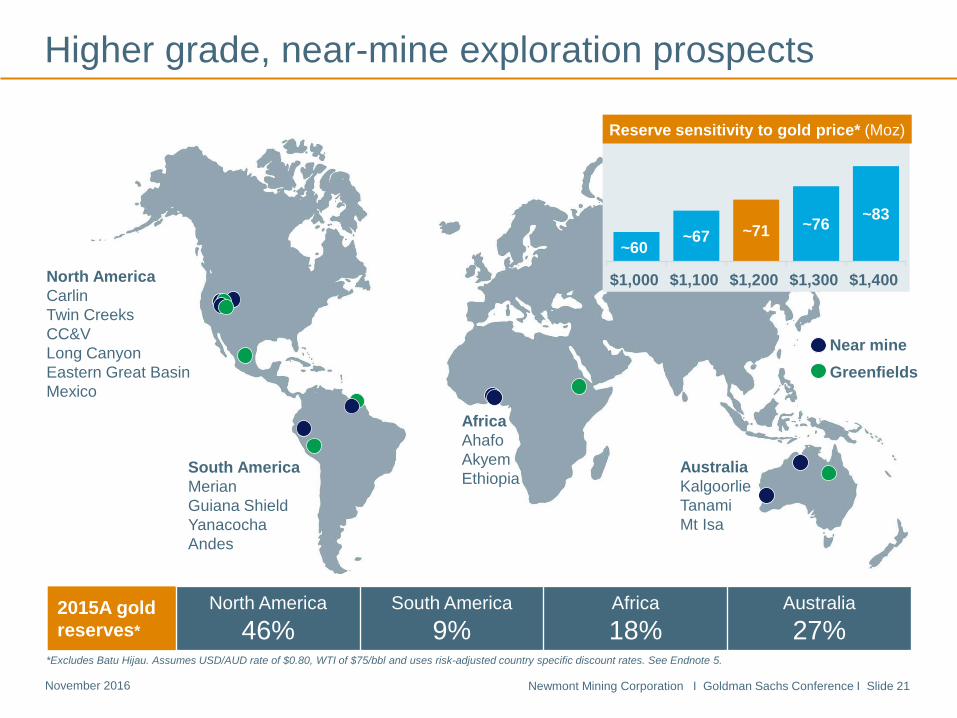
~60 ~67 ~71 ~76 ~83
$1,000 $1,100 $1,200 $1,300 $1,400
Near mine Greenfields
North America Carlin Twin Creeks CC&V Long Canyon Eastern Great Basin Mexico
Africa Ahafo Akyem Ethiopia
Australia Kalgoorlie Tanami Mt Isa
2015A gold reserves*
North America 46%
South America 9%
Africa 18%
Australia 27%
Reserve sensitivity to gold price* (Moz)
Higher grade, near-mine exploration prospects
South America Merian Guiana Shield Yanacocha Andes
*Excludes Batu Hijau. Assumes USD/AUD rate of $0.80, WTI of $75/bbl and uses risk-adjusted country specific discount rates. See Endnote 5.
Newmont Mining Corporation I Goldman Sachs Conference I Slide 22 November 2016
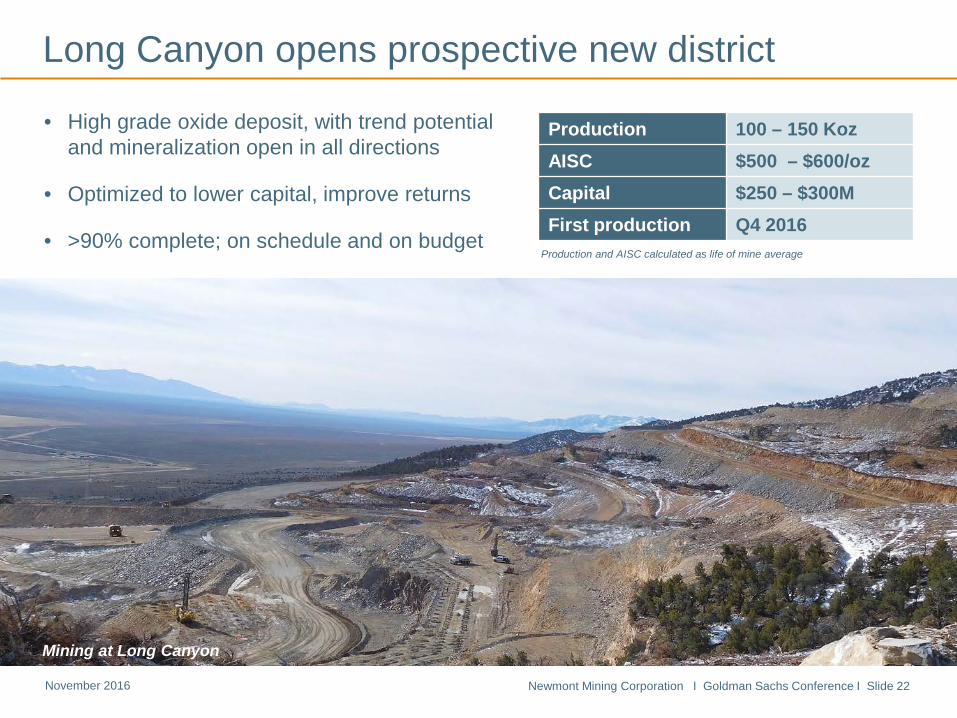
Long Canyon opens prospective new district
• High grade oxide deposit, with trend potential and mineralization open in all directions
• Optimized to lower capital, improve returns
• >90% complete; on schedule and on budget
Production 100 – 150 Koz AISC $500 – $600/oz Capital $250 – $300M First production Q4 2016
Production and AISC calculated as life of mine average
Mining at Long Canyon
Newmont Mining Corporation I Goldman Sachs Conference I Slide 23 November 2016
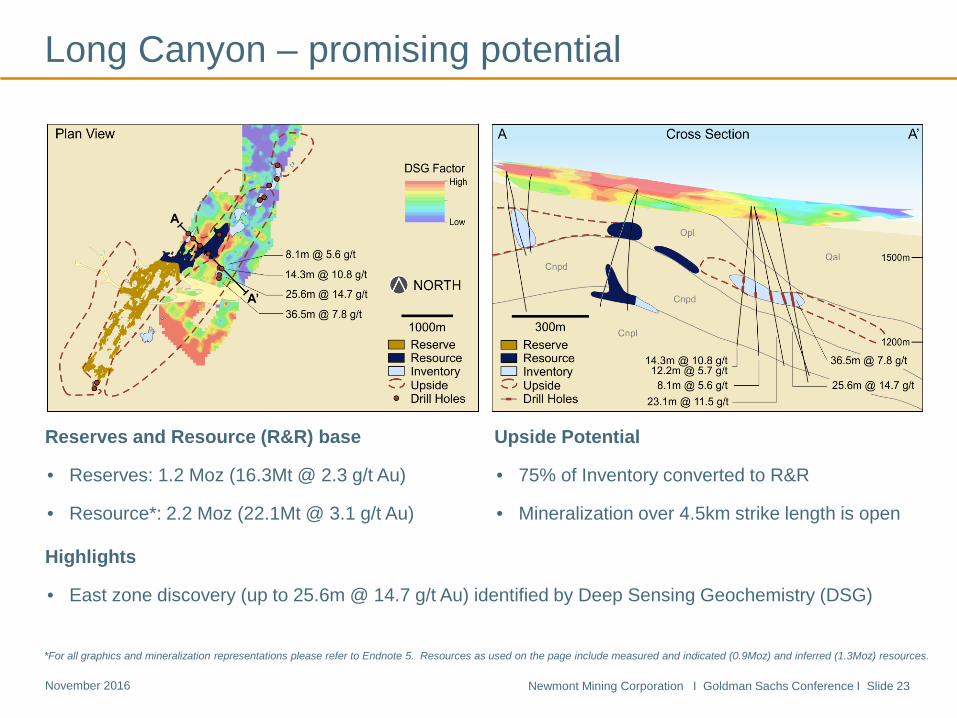
Long Canyon – promising potential
Upside Potential
• 75% of Inventory converted to R&R
• Mineralization over 4.5km strike length is open
Highlights
• East zone discovery (up to 25.6m @ 14.7 g/t Au) identified by Deep Sensing Geochemistry (DSG)
Reserves and Resource (R&R) base
• Reserves: 1.2 Moz (16.3Mt @ 2.3 g/t Au)
• Resource*: 2.2 Moz (22.1Mt @ 3.1 g/t Au)
*For all graphics and mineralization representations please refer to Endnote 5. Resources as used on the page include measured and indicated (0.9Moz) and inferred (1.3Moz) resources.
Newmont Mining Corporation I Goldman Sachs Conference I Slide 24 November 2016
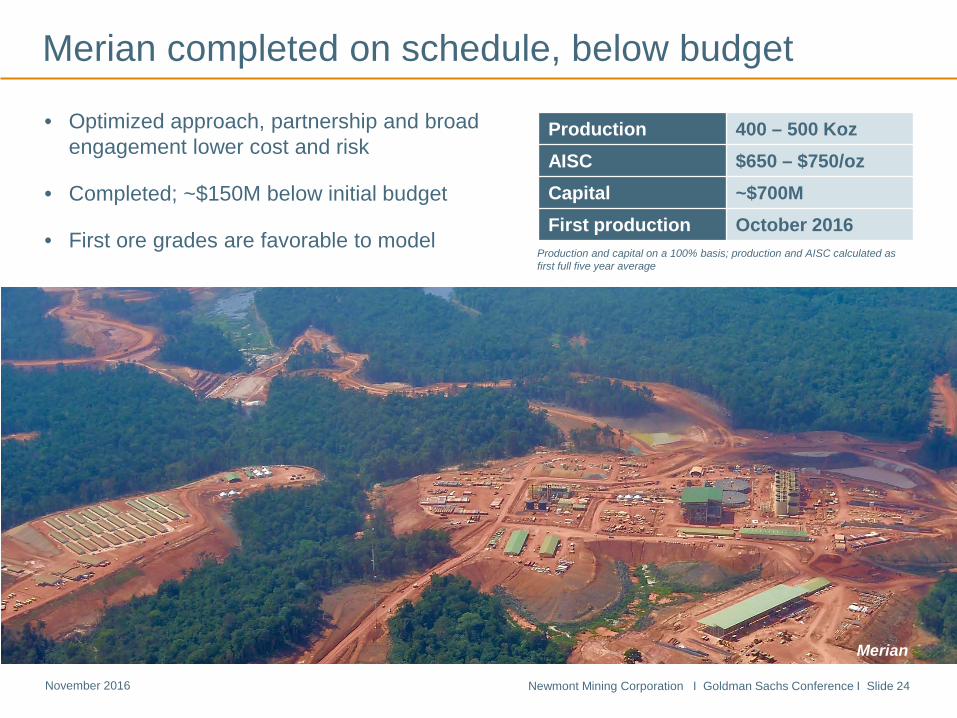
Merian completed on schedule, below budget
• Optimized approach, partnership and broad engagement lower cost and risk
• Completed; ~$150M below initial budget
• First ore grades are favorable to model
Production and capital on a 100% basis; production and AISC calculated as first full five year average
Production 400 – 500 Koz AISC $650 – $750/oz Capital ~$700M First production October 2016
Merian
Newmont Mining Corporation I Goldman Sachs Conference I Slide 25 November 2016
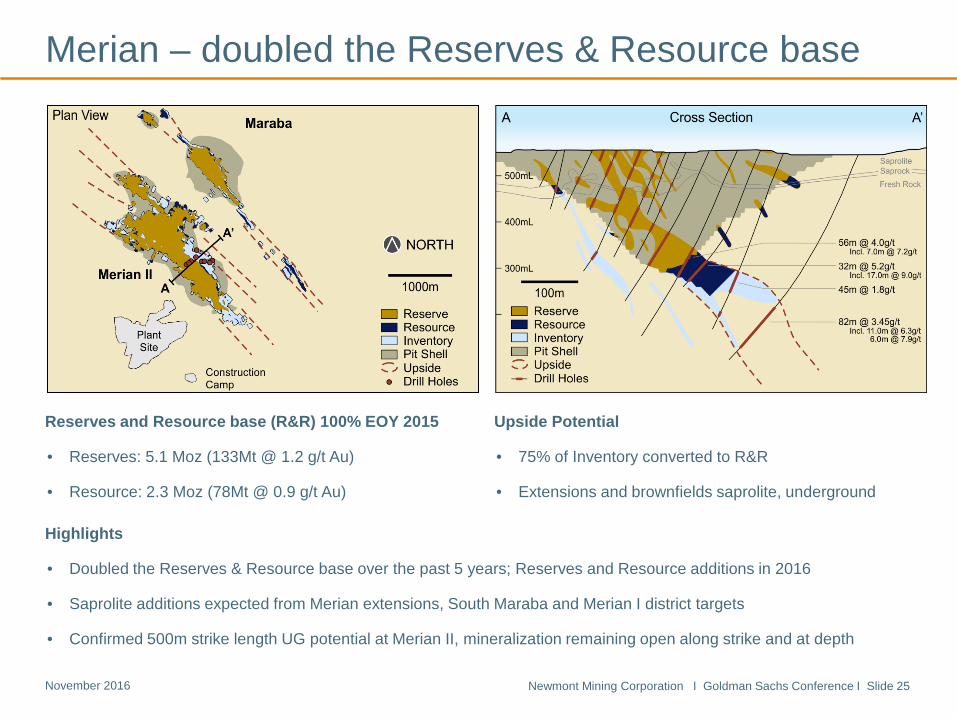
Merian – doubled the Reserves & Resource base
Reserves and Resource base (R&R) 100% EOY 2015
• Reserves: 5.1 Moz (133Mt @ 1.2 g/t Au)
• Resource: 2.3 Moz (78Mt @ 0.9 g/t Au)
Upside Potential
• 75% of Inventory converted to R&R
• Extensions and brownfields saprolite, underground
Highlights
• Doubled the Reserves & Resource base over the past 5 years; Reserves and Resource additions in 2016
• Saprolite additions expected from Merian extensions, South Maraba and Merian I district targets
• Confirmed 500m strike length UG potential at Merian II, mineralization remaining open along strike and at depth
Newmont Mining Corporation I Goldman Sachs Conference I Slide 26 November 2016
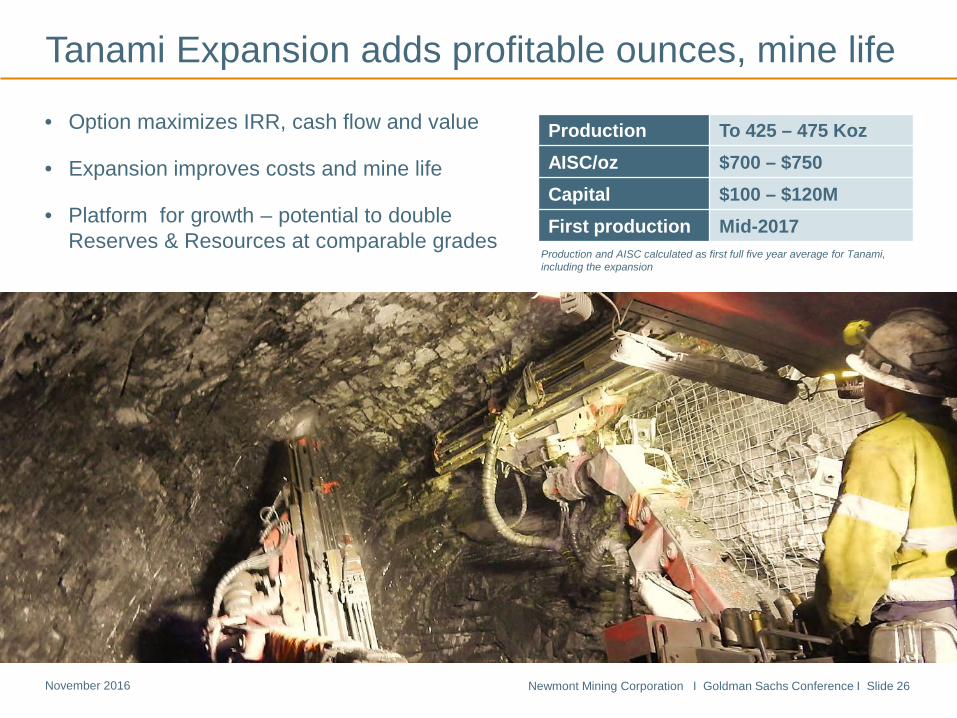
• Option maximizes IRR, cash flow and value
• Expansion improves costs and mine life
• Platform for growth – potential to double Reserves & Resources at comparable grades
Tanami Expansion adds profitable ounces, mine life
Cripple Creek & Victor
Production To 425 – 475 Koz AISC/oz $700 – $750 Capital $100 – $120M First production Mid-2017
Production and AISC calculated as first full five year average for Tanami, including the expansion
Newmont Mining Corporation I Goldman Sachs Conference I Slide 27 November 2016
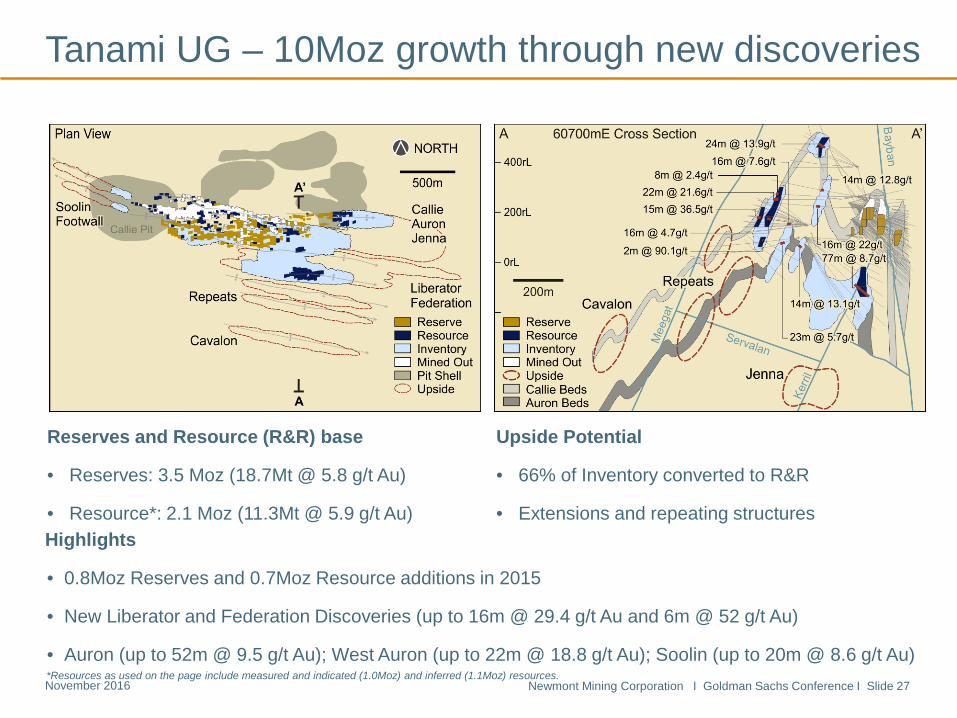
Highlights
• 0.8Moz Reserves and 0.7Moz Resource additions in 2015
• New Liberator and Federation Discoveries (up to 16m @ 29.4 g/t Au and 6m @ 52 g/t Au)
• Auron (up to 52m @ 9.5 g/t Au); West Auron (up to 22m @ 18.8 g/t Au); Soolin (up to 20m @ 8.6 g/t Au)
Tanami UG – 10Moz growth through new discoveries
Reserves and Resource (R&R) base
• Reserves: 3.5 Moz (18.7Mt @ 5.8 g/t Au)
• Resource*: 2.1 Moz (11.3Mt @ 5.9 g/t Au)
Upside Potential
• 66% of Inventory converted to R&R
• Extensions and repeating structures
*Resources as used on the page include measured and indicated (1.0Moz) and inferred (1.1Moz) resources.
Newmont Mining Corporation I Goldman Sachs Conference I Slide 28 November 2016
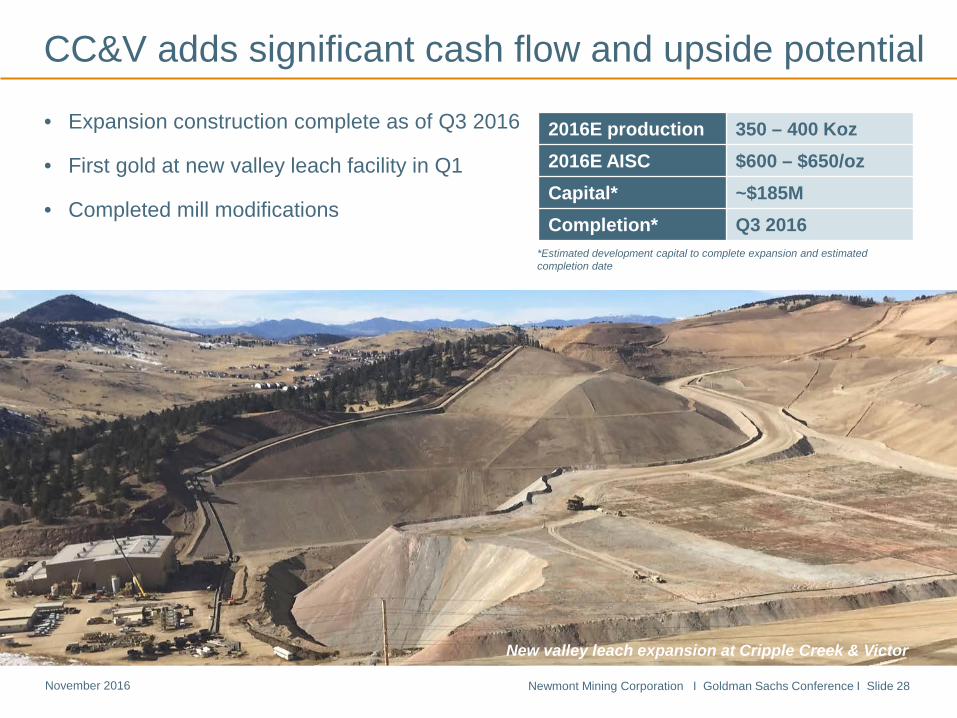
CC&V adds significant cash flow and upside potential
• Expansion construction complete as of Q3 2016
• First gold at new valley leach facility in Q1
• Completed mill modifications
New valley leach expansion at Cripple Creek & Victor
*Estimated development capital to complete expansion and estimated completion date
2016E production 350 – 400 Koz 2016E AISC $600 – $650/oz Capital* ~$185M Completion* Q3 2016
Newmont Mining Corporation I Goldman Sachs Conference I Slide 29 November 2016
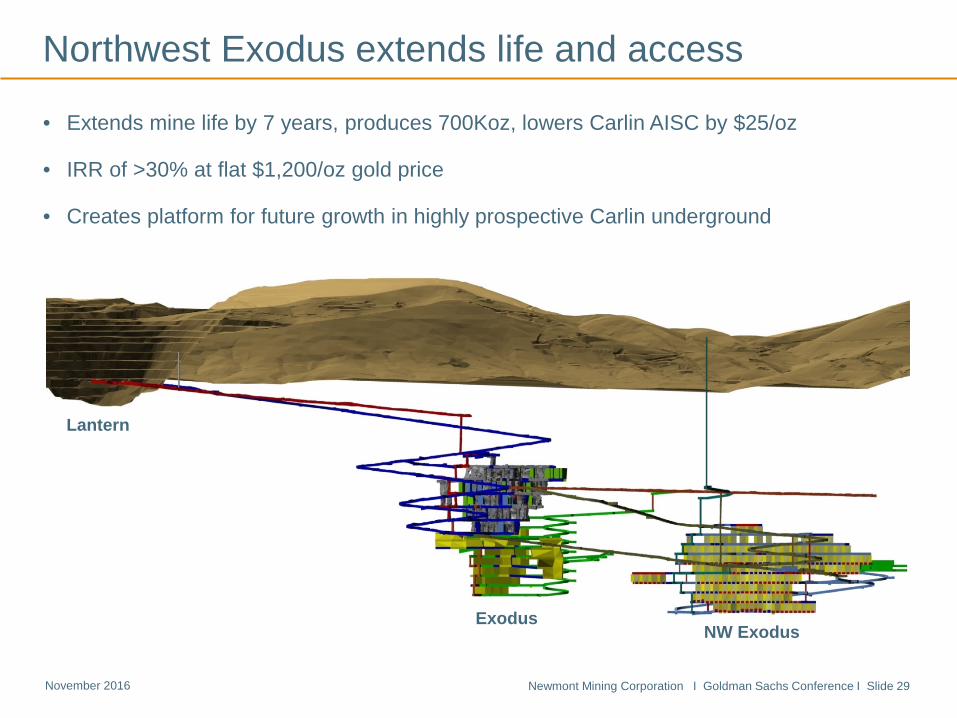
Northwest Exodus extends life and access
• Extends mine life by 7 years, produces 700Koz, lowers Carlin AISC by $25/oz
• IRR of >30% at flat $1,200/oz gold price
• Creates platform for future growth in highly prospective Carlin underground
Lantern
Exodus NW Exodus
Newmont Mining Corporation I Goldman Sachs Conference I Slide 30 November 2016
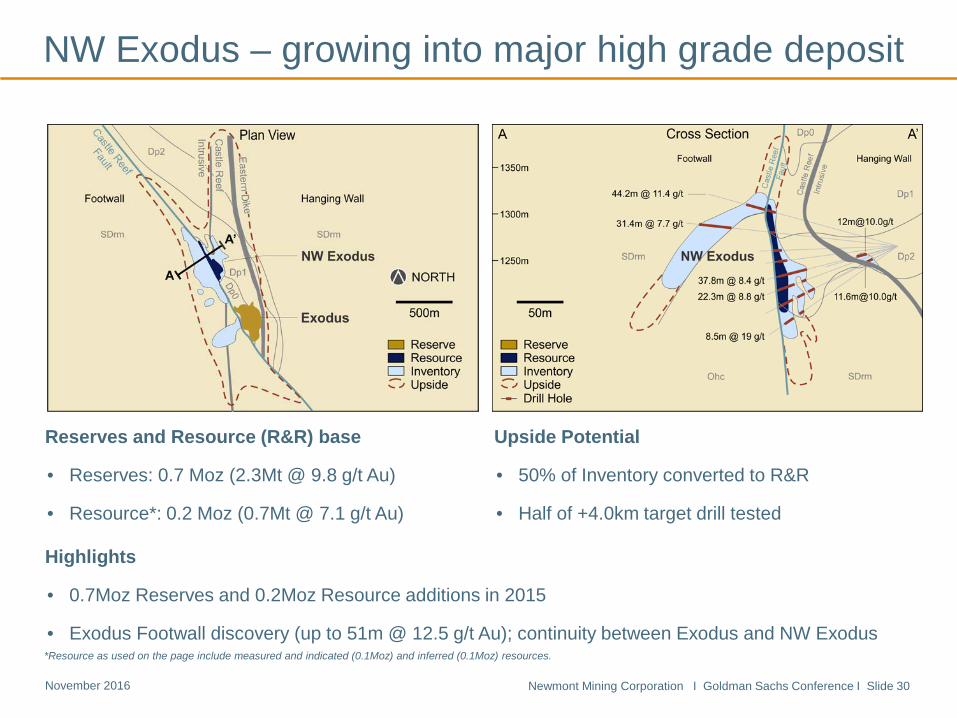
Highlights
• 0.7Moz Reserves and 0.2Moz Resource additions in 2015
• Exodus Footwall discovery (up to 51m @ 12.5 g/t Au); continuity between Exodus and NW Exodus
Reserves and Resource (R&R) base
• Reserves: 0.7 Moz (2.3Mt @ 9.8 g/t Au)
• Resource*: 0.2 Moz (0.7Mt @ 7.1 g/t Au)
Upside Potential
• 50% of Inventory converted to R&R
• Half of +4.0km target drill tested
NW Exodus – growing into major high grade deposit
*Resource as used on the page include measured and indicated (0.1Moz) and inferred (0.1Moz) resources.
Newmont Mining Corporation I Goldman Sachs Conference I Slide 31 November 2016
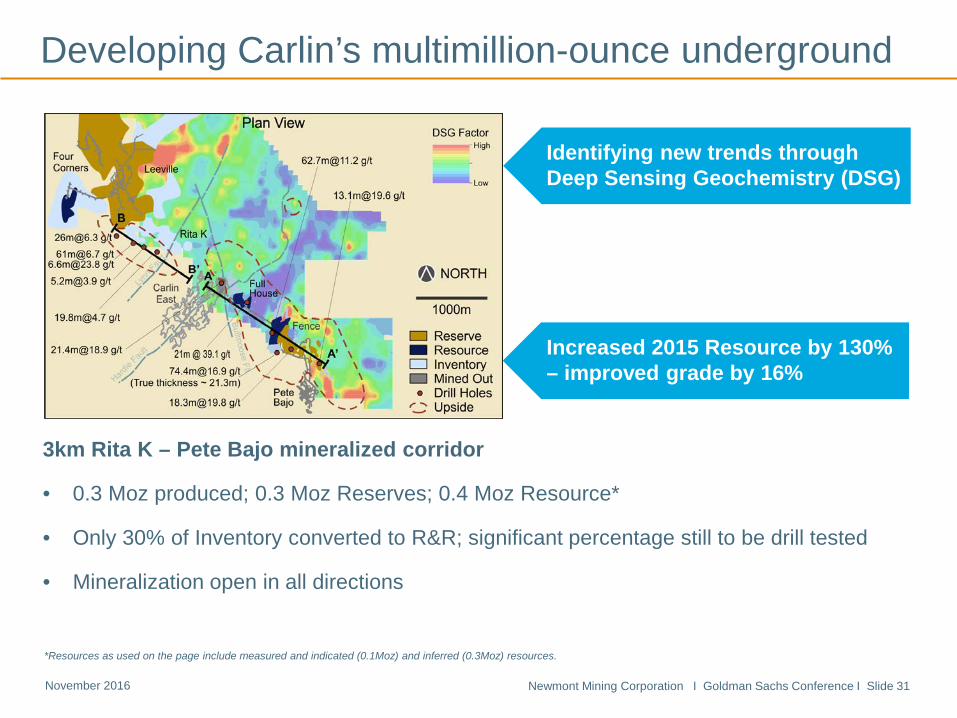
3km Rita K – Pete Bajo mineralized corridor
• 0.3 Moz produced; 0.3 Moz Reserves; 0.4 Moz Resource*
• Only 30% of Inventory converted to R&R; significant percentage still to be drill tested
• Mineralization open in all directions
Developing Carlin’s multimillion-ounce underground
Identifying new trends through Deep Sensing Geochemistry (DSG)
Increased 2015 Resource by 130% – improved grade by 16%
*Resources as used on the page include measured and indicated (0.1Moz) and inferred (0.3Moz) resources.
Newmont Mining Corporation I Goldman Sachs Conference I Slide 32 November 2016
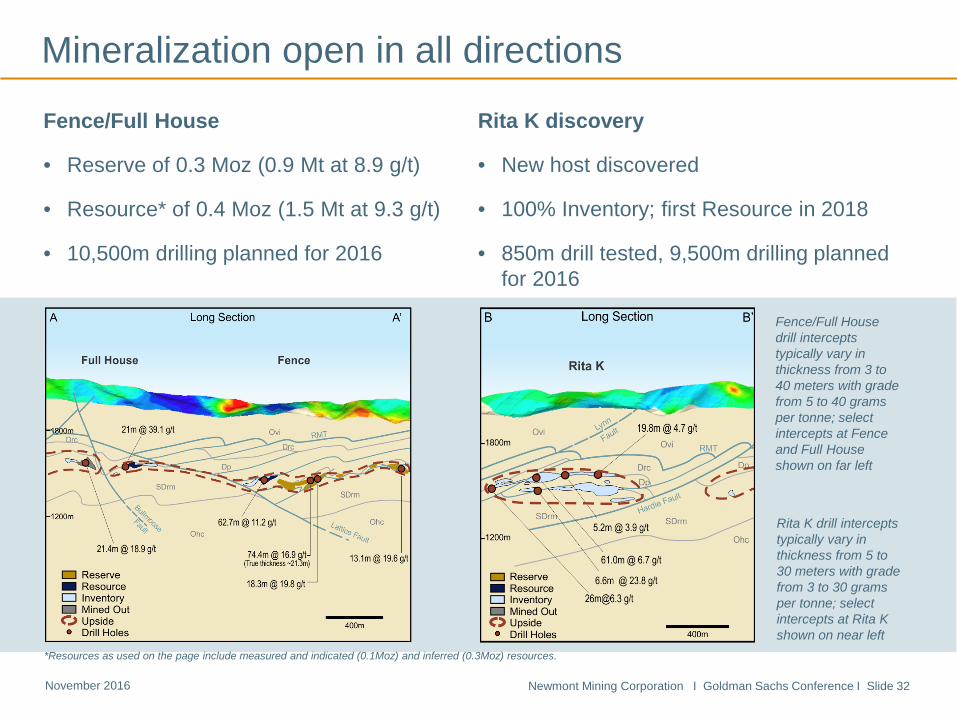
Fence/Full House
• Reserve of 0.3 Moz (0.9 Mt at 8.9 g/t)
• Resource* of 0.4 Moz (1.5 Mt at 9.3 g/t)
• 10,500m drilling planned for 2016
Fence/Full House drill intercepts typically vary in thickness from 3 to 40 meters with grade from 5 to 40 grams per tonne; select intercepts at Fence and Full House shown on far left
Mineralization open in all directions
Rita K drill intercepts typically vary in thickness from 5 to 30 meters with grade from 3 to 30 grams per tonne; select intercepts at Rita K shown on near left
Rita K discovery
• New host discovered
• 100% Inventory; first Resource in 2018
• 850m drill tested, 9,500m drilling planned for 2016
*Resources as used on the page include measured and indicated (0.1Moz) and inferred (0.3Moz) resources.
Newmont Mining Corporation I Goldman Sachs Conference I Slide 33 November 2016
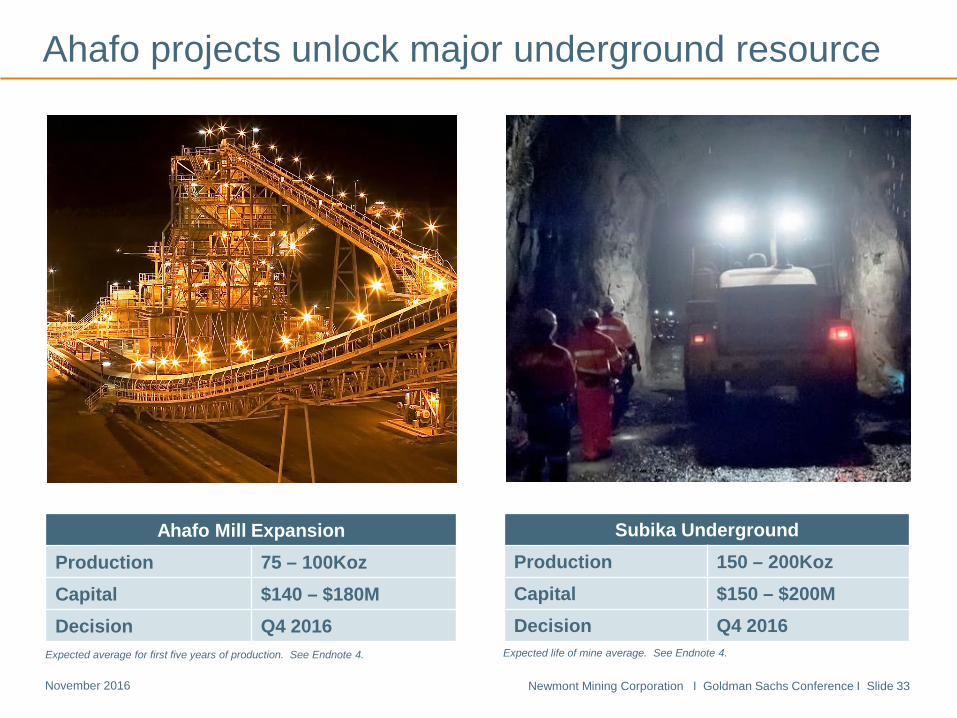
Ahafo Mill Expansion Production 75 – 100Koz Capital $140 – $180M Decision Q4 2016
Subika Underground Production 150 – 200Koz
Capital $150 – $200M Decision Q4 2016
Expected average for first five years of production. See Endnote 4. Expected life of mine average. See Endnote 4.
Ahafo projects unlock major underground resource
Newmont Mining Corporation I Goldman Sachs Conference I Slide 34 November 2016
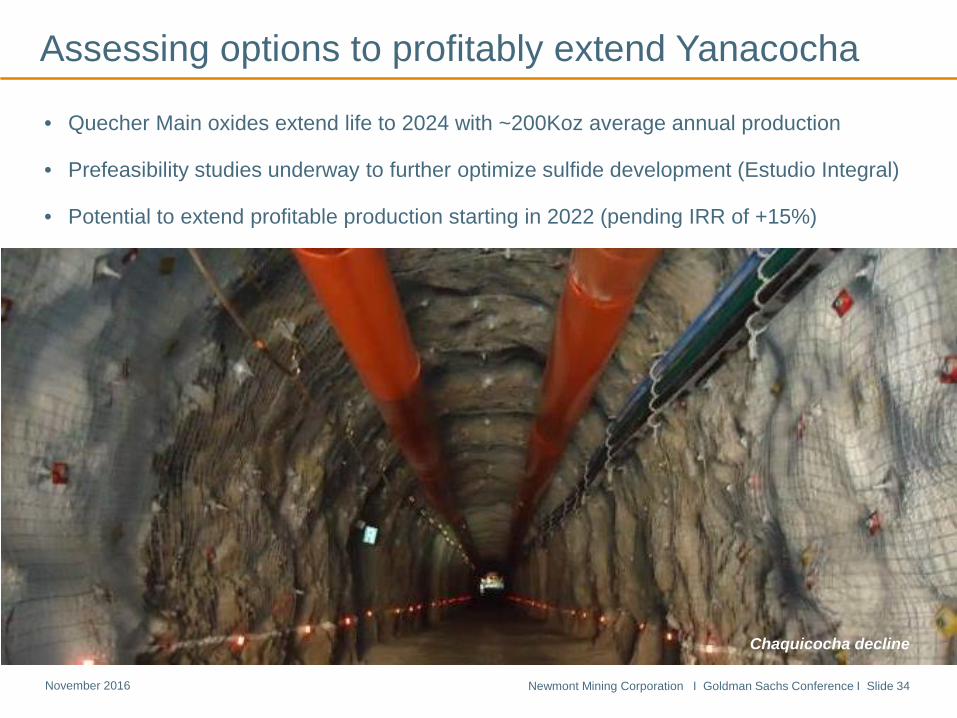
Assessing options to profitably extend Yanacocha
• Quecher Main oxides extend life to 2024 with ~200Koz average annual production
• Prefeasibility studies underway to further optimize sulfide development (Estudio Integral)
• Potential to extend profitable production starting in 2022 (pending IRR of +15%)
Chaquicocha decline
Newmont Mining Corporation I Goldman Sachs Conference I Slide 35 November 2016
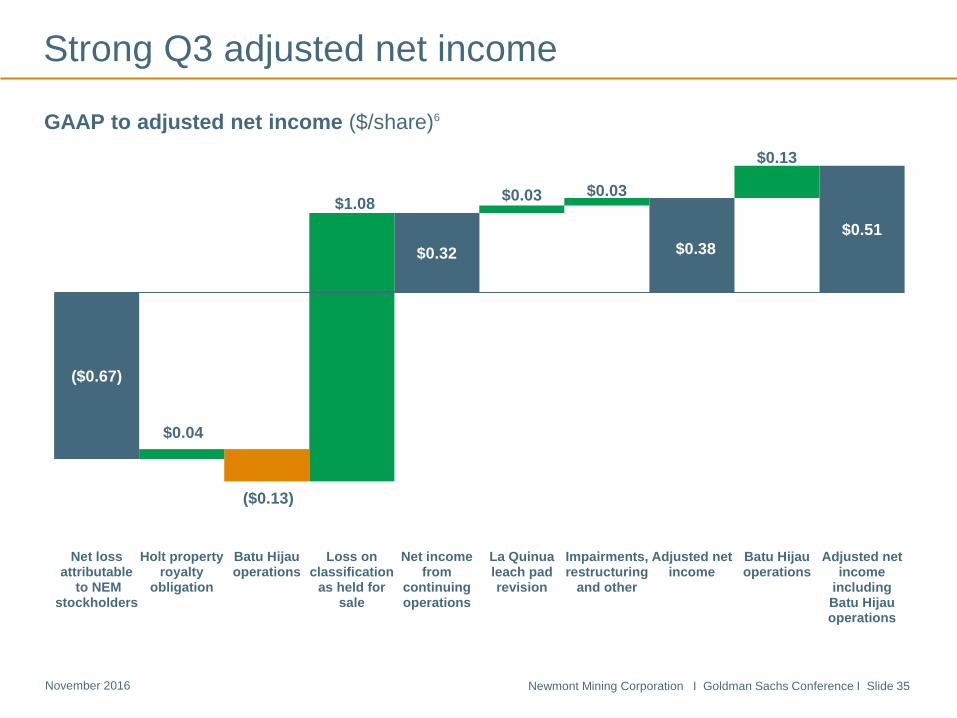
Strong Q3 adjusted net income
GAAP to adjusted net income ($/share)6
($0.67)
($0.13)
$0.51
$0.04
$1.08
$0.32
$0.03 $0.03
$0.38
$0.13
Net lossattributable
to NEMstockholders
Holt propertyroyalty
obligation
Batu Hijauoperations
Loss onclassification
as held forsale
Net incomefrom
continuingoperations
La Quinualeach padrevision
Impairments,restructuring
and other
Adjusted netincome
Batu Hijauoperations
Adjusted netincome
includingBatu Hijauoperations
Newmont Mining Corporation I Goldman Sachs Conference I Slide 36 November 2016
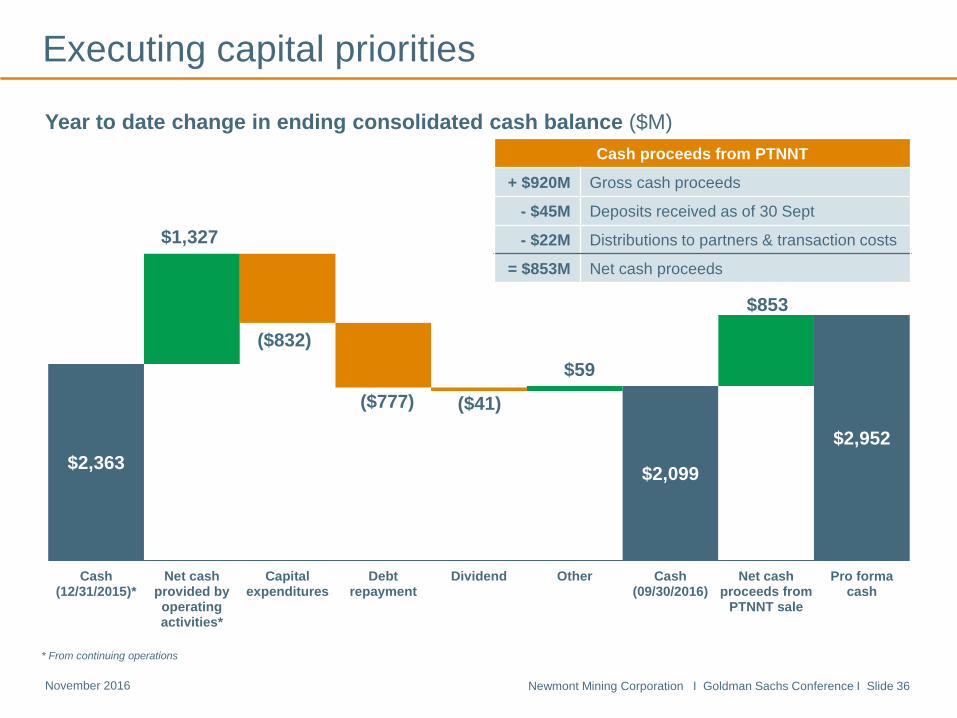
$2,363 $2,099
$2,952
$1,327
($832)
($777) ($41)
$59
$853
Cash(12/31/2015)*
Net cashprovided byoperatingactivities*
Capitalexpenditures
Debtrepayment
Dividend Other Cash(09/30/2016)
Net cashproceeds from
PTNNT sale
Pro formacash
Executing capital priorities
Year to date change in ending consolidated cash balance ($M)
* From continuing operations
Cash proceeds from PTNNT
+ $920M Gross cash proceeds
- $45M Deposits received as of 30 Sept
- $22M Distributions to partners & transaction costs
= $853M Net cash proceeds
Newmont Mining Corporation I Goldman Sachs Conference I Slide 37 November 2016
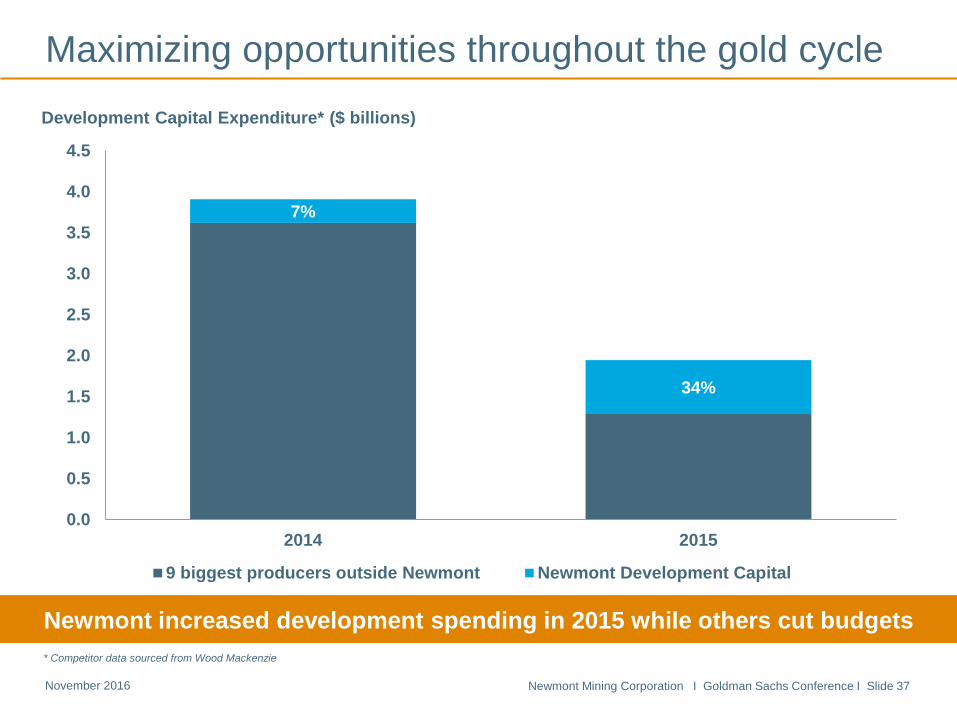
Maximizing opportunities throughout the gold cycle
7%
34%
0.0
0.5
1.0
1.5
2.0
2.5
3.0
3.5
4.0
4.5
2014 2015
9 biggest producers outside Newmont Newmont Development Capital
Development Capital Expenditure* ($ billions)
Newmont increased development spending in 2015 while others cut budgets * Competitor data sourced from Wood Mackenzie
Newmont Mining Corporation I Goldman Sachs Conference I Slide 38 November 2016
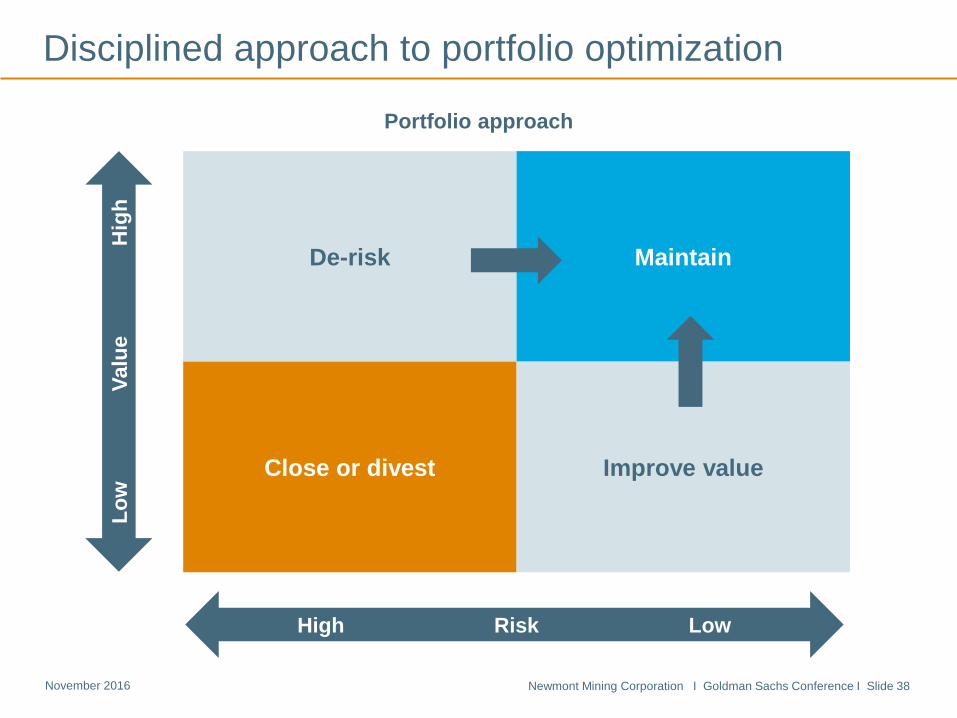
Disciplined approach to portfolio optimization
De-risk Maintain
Close or divest Improve value
Low
Va
lue
Hig
h
High Risk Low
Portfolio approach
Newmont Mining Corporation I Goldman Sachs Conference I Slide 39 November 2016
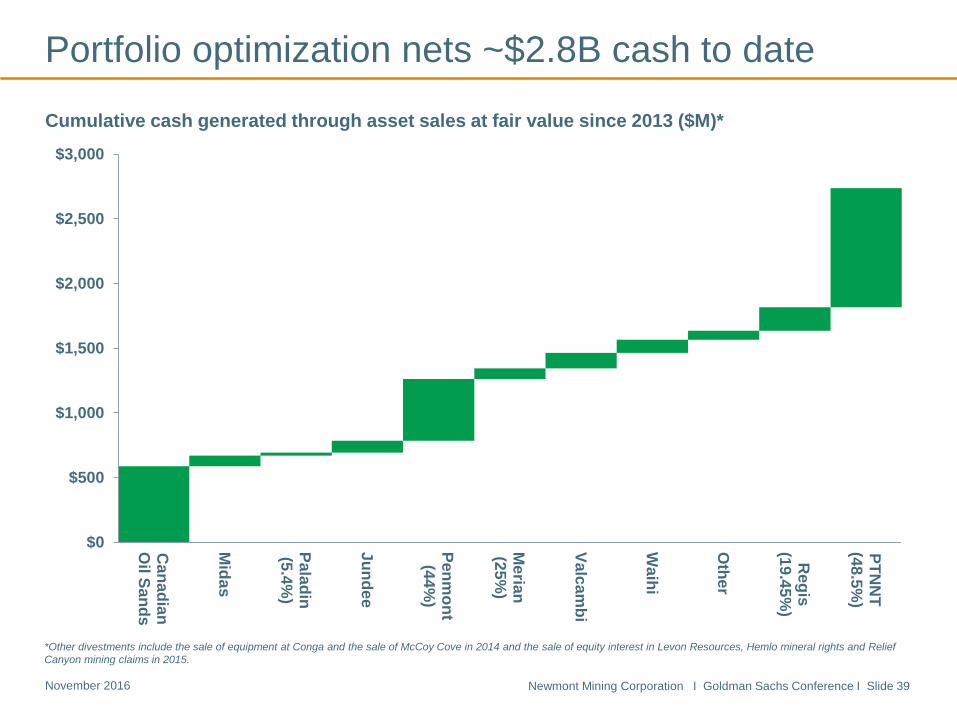
*Other divestments include the sale of equipment at Conga and the sale of McCoy Cove in 2014 and the sale of equity interest in Levon Resources, Hemlo mineral rights and Relief Canyon mining claims in 2015.
Portfolio optimization nets ~$2.8B cash to date
Cumulative cash generated through asset sales at fair value since 2013 ($M)*
$0
$500
$1,000
$1,500
$2,000
$2,500
$3,000
Canadian
Oil Sands
Midas
Paladin(5.4%
)
Jundee
Penmont
(44%)
Merian
(25%)
Valcambi
Waihi
Other
Regis
(19.45%)
PTNN
T(48.5%
)
Newmont Mining Corporation I Goldman Sachs Conference I Slide 40 November 2016
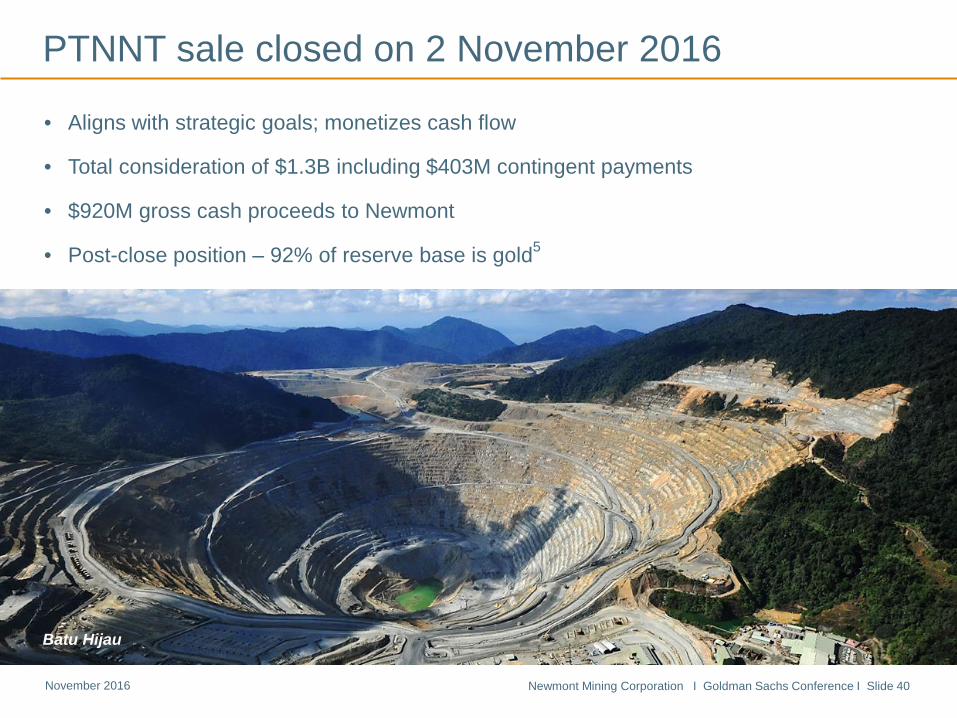
PTNNT sale closed on 2 November 2016
• Aligns with strategic goals; monetizes cash flow
• Total consideration of $1.3B including $403M contingent payments
• $920M gross cash proceeds to Newmont
• Post-close position – 92% of reserve base is gold5
Batu Hijau
Newmont Mining Corporation I Goldman Sachs Conference I Slide 41 November 2016
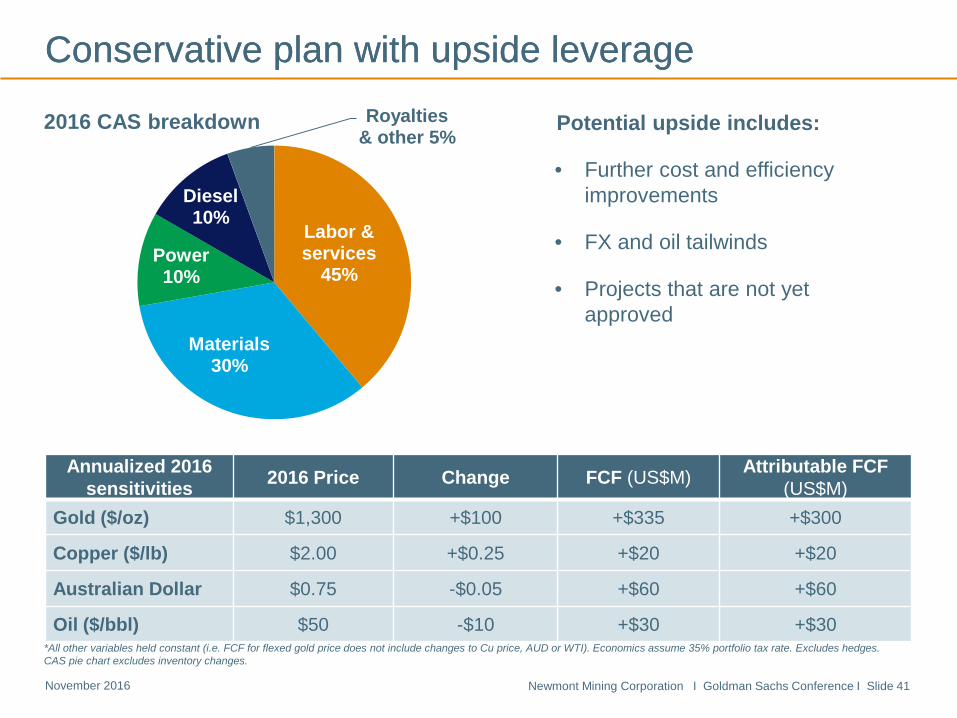
Labor & services
45%
Materials 30%
Power 10%
Diesel 10%
Royalties & other 5%
Conservative plan with upside leverage Conservative plan with upside leverage
*All other variables held constant (i.e. FCF for flexed gold price does not include changes to Cu price, AUD or WTI). Economics assume 35% portfolio tax rate. Excludes hedges. CAS pie chart excludes inventory changes.
2016 CAS breakdown Potential upside includes:
• Further cost and efficiency improvements
• FX and oil tailwinds
• Projects that are not yet approved
Annualized 2016 sensitivities 2016 Price Change FCF (US$M) Attributable FCF
(US$M) Gold ($/oz) $1,300 +$100 +$335 +$300
Copper ($/lb) $2.00 +$0.25 +$20 +$20
Australian Dollar $0.75 -$0.05 +$60 +$60
Oil ($/bbl) $50 -$10 +$30 +$30
Newmont Mining Corporation I Goldman Sachs Conference I Slide 42 November 2016
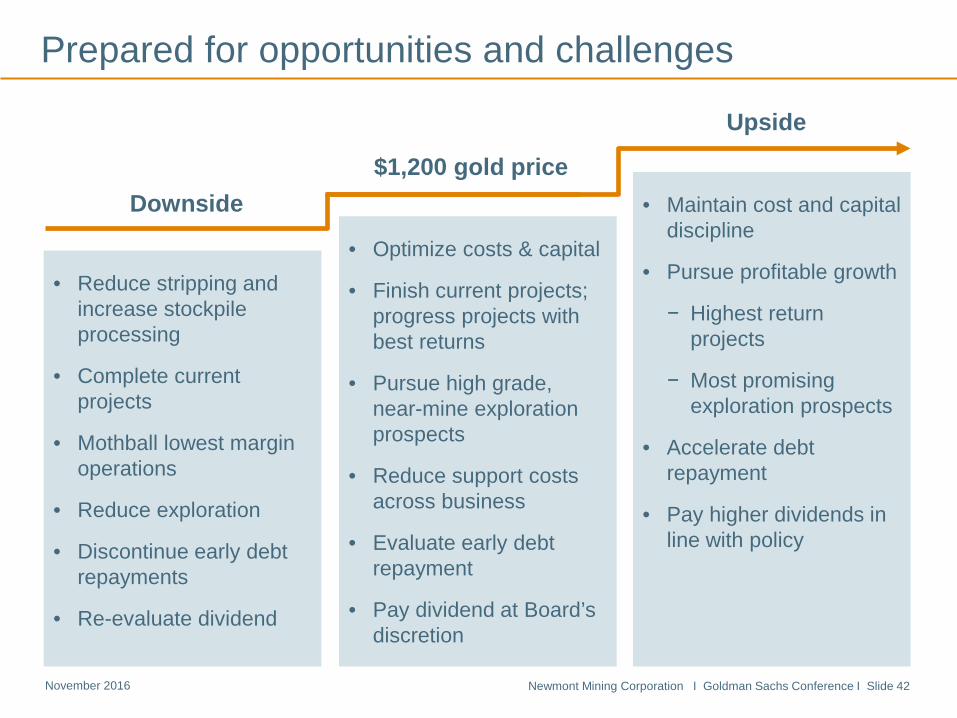
Prepared for opportunities and challenges
$1,200 gold price
• Optimize costs & capital
• Finish current projects; progress projects with best returns
• Pursue high grade, near-mine exploration prospects
• Reduce support costs across business
• Evaluate early debt repayment
• Pay dividend at Board’s discretion
Downside
• Reduce stripping and increase stockpile processing
• Complete current projects
• Mothball lowest margin operations
• Reduce exploration
• Discontinue early debt repayments
• Re-evaluate dividend
Upside
• Maintain cost and capital discipline
• Pursue profitable growth
− Highest return projects
− Most promising exploration prospects
• Accelerate debt repayment
• Pay higher dividends in line with policy
Newmont Mining Corporation I Goldman Sachs Conference I Slide 43 November 2016
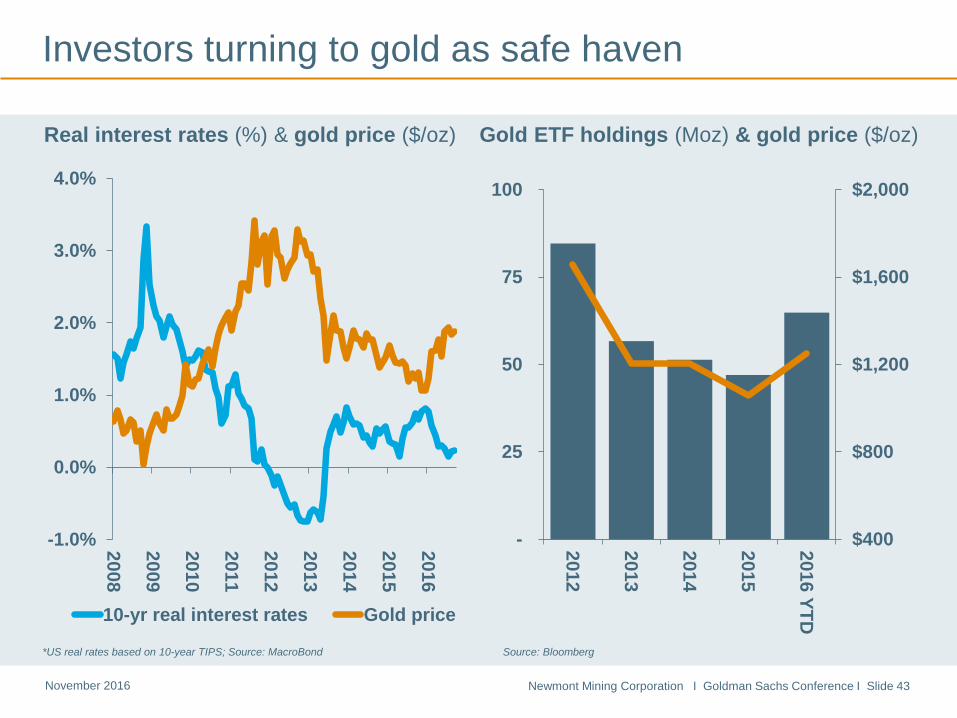
*US real rates based on 10-year TIPS; Source: MacroBond
Real interest rates (%) & gold price ($/oz) Gold ETF holdings (Moz) & gold price ($/oz)
Source: Bloomberg
Investors turning to gold as safe haven
$400
$800
$1,200
$1,600
$2,000
-
25
50
75
100
2012
2013
2014
2015
2016 YTD
-1.0%
0.0%
1.0%
2.0%
3.0%
4.0%
2008
2009
2010
2011
2012
2013
2014
2015
2016
10-yr real interest rates Gold price
Newmont Mining Corporation I Goldman Sachs Conference I Slide 44 November 2016
-
1
2
3
4
5
6
7
8
Switzerland
UA
E
Hong K
ong
Saudi Arabia
Turkey
Thailand
Germ
any
Vietnam
China
India
Taiwan
Egypt
USA
Russia
UK
Italy
South Korea
Indonesia
Japan
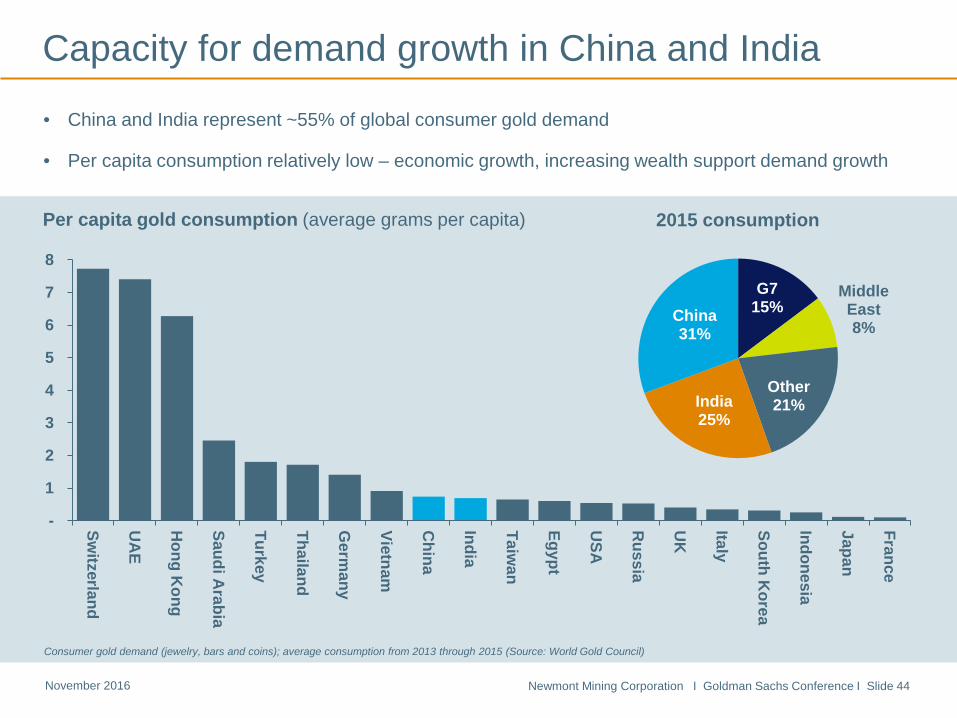
FranceCapacity for demand growth in China and India
Consumer gold demand (jewelry, bars and coins); average consumption from 2013 through 2015 (Source: World Gold Council)
Per capita gold consumption (average grams per capita)
• China and India represent ~55% of global consumer gold demand
• Per capita consumption relatively low – economic growth, increasing wealth support demand growth
G7 15%
Middle East 8%
Other 21% India
25%
China 31%
2015 consumption
Newmont Mining Corporation I Goldman Sachs Conference I Slide 45 November 2016
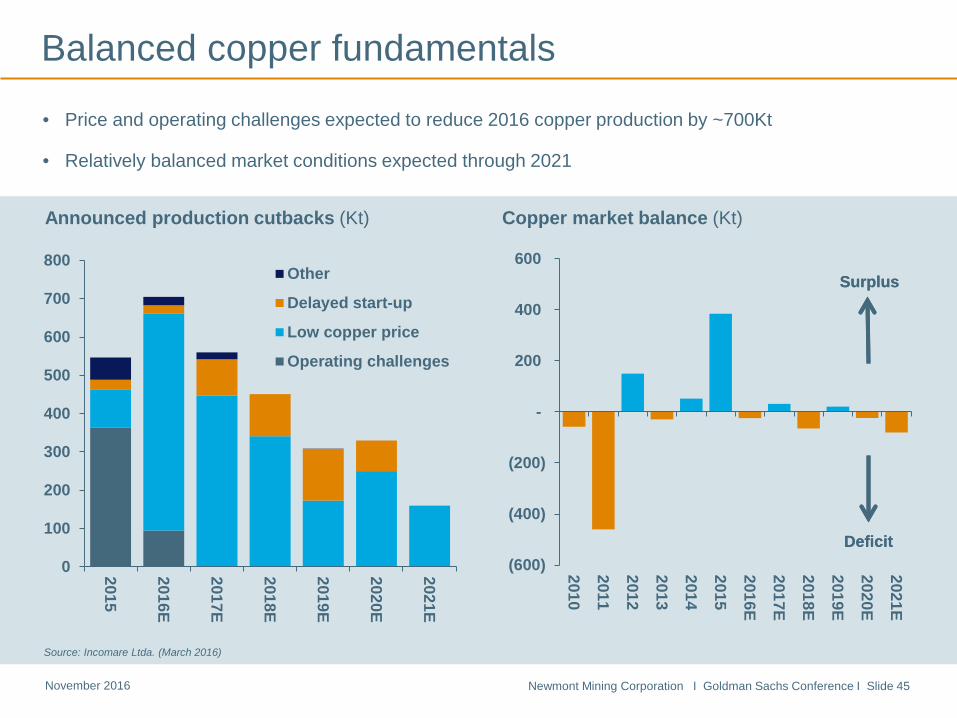
Announced production cutbacks (Kt)
Copper market balance (Kt)
• Price and operating challenges expected to reduce 2016 copper production by ~700Kt
• Relatively balanced market conditions expected through 2021
Balanced copper fundamentals
Surplus
Deficit
Source: Incomare Ltda. (March 2016)
Surplus
Deficit (600)
(400)
(200)
-
200
400
600
2010
2011
2012
2013
2014
2015
2016E
2017E
2018E
2019E
2020E
2021E
0
100
200
300
400
500
600
700
800
2015
2016E
2017E
2018E
2019E
2020E
2021E
Other
Delayed start-up
Low copper price
Operating challenges
Newmont Mining Corporation I Goldman Sachs Conference I Slide 46 November 2016
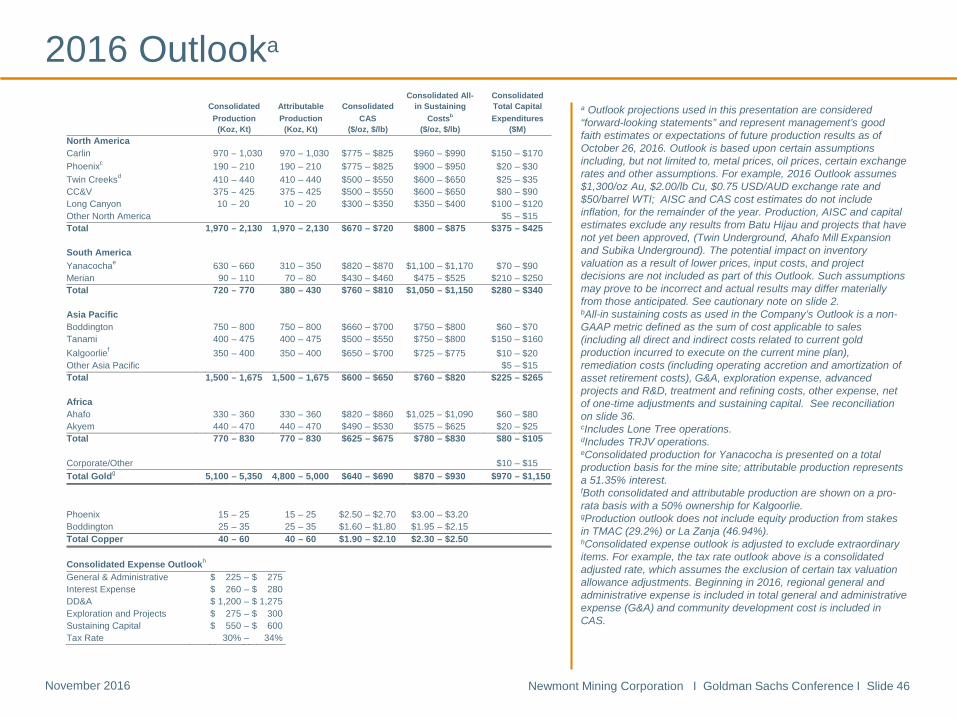
2016 Outlooka
a Outlook projections used in this presentation are considered “forward-looking statements” and represent management’s good faith estimates or expectations of future production results as of October 26, 2016. Outlook is based upon certain assumptions including, but not limited to, metal prices, oil prices, certain exchange rates and other assumptions. For example, 2016 Outlook assumes $1,300/oz Au, $2.00/lb Cu, $0.75 USD/AUD exchange rate and $50/barrel WTI; AISC and CAS cost estimates do not include inflation, for the remainder of the year. Production, AISC and capital estimates exclude any results from Batu Hijau and projects that have not yet been approved, (Twin Underground, Ahafo Mill Expansion and Subika Underground). The potential impact on inventory valuation as a result of lower prices, input costs, and project decisions are not included as part of this Outlook. Such assumptions may prove to be incorrect and actual results may differ materially from those anticipated. See cautionary note on slide 2. bAll-in sustaining costs as used in the Company’s Outlook is a non-GAAP metric defined as the sum of cost applicable to sales (including all direct and indirect costs related to current gold production incurred to execute on the current mine plan), remediation costs (including operating accretion and amortization of asset retirement costs), G&A, exploration expense, advanced projects and R&D, treatment and refining costs, other expense, net of one-time adjustments and sustaining capital. See reconciliation on slide 36. cIncludes Lone Tree operations. dIncludes TRJV operations. eConsolidated production for Yanacocha is presented on a total production basis for the mine site; attributable production represents a 51.35% interest. fBoth consolidated and attributable production are shown on a pro-rata basis with a 50% ownership for Kalgoorlie. gProduction outlook does not include equity production from stakes in TMAC (29.2%) or La Zanja (46.94%). hConsolidated expense outlook is adjusted to exclude extraordinary items. For example, the tax rate outlook above is a consolidated adjusted rate, which assumes the exclusion of certain tax valuation allowance adjustments. Beginning in 2016, regional general and administrative expense is included in total general and administrative expense (G&A) and community development cost is included in CAS.
Consolidated Expense Outlookh General & Administrative $ 225 – $ 275 Interest Expense $ 260 – $ 280 DD&A $ 1,200 – $ 1,275 Exploration and Projects $ 275 – $ 300 Sustaining Capital $ 550 – $ 600 Tax Rate 30% – 34%
Consolidated Attributable Consolidated Consolidated All-
in Sustaining Consolidated Total Capital
Production Production CAS Costsb Expenditures (Koz, Kt) (Koz, Kt) ($/oz, $/lb) ($/oz, $/lb) ($M) North America Carlin 970 – 1,030 970 – 1,030 $775 – $825 $960 – $990 $150 – $170 Phoenixc 190 – 210 190 – 210 $775 – $825 $900 – $950 $20 – $30 Twin Creeksd 410 – 440 410 – 440 $500 – $550 $600 – $650 $25 – $35 CC&V 375 – 425 375 – 425 $500 – $550 $600 – $650 $80 – $90 Long Canyon 10 – 20 10 – 20 $300 – $350 $350 – $400 $100 – $120 Other North America $5 – $15 Total 1,970 – 2,130 1,970 – 2,130 $670 – $720 $800 – $875 $375 – $425 South America Yanacochae 630 – 660 310 – 350 $820 – $870 $1,100 – $1,170 $70 – $90 Merian 90 – 110 70 – 80 $430 – $460 $475 – $525 $210 – $250 Total 720 – 770 380 – 430 $760 – $810 $1,050 – $1,150 $280 – $340 Asia Pacific Boddington 750 – 800 750 – 800 $660 – $700 $750 – $800 $60 – $70 Tanami 400 – 475 400 – 475 $500 – $550 $750 – $800 $150 – $160 Kalgoorlief 350 – 400 350 – 400 $650 – $700 $725 – $775 $10 – $20 Other Asia Pacific $5 – $15 Total 1,500 – 1,675 1,500 – 1,675 $600 – $650 $760 – $820 $225 – $265 Africa Ahafo 330 – 360 330 – 360 $820 – $860 $1,025 – $1,090 $60 – $80 Akyem 440 – 470 440 – 470 $490 – $530 $575 – $625 $20 – $25 Total 770 – 830 770 – 830 $625 – $675 $780 – $830 $80 – $105 Corporate/Other $10 – $15 Total Goldg 5,100 – 5,350 4,800 – 5,000 $640 – $690 $870 – $930 $970 – $1,150 Phoenix 15 – 25 15 – 25 $2.50 – $2.70 $3.00 – $3.20 Boddington 25 – 35 25 – 35 $1.60 – $1.80 $1.95 – $2.15 Total Copper 40 – 60 40 – 60 $1.90 – $2.10 $2.30 – $2.50
Newmont Mining Corporation I Goldman Sachs Conference I Slide 47 November 2016
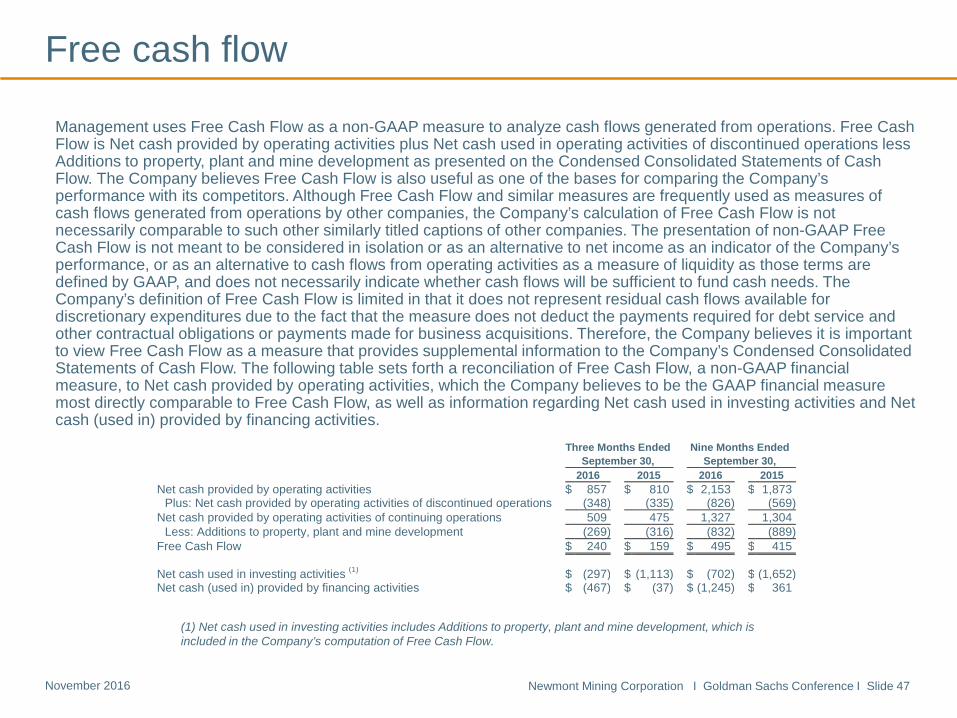
Free cash flow
Management uses Free Cash Flow as a non-GAAP measure to analyze cash flows generated from operations. Free Cash Flow is Net cash provided by operating activities plus Net cash used in operating activities of discontinued operations less Additions to property, plant and mine development as presented on the Condensed Consolidated Statements of Cash Flow. The Company believes Free Cash Flow is also useful as one of the bases for comparing the Company’s performance with its competitors. Although Free Cash Flow and similar measures are frequently used as measures of cash flows generated from operations by other companies, the Company’s calculation of Free Cash Flow is not necessarily comparable to such other similarly titled captions of other companies. The presentation of non-GAAP Free Cash Flow is not meant to be considered in isolation or as an alternative to net income as an indicator of the Company’s performance, or as an alternative to cash flows from operating activities as a measure of liquidity as those terms are defined by GAAP, and does not necessarily indicate whether cash flows will be sufficient to fund cash needs. The Company’s definition of Free Cash Flow is limited in that it does not represent residual cash flows available for discretionary expenditures due to the fact that the measure does not deduct the payments required for debt service and other contractual obligations or payments made for business acquisitions. Therefore, the Company believes it is important to view Free Cash Flow as a measure that provides supplemental information to the Company’s Condensed Consolidated Statements of Cash Flow. The following table sets forth a reconciliation of Free Cash Flow, a non-GAAP financial measure, to Net cash provided by operating activities, which the Company believes to be the GAAP financial measure most directly comparable to Free Cash Flow, as well as information regarding Net cash used in investing activities and Net cash (used in) provided by financing activities.
(1) Net cash used in investing activities includes Additions to property, plant and mine development, which is included in the Company’s computation of Free Cash Flow.
Three Months Ended Nine Months Ended September 30, September 30, 2016 2015 2016 2015 Net cash provided by operating activities $ 857 $ 810 $ 2,153 $ 1,873
Plus: Net cash provided by operating activities of discontinued operations (348) (335) (826) (569) Net cash provided by operating activities of continuing operations 509 475 1,327 1,304
Less: Additions to property, plant and mine development (269) (316) (832) (889) Free Cash Flow $ 240 $ 159 $ 495 $ 415 Net cash used in investing activities (1) $ (297) $ (1,113) $ (702) $ (1,652) Net cash (used in) provided by financing activities $ (467) $ (37) $ (1,245) $ 361
Newmont Mining Corporation I Goldman Sachs Conference I Slide 48 November 2016
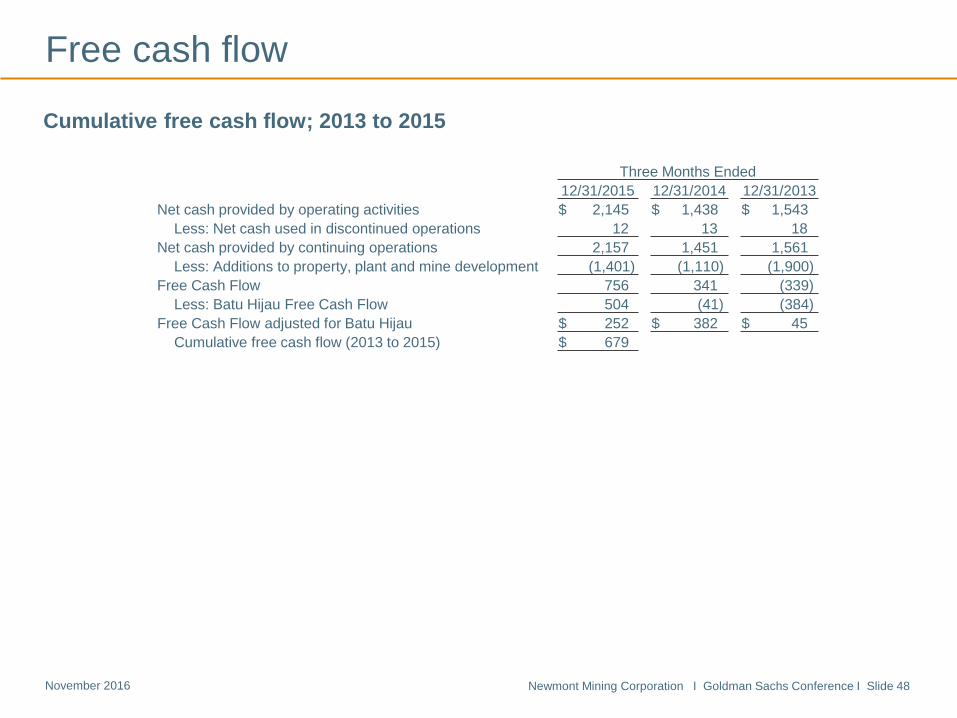
Free cash flow
Cumulative free cash flow; 2013 to 2015
Three Months Ended 12/31/2015 12/31/2014 12/31/2013
Net cash provided by operating activities $ 2,145 $ 1,438 $ 1,543 Less: Net cash used in discontinued operations 12 13 18
Net cash provided by continuing operations 2,157 1,451 1,561 Less: Additions to property, plant and mine development (1,401) (1,110) (1,900)
Free Cash Flow 756 341 (339) Less: Batu Hijau Free Cash Flow 504 (41) (384)
Free Cash Flow adjusted for Batu Hijau $ 252 $ 382 $ 45 Cumulative free cash flow (2013 to 2015) $ 679
Newmont Mining Corporation I Goldman Sachs Conference I Slide 49 November 2016
EBITDA and Adjusted EBITDA
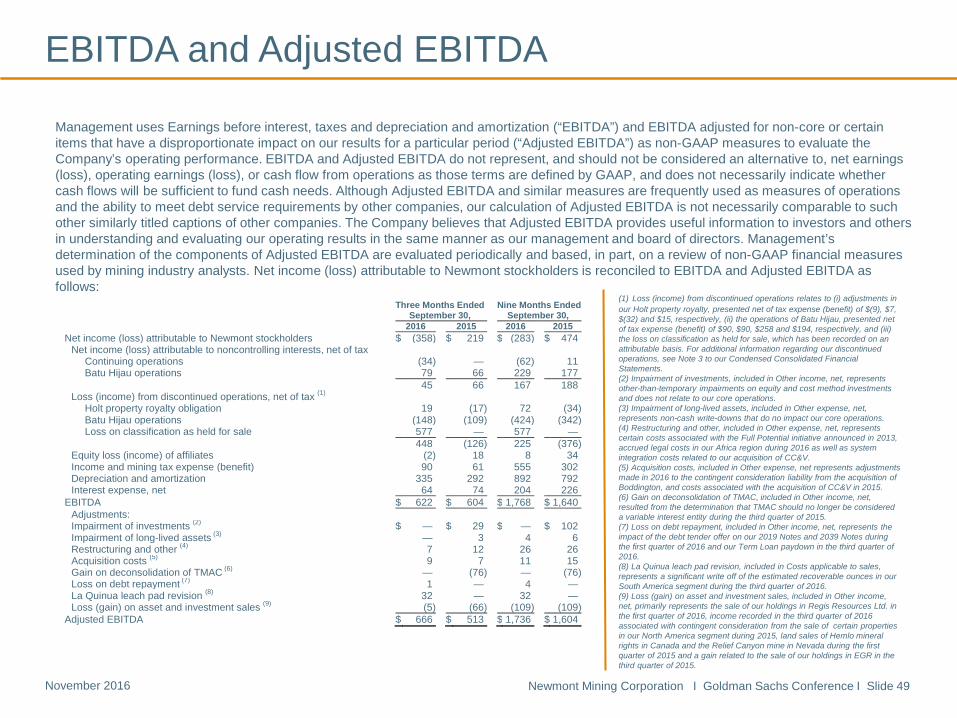
Management uses Earnings before interest, taxes and depreciation and amortization (“EBITDA”) and EBITDA adjusted for non-core or certain items that have a disproportionate impact on our results for a particular period (“Adjusted EBITDA”) as non-GAAP measures to evaluate the Company’s operating performance. EBITDA and Adjusted EBITDA do not represent, and should not be considered an alternative to, net earnings (loss), operating earnings (loss), or cash flow from operations as those terms are defined by GAAP, and does not necessarily indicate whether cash flows will be sufficient to fund cash needs. Although Adjusted EBITDA and similar measures are frequently used as measures of operations and the ability to meet debt service requirements by other companies, our calculation of Adjusted EBITDA is not necessarily comparable to such other similarly titled captions of other companies. The Company believes that Adjusted EBITDA provides useful information to investors and others in understanding and evaluating our operating results in the same manner as our management and board of directors. Management’s determination of the components of Adjusted EBITDA are evaluated periodically and based, in part, on a review of non-GAAP financial measures used by mining industry analysts. Net income (loss) attributable to Newmont stockholders is reconciled to EBITDA and Adjusted EBITDA as follows:
(1) Loss (income) from discontinued operations relates to (i) adjustments in our Holt property royalty, presented net of tax expense (benefit) of $(9), $7, $(32) and $15, respectively, (ii) the operations of Batu Hijau, presented net of tax expense (benefit) of $90, $90, $258 and $194, respectively, and (iii) the loss on classification as held for sale, which has been recorded on an attributable basis. For additional information regarding our discontinued operations, see Note 3 to our Condensed Consolidated Financial Statements. (2) Impairment of investments, included in Other income, net, represents other-than-temporary impairments on equity and cost method investments and does not relate to our core operations. (3) Impairment of long-lived assets, included in Other expense, net, represents non-cash write-downs that do no impact our core operations. (4) Restructuring and other, included in Other expense, net, represents certain costs associated with the Full Potential initiative announced in 2013, accrued legal costs in our Africa region during 2016 as well as system integration costs related to our acquisition of CC&V. (5) Acquisition costs, included in Other expense, net represents adjustments made in 2016 to the contingent consideration liability from the acquisition of Boddington, and costs associated with the acquisition of CC&V in 2015. (6) Gain on deconsolidation of TMAC, included in Other income, net, resulted from the determination that TMAC should no longer be considered a variable interest entity during the third quarter of 2015. (7) Loss on debt repayment, included in Other income, net, represents the impact of the debt tender offer on our 2019 Notes and 2039 Notes during the first quarter of 2016 and our Term Loan paydown in the third quarter of 2016. (8) La Quinua leach pad revision, included in Costs applicable to sales, represents a significant write off of the estimated recoverable ounces in our South America segment during the third quarter of 2016. (9) Loss (gain) on asset and investment sales, included in Other income, net, primarily represents the sale of our holdings in Regis Resources Ltd. in the first quarter of 2016, income recorded in the third quarter of 2016 associated with contingent consideration from the sale of certain properties in our North America segment during 2015, land sales of Hemlo mineral rights in Canada and the Relief Canyon mine in Nevada during the first quarter of 2015 and a gain related to the sale of our holdings in EGR in the third quarter of 2015.
Three Months Ended Nine Months Ended September 30, September 30, 2016 2015 2016 2015 Net income (loss) attributable to Newmont stockholders $ (358) $ 219 $ (283) $ 474
Net income (loss) attributable to noncontrolling interests, net of tax Continuing operations (34) — (62) 11 Batu Hijau operations 79 66 229 177
45 66 167 188 Loss (income) from discontinued operations, net of tax (1)
Holt property royalty obligation 19 (17) 72 (34) Batu Hijau operations (148) (109) (424) (342) Loss on classification as held for sale 577 — 577 —
448 (126) 225 (376) Equity loss (income) of affiliates (2) 18 8 34 Income and mining tax expense (benefit) 90 61 555 302 Depreciation and amortization 335 292 892 792 Interest expense, net 64 74 204 226
EBITDA $ 622 $ 604 $ 1,768 $ 1,640 Adjustments: Impairment of investments (2) $ — $ 29 $ — $ 102 Impairment of long-lived assets (3) — 3 4 6 Restructuring and other (4) 7 12 26 26 Acquisition costs (5) 9 7 11 15 Gain on deconsolidation of TMAC (6) — (76) — (76) Loss on debt repayment (7) 1 — 4 — La Quinua leach pad revision (8) 32 — 32 — Loss (gain) on asset and investment sales (9) (5) (66) (109) (109)
Adjusted EBITDA $ 666 $ 513 $ 1,736 $ 1,604
Newmont Mining Corporation I Goldman Sachs Conference I Slide 50 November 2016
Adjusted net income
Management uses Adjusted net income (loss) to evaluate the Company’s operating performance and for planning and forecasting future business operations. The Company believes the use of Adjusted net income (loss) allows investors and analysts to understand the results of the continuing operations of the Company and its direct and indirect subsidiaries relating to the production and sale of minerals, by excluding certain items that have a disproportionate impact on our results for a particular period. The net income (loss) adjustments are generally presented net of tax at the Company’s statutory effective tax rate of 35% and net of our partners’ noncontrolling interests when applicable. The impact of the adjustments through the Company’s valuation allowance is included in Tax adjustments. The Tax adjustment also includes items such as foreign tax credits, alternative minimum tax credits, capital losses and disallowed foreign losses. Management’s determination of the components of Adjusted net income (loss) are evaluated periodically and based, in part, on a review of non-GAAP financial measures used by mining industry analysts. Net income (loss) attributable to Newmont stockholders is reconciled to Adjusted net income (loss) as follows on the next slide:
Newmont Mining Corporation I Goldman Sachs Conference I Slide 51 November 2016
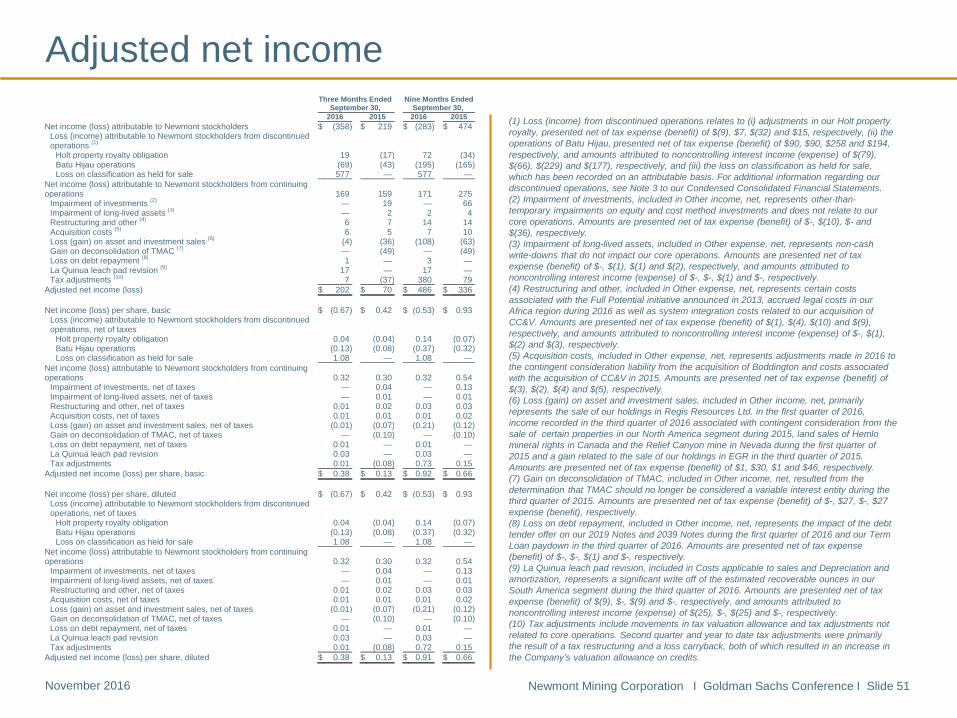
(1) Loss (income) from discontinued operations relates to (i) adjustments in our Holt property royalty, presented net of tax expense (benefit) of $(9), $7, $(32) and $15, respectively, (ii) the operations of Batu Hijau, presented net of tax expense (benefit) of $90, $90, $258 and $194, respectively, and amounts attributed to noncontrolling interest income (expense) of $(79), $(66), $(229) and $(177), respectively, and (iii) the loss on classification as held for sale, which has been recorded on an attributable basis. For additional information regarding our discontinued operations, see Note 3 to our Condensed Consolidated Financial Statements. (2) Impairment of investments, included in Other income, net, represents other-than-temporary impairments on equity and cost method investments and does not relate to our core operations. Amounts are presented net of tax expense (benefit) of $-, $(10), $- and $(36), respectively. (3) Impairment of long-lived assets, included in Other expense, net, represents non-cash write-downs that do not impact our core operations. Amounts are presented net of tax expense (benefit) of $-, $(1), $(1) and $(2), respectively, and amounts attributed to noncontrolling interest income (expense) of $-, $-, $(1) and $-, respectively. (4) Restructuring and other, included in Other expense, net, represents certain costs associated with the Full Potential initiative announced in 2013, accrued legal costs in our Africa region during 2016 as well as system integration costs related to our acquisition of CC&V. Amounts are presented net of tax expense (benefit) of $(1), $(4), $(10) and $(9), respectively, and amounts attributed to noncontrolling interest income (expense) of $-, $(1), $(2) and $(3), respectively. (5) Acquisition costs, included in Other expense, net, represents adjustments made in 2016 to the contingent consideration liability from the acquisition of Boddington and costs associated with the acquisition of CC&V in 2015. Amounts are presented net of tax expense (benefit) of $(3), $(2), $(4) and $(5), respectively. (6) Loss (gain) on asset and investment sales, included in Other income, net, primarily represents the sale of our holdings in Regis Resources Ltd. in the first quarter of 2016, income recorded in the third quarter of 2016 associated with contingent consideration from the sale of certain properties in our North America segment during 2015, land sales of Hemlo mineral rights in Canada and the Relief Canyon mine in Nevada during the first quarter of 2015 and a gain related to the sale of our holdings in EGR in the third quarter of 2015. Amounts are presented net of tax expense (benefit) of $1, $30, $1 and $46, respectively. (7) Gain on deconsolidation of TMAC, included in Other income, net, resulted from the determination that TMAC should no longer be considered a variable interest entity during the third quarter of 2015. Amounts are presented net of tax expense (benefit) of $-, $27, $-, $27 expense (benefit), respectively. (8) Loss on debt repayment, included in Other income, net, represents the impact of the debt tender offer on our 2019 Notes and 2039 Notes during the first quarter of 2016 and our Term Loan paydown in the third quarter of 2016. Amounts are presented net of tax expense (benefit) of $-, $-, $(1) and $-, respectively. (9) La Quinua leach pad revision, included in Costs applicable to sales and Depreciation and amortization, represents a significant write off of the estimated recoverable ounces in our South America segment during the third quarter of 2016. Amounts are presented net of tax expense (benefit) of $(9), $-, $(9) and $-, respectively, and amounts attributed to noncontrolling interest income (expense) of $(25), $-, $(25) and $-, respectively. (10) Tax adjustments include movements in tax valuation allowance and tax adjustments not related to core operations. Second quarter and year to date tax adjustments were primarily the result of a tax restructuring and a loss carryback, both of which resulted in an increase in the Company’s valuation allowance on credits.
Adjusted net income
Three Months Ended Nine Months Ended September 30, September 30, 2016 2015 2016 2015 Net income (loss) attributable to Newmont stockholders $ (358) $ 219 $ (283) $ 474
Loss (income) attributable to Newmont stockholders from discontinued operations (1)
Holt property royalty obligation 19 (17) 72 (34) Batu Hijau operations (69) (43) (195) (165) Loss on classification as held for sale 577 — 577 —
Net income (loss) attributable to Newmont stockholders from continuing operations 169 159 171 275
Impairment of investments (2) — 19 — 66 Impairment of long-lived assets (3) — 2 2 4 Restructuring and other (4) 6 7 14 14 Acquisition costs (5) 6 5 7 10 Loss (gain) on asset and investment sales (6) (4) (36) (108) (63) Gain on deconsolidation of TMAC (7) — (49) — (49) Loss on debt repayment (8) 1 — 3 — La Quinua leach pad revision (9) 17 — 17 — Tax adjustments (10) 7 (37) 380 79
Adjusted net income (loss) $ 202 $ 70 $ 486 $ 336 Net income (loss) per share, basic $ (0.67) $ 0.42 $ (0.53) $ 0.93
Loss (income) attributable to Newmont stockholders from discontinued operations, net of taxes
Holt property royalty obligation 0.04 (0.04) 0.14 (0.07) Batu Hijau operations (0.13) (0.08) (0.37) (0.32) Loss on classification as held for sale 1.08 — 1.08 —
Net income (loss) attributable to Newmont stockholders from continuing operations 0.32 0.30 0.32 0.54
Impairment of investments, net of taxes — 0.04 — 0.13 Impairment of long-lived assets, net of taxes — 0.01 — 0.01 Restructuring and other, net of taxes 0.01 0.02 0.03 0.03 Acquisition costs, net of taxes 0.01 0.01 0.01 0.02 Loss (gain) on asset and investment sales, net of taxes (0.01) (0.07) (0.21) (0.12) Gain on deconsolidation of TMAC, net of taxes — (0.10) — (0.10) Loss on debt repayment, net of taxes 0.01 — 0.01 — La Quinua leach pad revision 0.03 — 0.03 — Tax adjustments 0.01 (0.08) 0.73 0.15
Adjusted net income (loss) per share, basic $ 0.38 $ 0.13 $ 0.92 $ 0.66 Net income (loss) per share, diluted $ (0.67) $ 0.42 $ (0.53) $ 0.93
Loss (income) attributable to Newmont stockholders from discontinued operations, net of taxes
Holt property royalty obligation 0.04 (0.04) 0.14 (0.07) Batu Hijau operations (0.13) (0.08) (0.37) (0.32) Loss on classification as held for sale 1.08 — 1.08 —
Net income (loss) attributable to Newmont stockholders from continuing operations 0.32 0.30 0.32 0.54
Impairment of investments, net of taxes — 0.04 — 0.13 Impairment of long-lived assets, net of taxes — 0.01 — 0.01 Restructuring and other, net of taxes 0.01 0.02 0.03 0.03 Acquisition costs, net of taxes 0.01 0.01 0.01 0.02 Loss (gain) on asset and investment sales, net of taxes (0.01) (0.07) (0.21) (0.12) Gain on deconsolidation of TMAC, net of taxes — (0.10) — (0.10) Loss on debt repayment, net of taxes 0.01 — 0.01 — La Quinua leach pad revision 0.03 — 0.03 — Tax adjustments 0.01 (0.08) 0.72 0.15
Adjusted net income (loss) per share, diluted $ 0.38 $ 0.13 $ 0.91 $ 0.66
Newmont Mining Corporation I Goldman Sachs Conference I Slide 52 November 2016
Newmont has worked to develop a metric that expands on GAAP measures such as cost of goods sold and non-GAAP measures, such as Costs applicable to sales per ounce, to provide visibility into the economics of our mining operations related to expenditures, operating performance and the ability to generate cash flow from our continuing operations. Current GAAP-measures used in the mining industry, such as cost of goods sold, do not capture all of the expenditures incurred to discover, develop, and sustain gold production. Therefore, we believe that all-in sustaining costs is a non-GAAP measure that provides additional information to management, investors, and analysts that aid in the understanding of the economics of our operations and performance compared to other producers and in the investor’s visibility by better defining the total costs associated with production. All-in sustaining cost (“AISC”) amounts are intended to provide additional information only and do not have any standardized meaning prescribed by GAAP and should not be considered in isolation or as a substitute for measures of performance prepared in accordance with GAAP. The measures are not necessarily indicative of operating profit or cash flow from operations as determined under GAAP. Other companies may calculate these measures differently as a result of differences in the underlying accounting principles, policies applied and in accounting frameworks such as in International Financial Reporting Standards (“IFRS”), or by reflecting the benefit from selling non-gold metals as a reduction to AISC. Differences may also arise related to definitional differences of sustaining versus development capital activities based upon each company’s internal policies. The following disclosure provides information regarding the adjustments made in determining the all-in sustaining costs measure: Costs Applicable to Sales - Includes all direct and indirect costs related to current gold production incurred to execute the current mine plan. We exclude certain exceptional or unusual amounts from Costs applicable to sales (“CAS”), such as significant revisions to recovery amounts. CAS includes by-product credits from certain metals obtained during the process of extracting and processing the primary ore-body. CAS is accounted for on an accrual basis and excludes Depreciation and amortization and Reclamation and remediation, which is consistent with our presentation of CAS on the Condensed Consolidated Statements of Operations. In determining AISC, only the CAS associated with producing and selling an ounce of gold is included in the measure. Therefore, the amount of gold CAS included in AISC is derived from the CAS presented in the Company’s Condensed Consolidated Statements of Operations less the amount of CAS attributable to the production of copper at our Phoenix and Boddington mines. The copper CAS at those mine sites is disclosed in Note 5 to the Condensed Consolidated Financial Statements. The allocation of CAS between gold and copper at the Phoenix and Boddington mines is based upon the relative sales value of copper and gold produced during the period. Reclamation Costs - Includes accretion expense related to Asset Retirement Obligation (“ARO”) and the amortization of the related Asset Retirement Cost (“ARC”) for the Company’s operating properties. Accretion related to the ARO and the amortization of the ARC assets for reclamation does not reflect annual cash outflows but are calculated in accordance with GAAP. The accretion and amortization reflect the periodic costs of reclamation associated with current gold production and are therefore included in the measure. The allocation of these costs to gold and copper is determined using the same allocation used in the allocation of CAS between gold and copper at the Phoenix and Boddington mines. Advanced Projects and Exploration - Includes incurred expenses related to projects that are designed to increase or enhance current gold production and gold exploration. We note that as current resources are depleted, exploration and advanced projects are necessary for us to replace the depleting reserves or enhance the recovery and processing of the current reserves. As this relates to sustaining our gold production, and is considered a continuing cost of a mining company, these costs are included in the AISC measure. These costs are derived from the Advanced projects, research and development and Exploration amounts presented in the Condensed Consolidated Statements of Operations less the amount attributable to the production of copper at our Phoenix and Boddington mines. The allocation of these costs to gold and copper is determined using the same allocation used in the allocation of CAS between gold and copper at the Phoenix and Boddington mines. General and Administrative - Includes costs related to administrative tasks not directly related to current gold production, but rather related to supporting our corporate structure and fulfilling our obligations to operate as a public company. Including these expenses in the AISC metric provides visibility of the impact that general and administrative activities have on current operations and profitability on a per ounce basis. Other expense, net - Includes administrative costs to support current gold production. We exclude certain exceptional or unusual expenses from Other expense, net, such as restructuring, as these are not indicative to sustaining our current gold operations. Furthermore, this adjustment to Other expense, net is also consistent with the nature of the adjustments made to Net income (loss) attributable to Newmont stockholders as disclosed in the Company’s non-GAAP financial measure Adjusted net income (loss). The allocation of these costs to gold and copper is determined using the same allocation used in the allocation of CAS between gold and copper at the Phoenix and Boddington mines. Treatment and Refining Costs - Includes costs paid to smelters for treatment and refining of our concentrates to produce the salable metal. These costs are presented net as a reduction of Sales. Sustaining Capital - We determined sustaining capital as those capital expenditures that are necessary to maintain current gold production and execute the current mine plan. Capital expenditures to develop new operations, or related to projects at existing operations where these projects will enhance gold production or reserves, are considered development. We determined the classification of sustaining and development capital projects based on a systematic review of our project portfolio in light of the nature of each project. Sustaining capital costs are relevant to the AISC metric as these are needed to maintain the Company’s current gold operations and provide improved transparency related to our ability to finance these expenditures from current operations. The allocation of these costs to gold and copper is determined using the same allocation used in the allocation of CAS between gold and copper at the Phoenix and Boddington mines.
All-in sustaining costs
Newmont Mining Corporation I Goldman Sachs Conference I Slide 53 November 2016
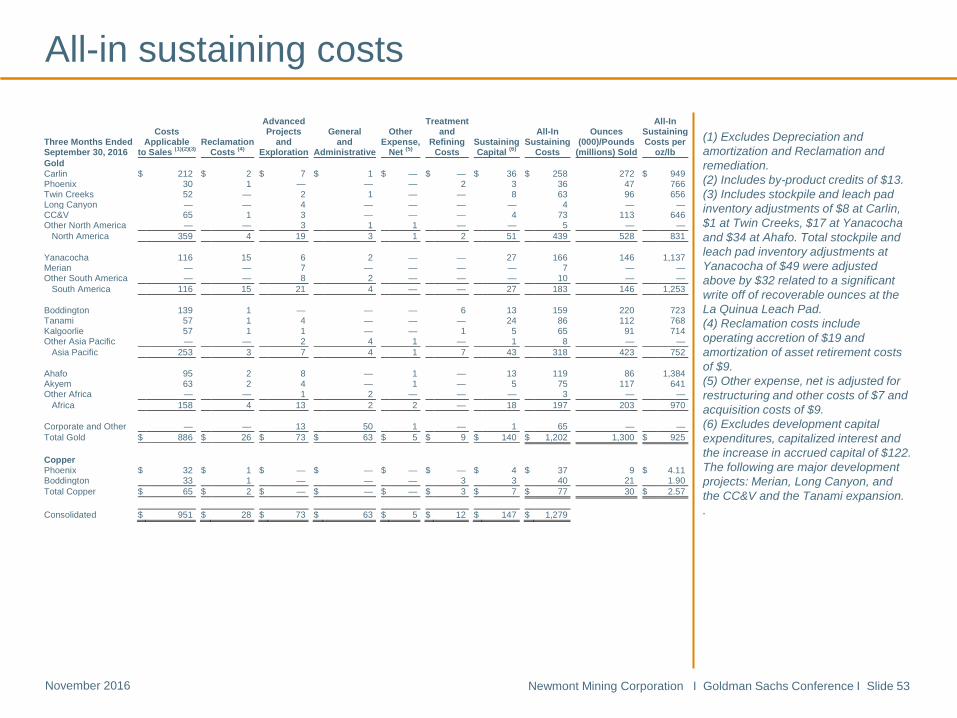
(1) Excludes Depreciation and amortization and Reclamation and remediation. (2) Includes by-product credits of $13. (3) Includes stockpile and leach pad inventory adjustments of $8 at Carlin, $1 at Twin Creeks, $17 at Yanacocha and $34 at Ahafo. Total stockpile and leach pad inventory adjustments at Yanacocha of $49 were adjusted above by $32 related to a significant write off of recoverable ounces at the La Quinua Leach Pad. (4) Reclamation costs include operating accretion of $19 and amortization of asset retirement costs of $9. (5) Other expense, net is adjusted for restructuring and other costs of $7 and acquisition costs of $9. (6) Excludes development capital expenditures, capitalized interest and the increase in accrued capital of $122. The following are major development projects: Merian, Long Canyon, and the CC&V and the Tanami expansion. .
All-in sustaining costs
Advanced Treatment All-In Costs Projects General Other and All-In Ounces Sustaining Three Months Ended Applicable Reclamation and and Expense, Refining Sustaining Sustaining (000)/Pounds Costs per September 30, 2016 to Sales (1)(2)(3) Costs (4) Exploration Administrative Net (5) Costs Capital (6) Costs (millions) Sold oz/lb Gold Carlin $ 212 $ 2 $ 7 $ 1 $ — $ — $ 36 $ 258 272 $ 949 Phoenix 30 1 — — — 2 3 36 47 766 Twin Creeks 52 — 2 1 — — 8 63 96 656 Long Canyon — — 4 — — — — 4 — — CC&V 65 1 3 — — — 4 73 113 646 Other North America — — 3 1 1 — — 5 — —
North America 359 4 19 3 1 2 51 439 528 831 Yanacocha 116 15 6 2 — — 27 166 146 1,137 Merian — — 7 — — — — 7 — — Other South America — — 8 2 — — — 10 — —
South America 116 15 21 4 — — 27 183 146 1,253 Boddington 139 1 — — — 6 13 159 220 723 Tanami 57 1 4 — — — 24 86 112 768 Kalgoorlie 57 1 1 — — 1 5 65 91 714 Other Asia Pacific — — 2 4 1 — 1 8 — —
Asia Pacific 253 3 7 4 1 7 43 318 423 752 Ahafo 95 2 8 — 1 — 13 119 86 1,384 Akyem 63 2 4 — 1 — 5 75 117 641 Other Africa — — 1 2 — — — 3 — —
Africa 158 4 13 2 2 — 18 197 203 970 Corporate and Other — — 13 50 1 — 1 65 — — Total Gold $ 886 $ 26 $ 73 $ 63 $ 5 $ 9 $ 140 $ 1,202 1,300 $ 925 Copper Phoenix $ 32 $ 1 $ — $ — $ — $ — $ 4 $ 37 9 $ 4.11 Boddington 33 1 — — — 3 3 40 21 1.90 Total Copper $ 65 $ 2 $ — $ — $ — $ 3 $ 7 $ 77 30 $ 2.57 Consolidated $ 951 $ 28 $ 73 $ 63 $ 5 $ 12 $ 147 $ 1,279
Newmont Mining Corporation I Goldman Sachs Conference I Slide 54 November 2016
All-in sustaining costs
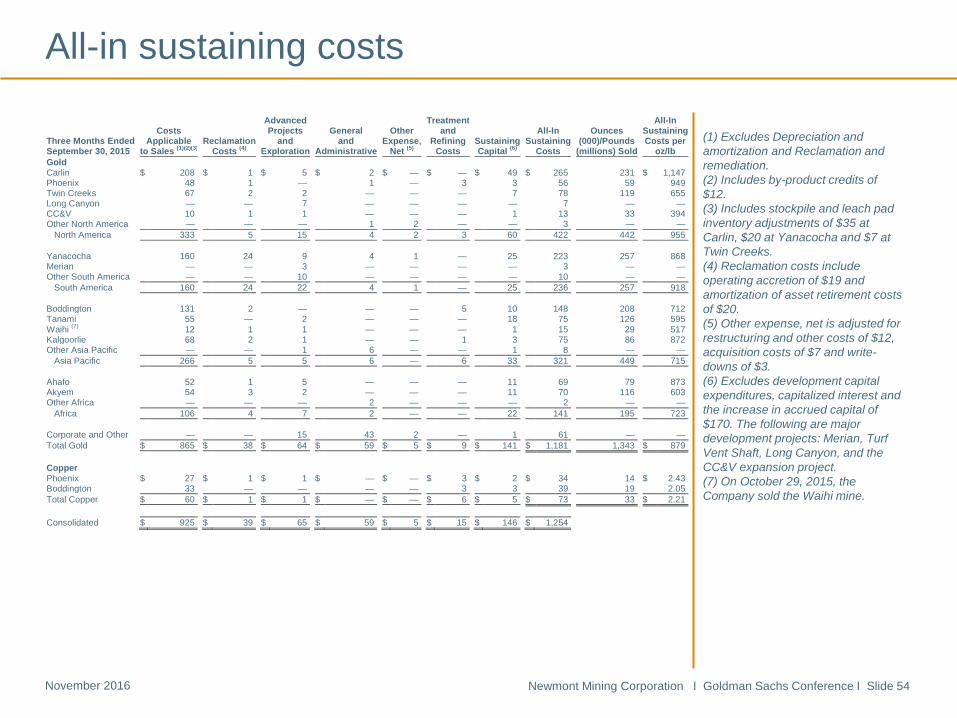
(1) Excludes Depreciation and amortization and Reclamation and remediation. (2) Includes by-product credits of $12. (3) Includes stockpile and leach pad inventory adjustments of $35 at Carlin, $20 at Yanacocha and $7 at Twin Creeks. (4) Reclamation costs include operating accretion of $19 and amortization of asset retirement costs of $20. (5) Other expense, net is adjusted for restructuring and other costs of $12, acquisition costs of $7 and write-downs of $3. (6) Excludes development capital expenditures, capitalized interest and the increase in accrued capital of $170. The following are major development projects: Merian, Turf Vent Shaft, Long Canyon, and the CC&V expansion project. (7) On October 29, 2015, the Company sold the Waihi mine.
Advanced Treatment All-In Costs Projects General Other and All-In Ounces Sustaining Three Months Ended Applicable Reclamation and and Expense, Refining Sustaining Sustaining (000)/Pounds Costs per September 30, 2015 to Sales (1)(2)(3) Costs (4) Exploration Administrative Net (5) Costs Capital (6) Costs (millions) Sold oz/lb Gold Carlin $ 208 $ 1 $ 5 $ 2 $ — $ — $ 49 $ 265 231 $ 1,147 Phoenix 48 1 — 1 — 3 3 56 59 949 Twin Creeks 67 2 2 — — — 7 78 119 655 Long Canyon — — 7 — — — — 7 — — CC&V 10 1 1 — — — 1 13 33 394 Other North America — — — 1 2 — — 3 — —
North America 333 5 15 4 2 3 60 422 442 955 Yanacocha 160 24 9 4 1 — 25 223 257 868 Merian — — 3 — — — — 3 — — Other South America — — 10 — — — — 10 — —
South America 160 24 22 4 1 — 25 236 257 918 Boddington 131 2 — — — 5 10 148 208 712 Tanami 55 — 2 — — — 18 75 126 595 Waihi (7) 12 1 1 — — — 1 15 29 517 Kalgoorlie 68 2 1 — — 1 3 75 86 872 Other Asia Pacific — — 1 6 — — 1 8 — —
Asia Pacific 266 5 5 6 — 6 33 321 449 715 Ahafo 52 1 5 — — — 11 69 79 873 Akyem 54 3 2 — — — 11 70 116 603 Other Africa — — — 2 — — — 2 — —
Africa 106 4 7 2 — — 22 141 195 723 Corporate and Other — — 15 43 2 — 1 61 — — Total Gold $ 865 $ 38 $ 64 $ 59 $ 5 $ 9 $ 141 $ 1,181 1,343 $ 879 Copper Phoenix $ 27 $ 1 $ 1 $ — $ — $ 3 $ 2 $ 34 14 $ 2.43 Boddington 33 — — — — 3 3 39 19 2.05 Total Copper $ 60 $ 1 $ 1 $ — $ — $ 6 $ 5 $ 73 33 $ 2.21 Consolidated $ 925 $ 39 $ 65 $ 59 $ 5 $ 15 $ 146 $ 1,254
Newmont Mining Corporation I Goldman Sachs Conference I Slide 55 November 2016
All-in sustaining costs
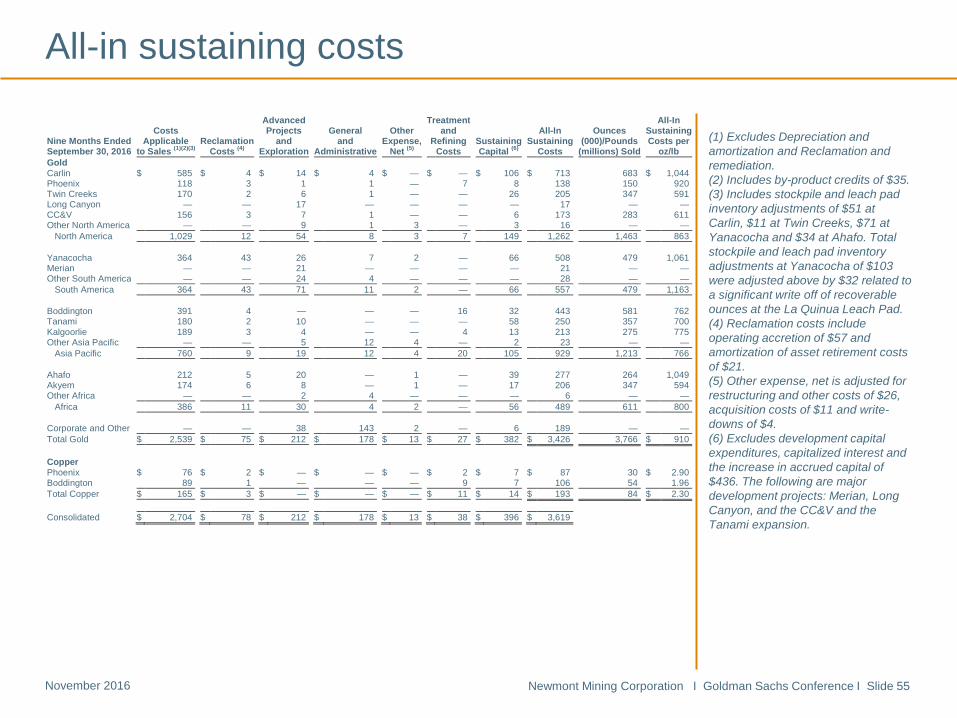
(1) Excludes Depreciation and amortization and Reclamation and remediation. (2) Includes by-product credits of $35. (3) Includes stockpile and leach pad inventory adjustments of $51 at Carlin, $11 at Twin Creeks, $71 at Yanacocha and $34 at Ahafo. Total stockpile and leach pad inventory adjustments at Yanacocha of $103 were adjusted above by $32 related to a significant write off of recoverable ounces at the La Quinua Leach Pad. (4) Reclamation costs include operating accretion of $57 and amortization of asset retirement costs of $21. (5) Other expense, net is adjusted for restructuring and other costs of $26, acquisition costs of $11 and write-downs of $4. (6) Excludes development capital expenditures, capitalized interest and the increase in accrued capital of $436. The following are major development projects: Merian, Long Canyon, and the CC&V and the Tanami expansion.
Advanced Treatment All-In Costs Projects General Other and All-In Ounces Sustaining Nine Months Ended Applicable Reclamation and and Expense, Refining Sustaining Sustaining (000)/Pounds Costs per September 30, 2016 to Sales (1)(2)(3) Costs (4) Exploration Administrative Net (5) Costs Capital (6) Costs (millions) Sold oz/lb Gold Carlin $ 585 $ 4 $ 14 $ 4 $ — $ — $ 106 $ 713 683 $ 1,044 Phoenix 118 3 1 1 — 7 8 138 150 920 Twin Creeks 170 2 6 1 — — 26 205 347 591 Long Canyon — — 17 — — — — 17 — — CC&V 156 3 7 1 — — 6 173 283 611 Other North America — — 9 1 3 — 3 16 — —
North America 1,029 12 54 8 3 7 149 1,262 1,463 863 Yanacocha 364 43 26 7 2 — 66 508 479 1,061 Merian — — 21 — — — — 21 — — Other South America — — 24 4 — — — 28 — —
South America 364 43 71 11 2 — 66 557 479 1,163 Boddington 391 4 — — — 16 32 443 581 762 Tanami 180 2 10 — — — 58 250 357 700 Kalgoorlie 189 3 4 — — 4 13 213 275 775 Other Asia Pacific — — 5 12 4 — 2 23 — —
Asia Pacific 760 9 19 12 4 20 105 929 1,213 766 Ahafo 212 5 20 — 1 — 39 277 264 1,049 Akyem 174 6 8 — 1 — 17 206 347 594 Other Africa — — 2 4 — — — 6 — —
Africa 386 11 30 4 2 — 56 489 611 800 Corporate and Other — — 38 143 2 — 6 189 — — Total Gold $ 2,539 $ 75 $ 212 $ 178 $ 13 $ 27 $ 382 $ 3,426 3,766 $ 910 Copper Phoenix $ 76 $ 2 $ — $ — $ — $ 2 $ 7 $ 87 30 $ 2.90 Boddington 89 1 — — — 9 7 106 54 1.96 Total Copper $ 165 $ 3 $ — $ — $ — $ 11 $ 14 $ 193 84 $ 2.30 Consolidated $ 2,704 $ 78 $ 212 $ 178 $ 13 $ 38 $ 396 $ 3,619
Newmont Mining Corporation I Goldman Sachs Conference I Slide 56 November 2016
All-in sustaining costs
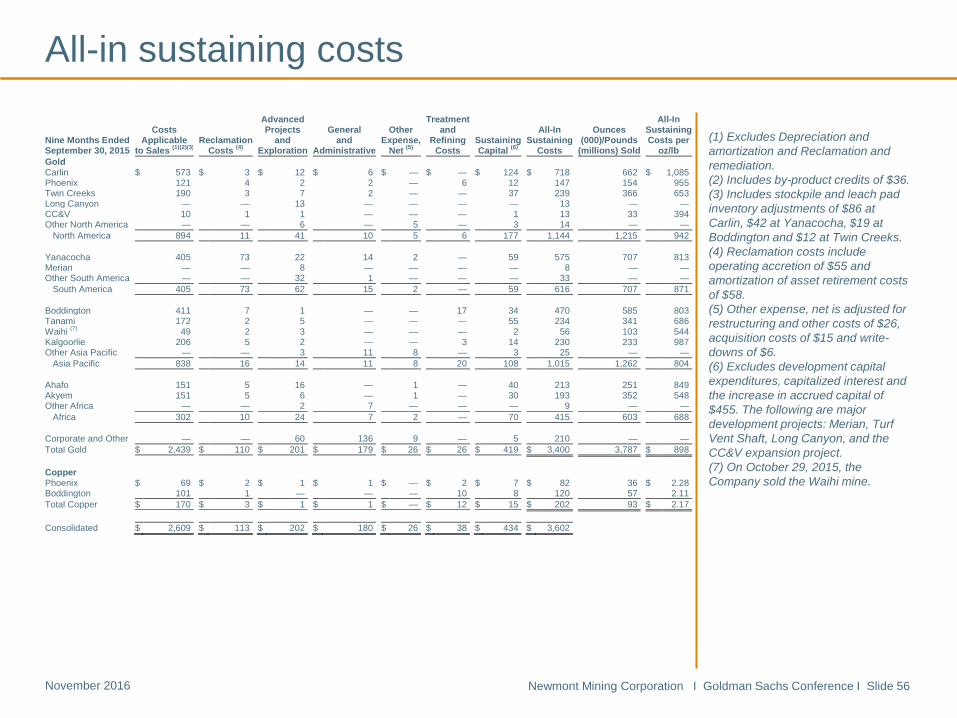
(1) Excludes Depreciation and amortization and Reclamation and remediation. (2) Includes by-product credits of $36. (3) Includes stockpile and leach pad inventory adjustments of $86 at Carlin, $42 at Yanacocha, $19 at Boddington and $12 at Twin Creeks. (4) Reclamation costs include operating accretion of $55 and amortization of asset retirement costs of $58. (5) Other expense, net is adjusted for restructuring and other costs of $26, acquisition costs of $15 and write-downs of $6. (6) Excludes development capital expenditures, capitalized interest and the increase in accrued capital of $455. The following are major development projects: Merian, Turf Vent Shaft, Long Canyon, and the CC&V expansion project. (7) On October 29, 2015, the Company sold the Waihi mine.
Advanced Treatment All-In Costs Projects General Other and All-In Ounces Sustaining Nine Months Ended Applicable Reclamation and and Expense, Refining Sustaining Sustaining (000)/Pounds Costs per September 30, 2015 to Sales (1)(2)(3) Costs (4) Exploration Administrative Net (5) Costs Capital (6) Costs (millions) Sold oz/lb Gold Carlin $ 573 $ 3 $ 12 $ 6 $ — $ — $ 124 $ 718 662 $ 1,085 Phoenix 121 4 2 2 — 6 12 147 154 955 Twin Creeks 190 3 7 2 — — 37 239 366 653 Long Canyon — — 13 — — — — 13 — — CC&V 10 1 1 — — — 1 13 33 394 Other North America — — 6 — 5 — 3 14 — —
North America 894 11 41 10 5 6 177 1,144 1,215 942 Yanacocha 405 73 22 14 2 — 59 575 707 813 Merian — — 8 — — — — 8 — — Other South America — — 32 1 — — — 33 — —
South America 405 73 62 15 2 — 59 616 707 871 Boddington 411 7 1 — — 17 34 470 585 803 Tanami 172 2 5 — — — 55 234 341 686 Waihi (7) 49 2 3 — — — 2 56 103 544 Kalgoorlie 206 5 2 — — 3 14 230 233 987 Other Asia Pacific — — 3 11 8 — 3 25 — —
Asia Pacific 838 16 14 11 8 20 108 1,015 1,262 804 Ahafo 151 5 16 — 1 — 40 213 251 849 Akyem 151 5 6 — 1 — 30 193 352 548 Other Africa — — 2 7 — — — 9 — —
Africa 302 10 24 7 2 — 70 415 603 688 Corporate and Other — — 60 136 9 — 5 210 — — Total Gold $ 2,439 $ 110 $ 201 $ 179 $ 26 $ 26 $ 419 $ 3,400 3,787 $ 898 Copper Phoenix $ 69 $ 2 $ 1 $ 1 $ — $ 2 $ 7 $ 82 36 $ 2.28 Boddington 101 1 — — — 10 8 120 57 2.11 Total Copper $ 170 $ 3 $ 1 $ 1 $ — $ 12 $ 15 $ 202 93 $ 2.17 Consolidated $ 2,609 $ 113 $ 202 $ 180 $ 26 $ 38 $ 434 $ 3,602
Newmont Mining Corporation I Goldman Sachs Conference I Slide 57 November 2016
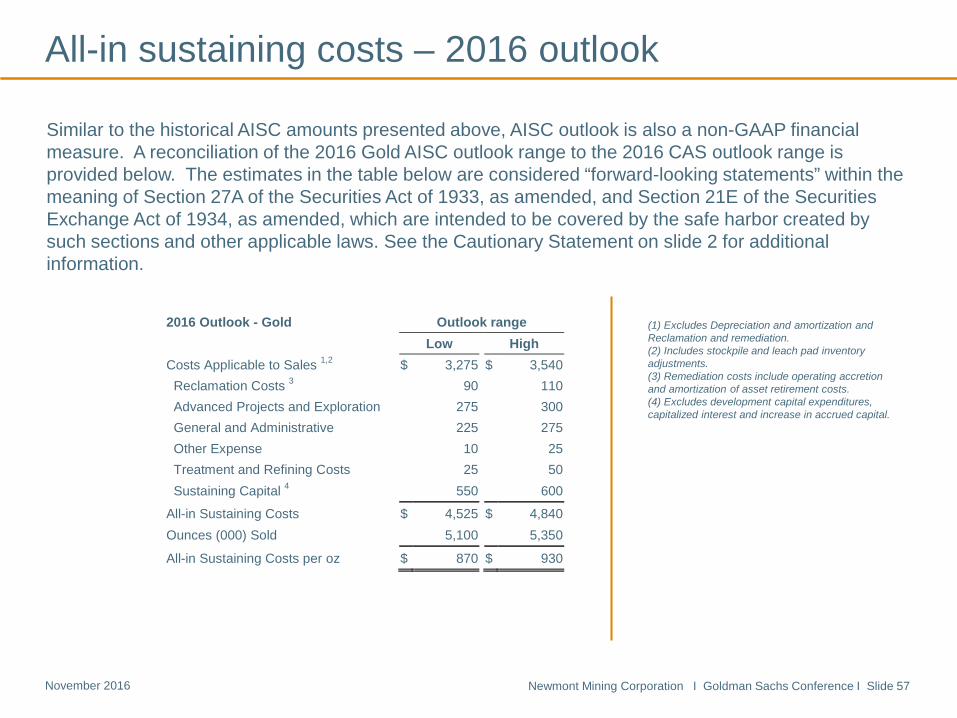
All-in sustaining costs – 2016 outlook
(1) Excludes Depreciation and amortization and Reclamation and remediation. (2) Includes stockpile and leach pad inventory adjustments. (3) Remediation costs include operating accretion and amortization of asset retirement costs. (4) Excludes development capital expenditures, capitalized interest and increase in accrued capital.
2016 Outlook - Gold Outlook range
Low High Costs Applicable to Sales 1,2 $ 3,275
$ 3,540
Reclamation Costs 3 90 110
Advanced Projects and Exploration 275 300
General and Administrative 225 275
Other Expense 10 25
Treatment and Refining Costs 25 50
Sustaining Capital 4 550 600
All-in Sustaining Costs $ 4,525 $ 4,840
Ounces (000) Sold 5,100 5,350
All-in Sustaining Costs per oz $ 870 $ 930
Similar to the historical AISC amounts presented above, AISC outlook is also a non-GAAP financial measure. A reconciliation of the 2016 Gold AISC outlook range to the 2016 CAS outlook range is provided below. The estimates in the table below are considered “forward-looking statements” within the meaning of Section 27A of the Securities Act of 1933, as amended, and Section 21E of the Securities Exchange Act of 1934, as amended, which are intended to be covered by the safe harbor created by such sections and other applicable laws. See the Cautionary Statement on slide 2 for additional information.
Newmont Mining Corporation I Goldman Sachs Conference I Slide 58 November 2016
Endnotes
Investors are encouraged to read the information contained in this presentation in conjunction with the following notes, the Cautionary Statement on slide 2 and the factors described under the “Risk Factors” section of the Company’s Form 10-K, filed with the SEC on February 17, 2016, Form 10-Q filed with the SEC on October 26, 2016, and disclosure in the Company’s other recent SEC filings.
1. Historical AISC or All-in sustaining cost is a non-GAAP metric. See slides 52 to 57 for more information and a reconciliation to the nearest GAAP metric. All-in sustaining cost (“AISC”) as used in the Company’s Outlook is a non-GAAP metric defined as the sum of cost applicable to sales (including all direct and indirect costs related to current gold production incurred to execute on the current mine plan), remediation costs (including operating accretion and amortization of asset retirement costs), G&A, exploration expense, advanced projects and R&D, treatment and refining costs, other expense, net of one-time adjustments and sustaining capital.
2. Free cash flow is a non-GAAP metric and is generated from Net cash provided from continuing operations less Additions to property, plant and mine development. See slides 47 and 48 for more information and for a reconciliation to the nearest GAAP metric. Newmont’s Free Cash Flow Per Share is calculated using company disclosures and competitors’ Free Cash Flow Per Share is calculated using Cash From Operations less Capital Expenditures as sourced from Thomson Reuters.
3. EBITDA is a non-GAAP financial measure calculated as Earnings before interest, taxes and depreciation and amortization. The EBITDA figures for competitors used in this presentation were calculated by Thomson Reuters. For management’s EBITDA calculations and reconciliation to the nearest GAAP metric, please see slide 49 for more information. Adjusted EBITDA is also a non-GAAP metric. Please refer also to slide 49 for a reconciliation of Adjusted EBITDA to the nearest GAAP metric.
4. Outlook projections used in this presentation are considered ―forward-looking statements‖ and represent management’s good faith estimates or expectations of future production results as of October 26, 2016. Outlook is based upon certain assumptions, including, but not limited to, metal prices, oil prices, certain exchange rates and other assumptions. For example, 2016 Outlook assumes $1,300/oz Au, $2.00/lb Cu, $0.75 USD/AUD exchange rate and $50/barrel WTI; AISC and CAS cost estimates do not include inflation, for the remainder of the year. Production, AISC and capital estimates exclude projects that have not yet been approved (Twin Underground, Ahafo Mill Expansion and Subika Underground). The potential impact on inventory valuation as a result of lower prices, input costs, and project decisions are not included as part of this Outlook. Unless otherwise indicated, Outlook also does not include Batu Hijau, the sale of which remains pending. Assumptions used for purposes of Outlook may prove to be incorrect and actual results may differ materially from those anticipated. Consequently, Outlook cannot be guaranteed. As such, investors are cautioned not to place undue reliance upon Outlook and forward-looking statements as there can be no assurance that the plans, assumptions or expectations upon which they are placed will occur
5. U.S. investors are reminded that reserves were prepared in compliance with Industry Guide 7 published by the SEC. Whereas, the term resource, measured resource, indicated resources and inferred resources are not SEC recognized terms. Newmont has determined that such resources would be substantively the same as those prepared using the Guidelines established by the Society of Mining, Metallurgy and Exploration and defined as Mineral Resource. Estimates of resources are subject to further exploration and development, are subject to additional risks, and no assurance can be given that they will eventually convert to future reserves. Inferred resources, in particular, have a great amount of uncertainty as to their existence and their economic and legal feasibility. Investors are cautioned not to assume that any part or all of the inferred resource exists, or is economically or legally mineable. Inventory and upside potential have a greater amount of uncertainty. Investors are cautioned that drill results illustrated in certain graphics in this presentation are not necessarily indicative of future results or future production. Even if significant mineralization is discovered and converted to reserves, during the time necessary to ultimately move such mineralization to production the economic and legal feasibility of production may change. As such, investors are cautioned against relying upon those estimates. For more information regarding the Company’s reserves, see the Company’s Annual Report filed with the SEC on February 17, 2016 for the Proven and Probable Reserve tables prepared in compliance with the SEC’s Industry Guide 7, which is available at www.sec.gov or on the Company’s website. Investors are further reminded that the reserve and resource estimates used in this presentation are estimates as of December 31, 2015.
6. Adjusted Net Income is a non-GAAP metric. See slides 50 and 51 for more information and reconciliation to the nearest GAAP metric.