Embed Size (px)
Citation preview

VERTEX SECURITIES LIMITED

VERTEX-COMPANY PROFILE
• VERTEX is a premier brokerage house in India on the fast growth track.• Vertex started functioning in the
stock market in 1993.• VERTEX Group, a leading financial
and investment service company in India. –Vertex Securities Ltd–Vertex Commodities &Finpro (P)Ltd.

VERTEX is a member of the National Stock Exchange of India (NSE), the Bombay Stock Exchange, the National Commodities Derivatives Exchange Ltd (NCDEX), and Multi Commodity Exchange of India (MCX). VERTEX is a full-fledged depository participant of the National Securities Depository Ltd.

VARIOUS DEPARTMENTS
• BACKOFFICE DEPARTMENT• TRADING DEPARTMENT• ADMIN DEPARTMENT

BACKOFFICE DEAPRTMENT
• FUNDAMENTAL NEEDS TO PARTICIPATE– DEMAT ACCOUNT– TRADING ACCOUNT
• QUERIES REGARDING PARTICIPATING IN STOCK EXCHANGE
• HANDLING THE ACCOUNTS OF A COMPANY
• KYC

TRADING DEPARTMENT
• ACTUAL TRADING TAKES PLACE• TRADING – EQUITIES AND
COMMODITIES• OPTION : STOP LOSS• ODIN CLIENT SOFTWARE

ADMIN DEPARTMENT
• Client transaction management • Brokerage • Client management

AVENUES OF INVESTMENT
• STOCK MARKET FUNDAMENTAL ANALYSIS TECHNICAL ANALYSIS• COMMODITIES MARKET

9
FUNDAMENTAL
ANALYSIS

10
• Fundamental analysis is the technique of applying the tenets of the firm foundation theory to the selection of individual stocks

11
About company
• TCS • HCL• Infosys• Tech mahindra• Wipro

12
Parameters used
• EPS• P/E ratio• PEG ratio• P/s ratio• P/b Ratio• Return on net worth• Dividend pay-out ratio

13
• EPS = Earnings/(No of shares)• P/E ratio = Martketprice/(EPS)• PEG ratio= P/E / (projected growth in
earnings• p/s ratio = Market Cap / Revenues• P/B ratio = Marketprice/(book value)• ReturnNetworth = Net income aftertax
/(networth)• DYR = Divident/(share price)
FORMULAS

14
Company
EPS p/e ratio
Book value
p/b ratio
Peg ratio
p/s ratio
Dividend payout ratio (in %)
Return on net worth
Market price( in july)
TCS 102.6 24.51 224.90
11.19 1.39 5.37 1.27 48.2 2516.45
Wipro 32.8 16.35 118.98
4.50 1.18 3.08 1.31 27.6 536
Infosys
185.7 17.99 733.03
4.56 1.25 252.94
1.89 26.1 3341.3
HCL 85.44 17.74 146.09
10.37 1.28 191.22
0.79 44 1515.55
Tech mahindra
111.28
19.12 365.81
5.81 1.06 2.74 0.94 42.1 2127.25

15
OBSERVATION
• Infosys Earnings capabilities more then Tech mahindra and TCS.
• High P/B ratio determine the price premium– TCS>HCL>Tech Mahindra
• ROE : TCS> HCL> Techmahindra• Low dividend pay-out – HCL , Tech mahindra• Industrial P/E -> 22.13– TCS is more– Tech Mahindra is close to
Industrial P/E

16
Compay EPS p/eratio
Bookvalue
p/bratio
Dividentpayoutratio(%)
Returnon networth
Marketprice( injul)
BAJAJ AUTO
112.1618.90
332.046.38
450%38.51
2121.65
MARUTI SUZUKI INDIA
96.4527.15
707.163.70 160%
12.87 2622.60
MRF 1803.9512.99
8594.712.73
250%20.02
23434.35
BOSCH 302.94
44.73
2004.62 6.74 550%14.05 13630.45
FUNDAMENTAL ANALYSIS OF AUTOMOBILE INDUSTRY

17
TECHNICAL ANALYSIS
18
PARAMETERS USED
• Value at Risk• Relative Strength Index

19
COMPANIES
• MRF• TIDE WATER OIL• STRIDES AROCLAB• LASKHMI MILL• BOSCH• JK BANK• SHREE CEMENT• GODREY PHILIP• UB HOLDINGS• INFOSYS

20
VALUEAT
RISK

21
What is value at risk?
• Value-at-Risk analyses provide the risk manager with a single measurement of the risk faced by that institution at a particular time.
• The Value-at-Risk is the maximum loss that the institution is likely to face within a given time period with (usually) a 95% probability.

22
Methods of calculating VaR
• Variance – covariance• Historic • Monte Carlo simulation

23
Formula
VaR(95%) = p * σ * z
P=price of the shareσ=standard deviation
Z=Z value

24
For example
An MRF stock is trading at Rs.23050 with a one-year standard deviation of 20%
In the normal distribution, 95% confidence level is 1.645standard deviations away from the mean.
Therefore, our VaR at 95% confidence level will be:
VaR(95%) = 23050*0.20*1.645 = 7583.45
25
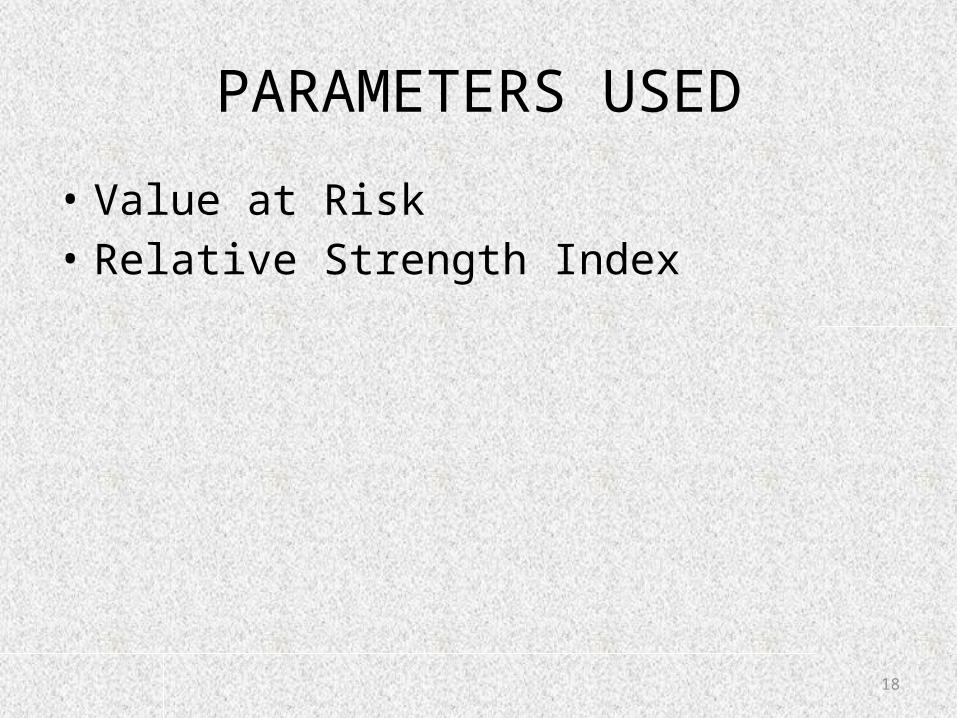
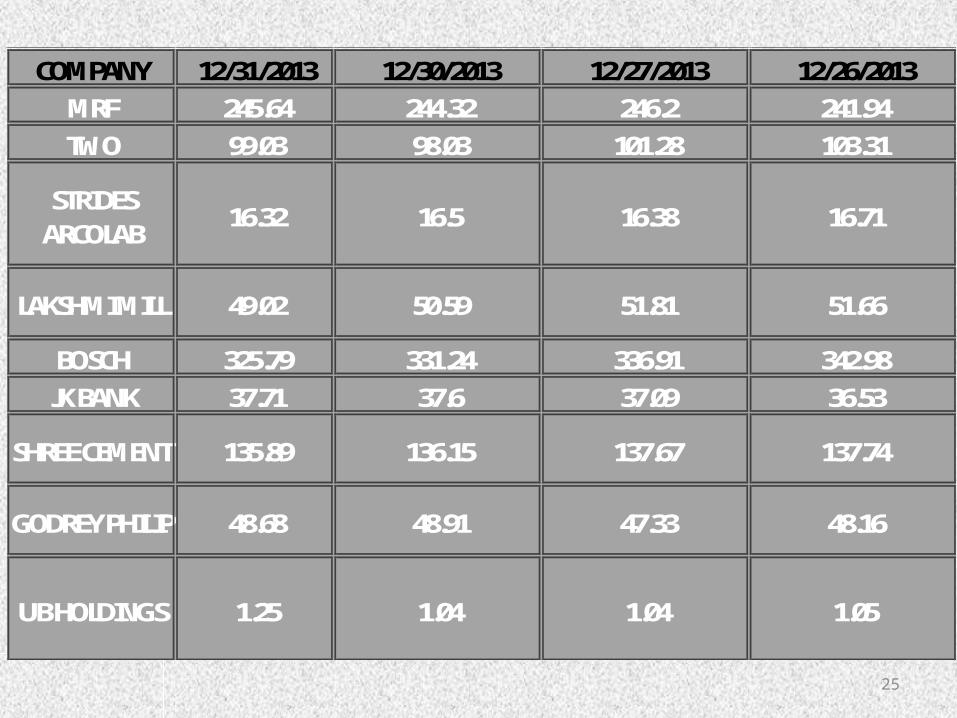
COMPANY 12/31/2013 12/30/2013 12/27/2013 12/26/2013MRF 245.64 244.32 246.2 241.94TWO 99.03 98.03 101.28 103.31
STRIDES ARCOLAB
16.32 16.5 16.38 16.71
LAKSHMI MILL 49.02 50.59 51.81 51.66
BOSCH 325.79 331.24 336.91 342.98JK BANK 37.71 37.6 37.09 36.53
SHREE CEMENT 135.89 136.15 137.67 137.74
GODREY PHILIP 48.68 48.91 47.33 48.16
UB HOLDINGS 1.25 1.04 1.04 1.05
26
RELATIVE STRENGTH
INDEX

27
RELATIVE STRENGTH INDEX
• It is an oscillator used to identify the inherent technical strength and weakness of a particular scrip or market.
• A technical momentum indicator that compares the magnitude of recent gains to recent losses in an attempt to determine overbought and oversold conditions of an asset.

28
• The RSI can be calculated for any number of days depending on the wish of the technical analyst and the time frame trading adopted in a particular stock market.
• RSI is calculated for 5, 7, 9 and 14 days. If the time period taken for calculation is more, the possibility of getting wrong signals is reduced.
29
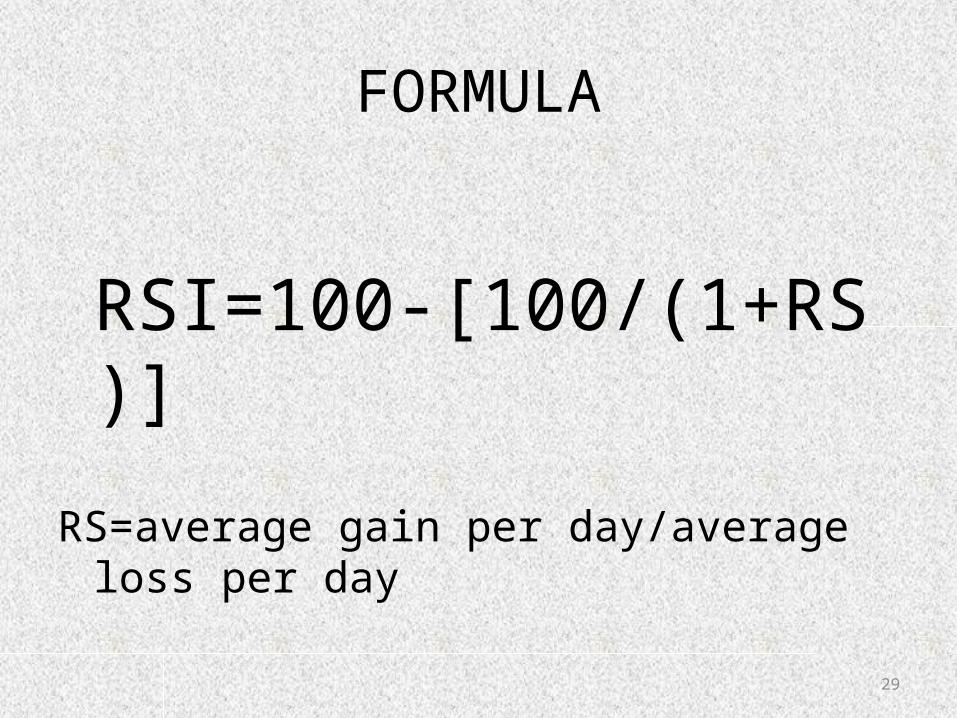
FORMULA
RSI=100-[100/(1+RS)]
RS=average gain per day/average loss per day

ExampleDATE PRICE CHANGE
1/3/2011 7356.4 01/4/2011 7406.8 50.41/5/2011 7326.85 -79.951/6/2011 7179.95 -146.91/7/2011 7059.65 -120.31/10/2011 6670.5 -389.151/11/2011 6596.85 -73.651/12/2011 6684.3 87.451/13/2011 6675.7 -8.61/14/2011 6579 -96.7
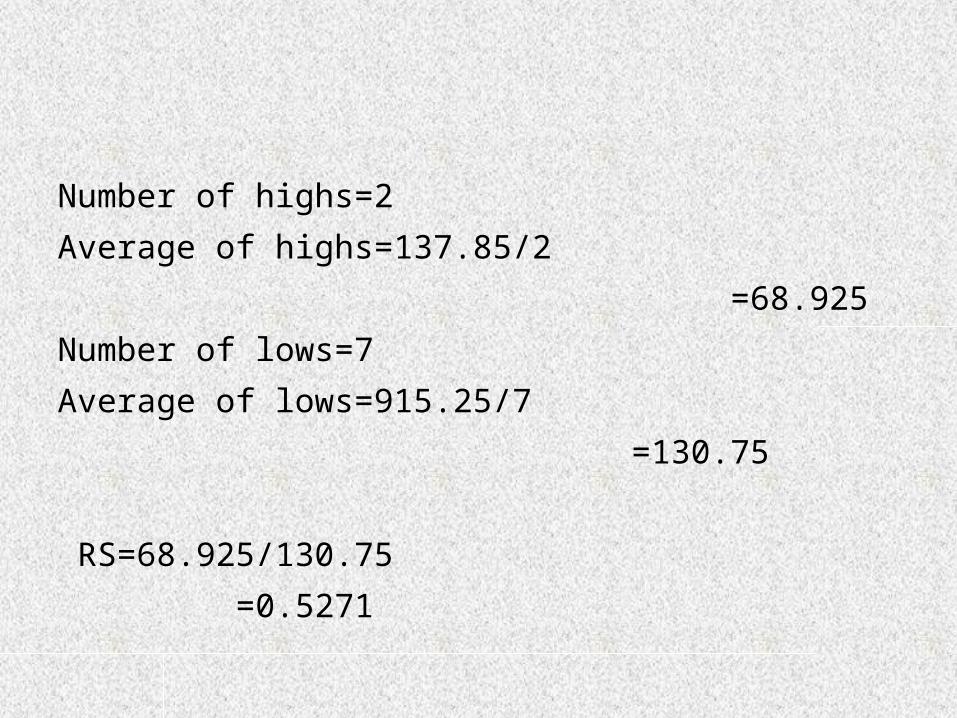
Number of highs=2 Average of highs=137.85/2 =68.925Number of lows=7Average of lows=915.25/7 =130.75
RS=68.925/130.75 =0.5271

• RSI=100-[100/(1+0.5271)] =34.5164
33
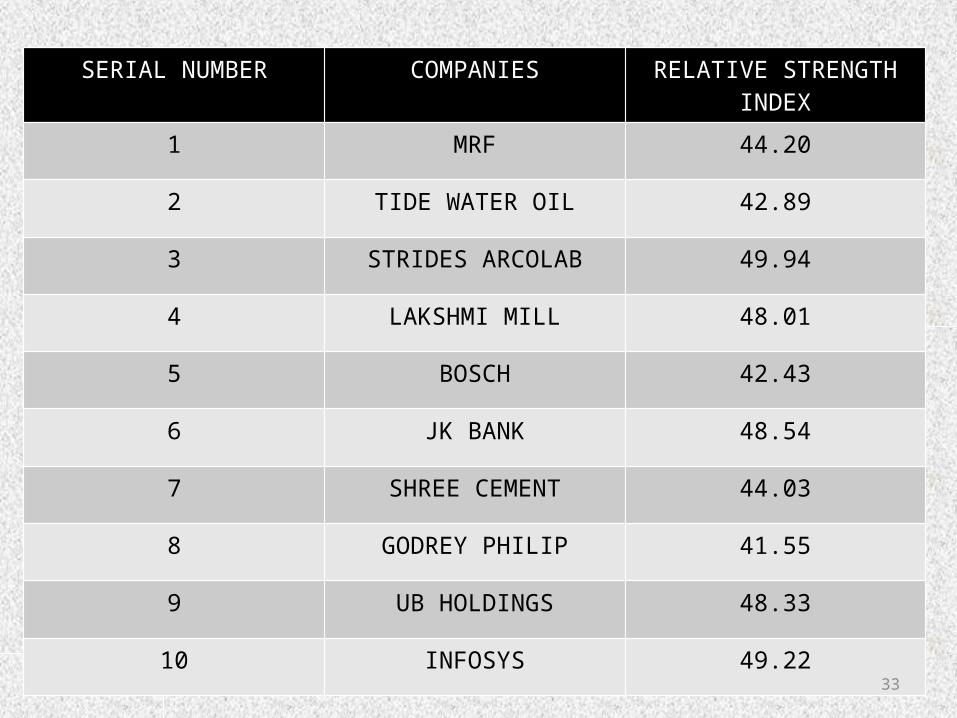
SERIAL NUMBER COMPANIES RELATIVE STRENGTH INDEX
1 MRF 44.20
2 TIDE WATER OIL 42.89
3 STRIDES ARCOLAB 49.94
4 LAKSHMI MILL 48.01
5 BOSCH 42.43
6 JK BANK 48.54
7 SHREE CEMENT 44.03
8 GODREY PHILIP 41.55
9 UB HOLDINGS 48.33
10 INFOSYS 49.22

34
INTERPRETATIONS
• 0-30 Buy mode• 40-70 (mean + standard deviation) above the mean – sell mode below the mean – buy mode• 70-100 Sell mode

35
GOLD INVESTMENT
S

36
OBJECTIVES OF THE STUDY
PRIMARY OBJECTIVE
To analyze the performance of the GOLD-ETF in national stock exchange (NSE) with reference to vertex securities.
SECONDARY OBJECTIVES
To find out the risk and correlation in between the gold ETF and commodity,spot market.To find out the best performing gold avenues in the capital market.To find out the long (buy) and short (sell) signal of the GOLD-ETF in NSE.To give suggestion to the investors regarding the investment of money in GOLD-ETF.

37
SAMPLING DESIGNA sample design is a definite plan for obtaining a sample from a given population. It refers to the technique of the procedure the researcher would adopt in selecting items for the sample. Sample design may as well lay down the number of items to be included in the sample i.e., the size of the sample. Sample size:The population of the study is 5 companies which involves in issuing of Gold ETF. Sample size is also 5.
SAMPLING METHOD Census Sampling is the sampling method used here. When the entire population is enumerated for sampling its known as census sampling.
PERIOD OF STUDY The period of the study is confined from 23rd June to 22nd july 2014 (4 weeks)
SAMPLING FRAME Gold Exchange Traded Fund.•SBI Mutual Fund - SBI Gold Exchange Traded Scheme – Growth Option•Kotak Mutual Fund - Gold Exchange Traded Fund•Axis Mutual Fund - Axis Gold ETF•Religare Mutual Fund - Religare Gold Exchange Traded Fund•Birla sunlife exchange traded fund

38
DEFINITION
EXCHANGE-TRADED FUND - ETFA security that tracks an index, a commodity or a basket of assets like an index fund, but trades like a stock on an exchange. ETFs experience price changes throughout the day as they are bought and sold.
Structure of ETF:

39
MCXMulti Commodity Exchange of India is a de-mutualised online commodity exchange of India promoted by Financial Technologies (I) Ltd, SBI, Fidelity International, NSE, NABARD, HDFC Bk, SBI Life Insurance Co., Union Bank of India, Canara Bank, Bank of India, Bank of Baroda and Corporation Bank.
Products
BullionsMetalsenergyOil & oil seedspulsesCerealsFibersPlantationsothers

40
S. No Parameter Jewellery Bank Gold ETF MCX-GOLD
1How Gold is held
Physical (Bars / Coins)
Physical (Bars / Coins)
Dematerialized (Electronic Form)
Dematerialized (Electronic Form)
2 Pricing
Differs from one to another. Neither transparent nor standard.
Differs from bank to bank. Not Standard.
Linked to International Gold Prices and very transparent.
Linked to International Gold Prices and very transparent.
3
Buying Premium above gold price
Likely to be more
Likely to be more Likely to be less
More in case of Physical delivery
4 Making ChargesCharges are incurred
Charges are incurred
No Charges are incurred
No Charges are incurred
5 Impurity Risk High Nil Nil Nil
6Storage Requirement Locker / Safe Locker / Safe Demat Account Demat Account
7Security of Asset
Investor is responsible
Investor is responsible
Fund House takes the responsibility
Fund House takes the responsibility
8 ResaleConditional and uneconomical
Banks do not buy back
At Secondary Market Prices
Not applicable after physical delivery
Overall comparison of means of Gold investment:

41
9Convenience in Buying / Selling
Less convenient, as Gold needs to be moved physically
Less convenient, as Gold needs to be moved physically
More Convenient, as held in electronic form under the demat account
More Convenient, as held in electronic form under the demat account
10Quantity to Buy / Sell
Available in standard denomination
Available in standard denomination
Minimum is ½ or 1 gram according to the fund
Minimum 10 grams
11 Bid Ask Spread Very High Can’t Sell Back Very Low
12 Risk of Theft Yes, possible Yes, possible No, Not possible No, Not possible
13 Wealth Tax Yes Yes No
14
Long Term Capital Gains Tax
Only after 3 years
Only after 3 years After 1 year
15 Delivery Centre Single Single Single Multiple
16 Market timings 10 AM-7AM 10 AM- 5PM 9 AM-3.30 PM 10 AM-11.55PM

42
Advantages of ETFs
•Tradable and Diversifiable•Low Cost•Transparency•Multiple Trading Strategies•Best during Bear markets•Convenience•Option Strategies•Passively Managed
Disadvantages of ETFs
•A new Market Concept•Large Investments•Brokerage Charges•Premiums and Discounts•Costly in Certain Situations

43
THANK YOU!!!