Embed Size (px)
Citation preview

Klöckner & Co- A Leading Multi Metal Distributor -
Gisbert Rühl
CFO
Deutsche Bank10th German Corporate Conference
20 � 21 June 2007

2
Agenda
1. Overview, Market and Strategy
Appendix
2. Financials and Outlook
3
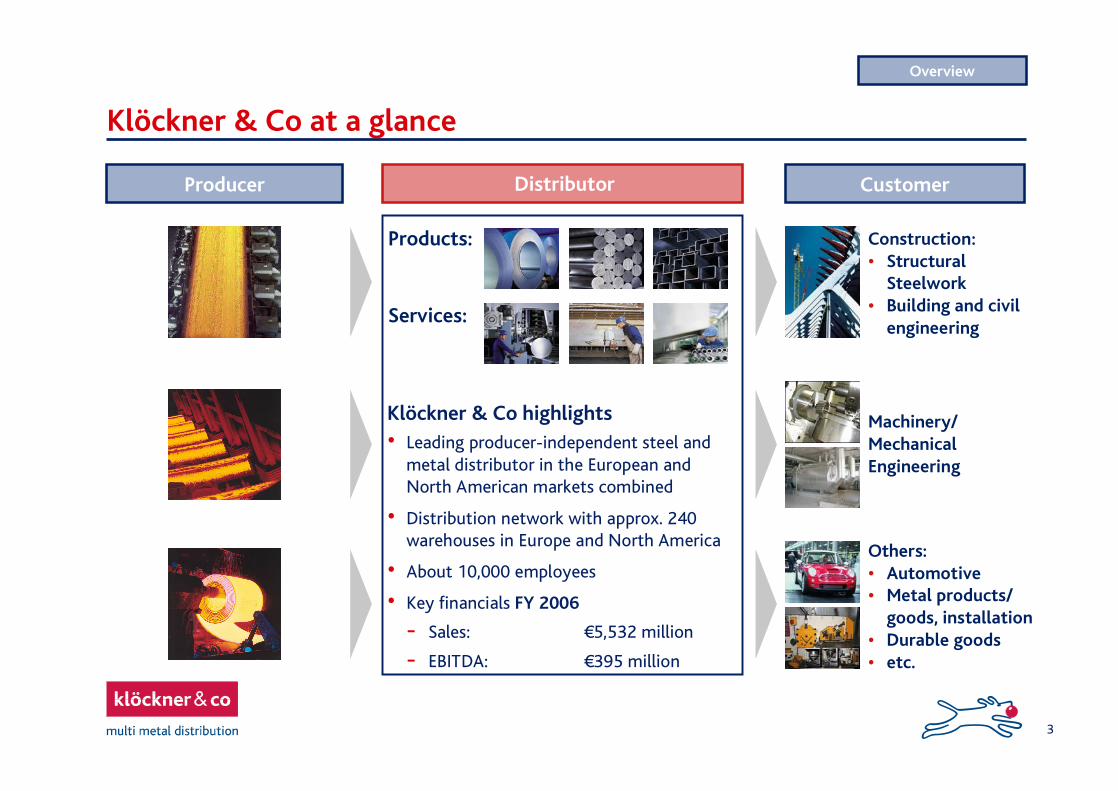
Klöckner & Co at a glance
Klöckner & Co highlights� Leading producer-independent steel and
metal distributor in the European and North American markets combined
� Distribution network with approx. 240 warehouses in Europe and North America
� About 10,000 employees
� Key financials FY 2006
- Sales: �5,532 million
- EBITDA: �395 million
DistributorProducer Customer
Products:
Services:
Construction:� Structural
Steelwork� Building and civil
engineering
Machinery/MechanicalEngineering
Others:� Automotive� Metal products/
goods, installation� Durable goods� etc.
Overview

4
Local customersGlobal suppliers
Distributor in the sweet spot
Suppliers SourcingProducts and services
Logistics/Distribution
Customers
� Global Sourcing in competitive sizes
� Strategic partnerships
� Frame contracts
� Leverage one supplier against the other
� No speculative trading
� One-stop-shop with wide product range of high-quality products
� Value added processing services
� Quality assurance
� Efficient inventory management
� Local presence
� Tailor-made logistics including on-time delivery within 24 hours
� > 200,000 customers
� No customer with more than 1% of sales
� Average order size of �2,000
� Wide range of industries and markets
� Service more important than price
� Purchase volume p.a. of 6 million tones
� Diversified set of worldwide ca. 70 suppliers
� Examples:
Klöckner & Co�s value chain
Overview

5
Global reach with broad product and customer diversification
Overview
CDN
B D
F
E
CH ACZ
PL
LT
RO
NLCN
USA
GBIRL
Germany/Austria 23%
France/Belgium 21%
Switzerland 15%
Spain 10%
UK 9%
Nether-lands 6%
Eastern Europe 1%
USA 10% (incl. Primary 17%)Canada 5%
Sales split by markets (2006)
Steel-flat Products28%
Steel-long Products 31%
Tubes 9%
Special &QualitySteel 10%
Aluminum 8%
Other Products 14%
Sales split by product (2006)
Construc-tion 40%
Machinery/Manufacturing 20%
Auto-motive 5%
Other 35%
Sales split by industry (2006)About 250 locations (June 2007)
D 25 LocationsF 76 Locations CH 31 LocationsE 48 LocationsUK 24 LocationsIRL 1 LocationNL 7 LocationsEastern Europe 4 LocationsCDN 5 LocationsUSA 28 Locations

6
Market and StrategyStrong position in Europe; Primary significantly improved position in NA
Europe (2006)
Arcelor Mittal AM3S 11%(Sales Distribution approx. 5%)
ThyssenKrupp 8%
Other Independents
~45-55%
Klöckner & Co 7%
Corus 4%
Structure: 67% through distribution, service centersSize in value: ~�70�90bnCompanies: ~3,000 few mill-tied, most independent
Only independent in top tier
Source: EuroMetal, Company reports, Klöckner & Co estimates
Namasco (Klöckner & Co) 1.0%
Ryerson 4.7%
Olympic Steel 0.8%Source: Purchasing Magazine (May 2007)
Namasco + Primaryapprox. 1.4%
Other72.5%
Reliance Steel4.5%
Samuel, Son & Co.2.1%
ThyssenKrupp Materials NA
2.5%
Russel Metals1.8%
Worthington Steel1.3%
Metals USA1.4%
Carpenter Technology 0.9%
PNA Group 1.2%
McJunkin1.3%
O'Neal Steel1.8%
MacSteel1.4%
AM Castle 0.9%
Structure: 50-60% through distribution, service centersSize in value: ~�100bnCompanies: ~1,300 only independent distributors
North America (2006)
Other Mill-Tied Distributors
~15-25%

7
Industry trends supporting Klöckner�s strategy
Market and Strategy
Globalization and
consolidation
Higher raw-material costs
� Flattened global steel cost curve in favour of developed-market steel producers
Stable global demand growth
� Far quicker destocking� High capacity utilisation of steel mills
� Large costs savings� Higher and more flexible capacity utilization� Much better supply discipline and higher pricing power creates better balance
between supply and demand
� On-going consolidation favouring large scale distributors
� Higher prices with much shorter downturns support more stable earnings and cash flows for distributors
Impact on distribution
industry

8
Profitable growth
Strategy
Profitable growth through value-added distribution and services within multi metals to companies in Europe and North America
Grow more thanthe market
Continuous businessoptimization
1 Acquisitions driving market consolidation
2 Organic growth and expansion into new markets
3 STAR Program:- Purchasing- Distribution network- Inventory management

9
Acquisitions driving market consolidation
Next steps
Focus on targets at attractive valuations in 3 directions� Expansion in new regions� Extension of product base� Extension of customer base
Strategy
Benefits Significant synergies
� Streamlining operations, processes and sales force
� Integration of STAR
Economies of scale
� Stronger purchasing power
Market and Strategy
Acquisitions
� 2005: 2 acquisitions with total sales of �141m� 2006: 4 acquisitions with total sales of �108m� 2007: 8 acquisitions with total sales of �501m
so far06/2007: Westok
�26 million sales; 90 employees
05/2007: Premier Steel
�23 million sales; 34 employees
04/2007: Stahlhandel Zweygart
�11 million sales; 22 employees
04/2007: Max Carl
�15 million sales; 19 employees
04/2007: Edelstahlservice�17 million sales; 49 employees
04/2007: Primary Steel
�360 million sales; 412 employees
04/2007: Teuling
�14 million sales; 16 employees
01/2007: Tournier
�35 million sales; 41 employees
1

10
Organic growth and expansion into new markets2
Status Quo
� Strong growth in core markets above GDP partly as a result of the outstanding development of the construction and machinery industries and steel prices
� Improved performance mainly in Germany and France due to organizational changes
� Eastern European facilities established in Poland, Czech Republic, Romania and Baltic States
Next steps
Expansion of strong market positions in core markets:
� Selective extension of product range
� Increase value added services through investments in new processing capacity
� Extension of customer base
� Opening of new branches in Eastern Europe
Leveraging existing distribution network
Strategy
Benefits Sustainable profitable growth
Strategy

11
Purchasing � Status Quo
� Improved performance as a result of restructureddistribution network (warehouses):
- 2006: Close-down of 3 warehouses in Northern Germany
- 2006: Optimization of warehouse structure in the Lyon area in France
- Q1 2007: Concentration of warehouse structure in the Iowa-region in US
- Q1 2007: Restructuring of service center business in Switzerland
� Start of roll-out of the optimization-tool �Prodacapo�(activity based costing) in Spain
3
Next steps
STAR: Status quo Q1 2007 and next steps
Distribution � Status Quo Next steps
� Continuous improvement of distribution network throughout the Group with support of the optimization-tool �Prodacapo�
- Ongoing roll-out throughout European countries
� Finalize implementation of SAP throughout the European organization (France, Switzerland) and interface SAP with Prodacapo
� Implement unified article code
� Establish European sourcing (STAR Phase II)
� Increase sourcing from world-class suppliers with structural cost advantages
� Additional Frame contracts with main suppliers
� Extended global sourcing for third party countries
� Implementation of new organization in Germany (January 1, 2007) started
Market and Strategy

12
3 STAR: Phase I finalized in 2008, further potential in Phase II
Phase I (2005 - 2008)
Overall targets:
� Central purchasing on country level, especially in Germany
� Improvement of distribution network
� Improvement of inventory management
2006: ~ �20 million
2007: ~ �40 million
2008: ~ �20 million
~ �80 million
Phase II (2008 onwards)
Phase I upside potential
Overall targets:
� European Sourcing
� Ongoing improvement of distribution network
Strategy

13
Agenda
1. Overview, Market and Strategy
Appendix
2. Financials and Outlook

14
Summary Income Statement Q1 2007
Financials
� Strong sales increase mainly driven by further steel price increases and acquisitions
� Significant increase of EBITDA driven by favourable steel price level and STAR program
� Rise in adjusted EBITDA (w/o one-offs) even higher because of strong operational performance
Comments
--0.86Earnings per Share in �-3140Net income-66Minority interests--13-22Income taxes-5068Income before taxes--14-10Financial result
+ 21.46578EBIT-5.65.8% margin adjusted
+ 23.07491EBITDA adjusted-6.05.9% margin
+ 16.17992EBITDA-21.619.8% margin
+ 7.6285307Gross profit+17.11,3231,550Sales
Ä %Q1
2006
Q1
2007
(�m)

15
Segment Performance Q1 2007
Financials
Comments
� Sales for Q1 2007 in Europe including about �5 million from Aesga (E), about �2 million from Gauss (CH), about �8 million from Targe (F) and �11 million from Tournier (F)
� Sales for Q1 2007 in North America including about �13 million from Action Steel
1,550
-
211
1,339
SalesQ1 2007
+16.17992+17.11,323Total
--17-7--HQ / Consol.
- 25.91914-5.5224North America
+10.27785+21.71,099Europe
Ä%EBITDA
Q1 2006EBITDAQ1 2007
Ä%Sales
Q1 2006(�m)

16
Balance Sheet Q1 2007
Comments
Financial debt as of March 31, 2007:� Nominal value of HYB: �170 million� ABS: �175 million� Bilateral credit facilities: �173 million� Increased net financial debt mainly due to higher
NWC
Equity:� Increase driven by strong results� Equity ratio of about 30% almost stable
(as of December 31, 2006: 31%)
Net Working Capital:� Increase in line with the additional sales
Rating:
� Moody�s increased rating to �Ba2� with stableoutlook
Financials
477
1,299
2,841
-
838
1,244
435
756
841
2,841
65
72
1,136
1,002
566
March 31
2007
933Trade receivables
841Inventories
579Long-term assets
130Cash & Cash equivalents
69Other assets
639- thereof trade payables
-Other liabilities
1,009Total short-term liabilities
744Total long-term liabilities
799Equity
2,552Total assets
416- thereof financial liabilities
December 31
2006
(�m)
2,552Total equity and liabilities
365Net financial debt
1,135Net Working Capital

17
Statement of Cash Flow
� Strong business development reflected in positive cash flow deriving from operational activities and increased NWC requirements
� Investing cash flow in Q1 2007 mainly impacted by cash outflow due to the acquisition of Tournier
Comments
Financials
-2-16Others
40-88Cash Flow from operating activities
271Inflow from disposals of fixed assets/others
-9-18Outflow from investments in fixed assets
18-17Cash flow from investing activities
-33-164Changes in net working capital
-1251Changes in financial liabilities
7592Operating result before balance sheet changes
44-58Total Cash Flow
-1548Cash flow from financing activities
--Dividends
-3-3Net interest payments
Q1
2006
Q1
2007
(�m)

18
Challenging financial targets throughout the cycle
Financials
GeneralTarget/Limit
ActualQ1 2007
General financial Targets and Limits
Underlying sales growth
Underlying EBITDA margin
Leverage (Net financial debt/EBITDA LTM)
Gearing (Net financial debt/Equity)
> 10% p.a
> 6%
< 3.0x
< 150%
17.1%
5.8%
1.1x
57%

19
New holding facility increases scope for further acquisitions
Debt structure
1,460+3701,090Total Facilities
--170170High Yield Bond
980+500480Total Senior Bank Facilities
380-100480Bilateral Credit Agreements
600+600-Syndicated Loan
480+40440Total
60-60ABS USA
420+40380ABS Europe
New Debt
Structure*
Change in
Debt Structure
Current Debt
Structure
(�m)
* Post High Yield Bond redemption

20
Outlook / Guidance 2007
Basic Assumptions for 2007
� Positive prospects for the steel industry
� Economic growth in relevant markets of about 1.8% -5% in 2007
� Stable and increasing demand especially in the construction and machinery industries
� Price development stable or better
- Price rise in H1
Outlook
Guidance
� At least 15% top line growth mainly driven by acquisitions
� EBITDA approximately on reported 2006 level
� Dividend continuity: 30% payout ratio after deduction of extraordinary income
Again strong results in 2007

21
Financial Calendar 2007 and Contact Details
Contact Details Investor Relations
Claudia Nickolaus, Head of IR
Phone: +49 (0) 203 307 2050Fax: +49 (0) 203 307 5025E-mail: [email protected]: www.kloeckner.de
Contact
Financial Calendar 2007
June 20: General Shareholders� Meeting
August 15: Q2 Interim Report
September 19: Analysts� and Investors� Meeting
November 14: Q3 Interim Report

22
Agenda
1. Overview, Market and Strategy
Appendix
2. Financials and Outlook

23
Table of contents
Appendix
� Quarterly/FY Results 2006/2005
� Steel cycle and EBITDA/cash flow relationship
� Example Bordeaux with 50% loss making customers
� IPO on 28 June 2006 followed by free float increase

24
Quarterly Results and FY Results 2006/2005
* Pro-forma consolidated figures for FY 2005, without release of negative goodwill of �139 million and without transaction costs of �39 million, without restructuring expenses of �17 million (incurred Q4) and without activity disposal of �1,9 million (incurred Q4).
Appendix
-4.44-0.971.641.150.86Earnings per Share in �
352063145765440Net income
172869856Minority interests
-29-39-13-22-2016-22Income taxes
8127350751054368Income before taxes
-54-64-14-14-24-12-10Financial result
13533765891285578EBIT
4.07.16.07.310.35.05.9% margin
197395791041437092EBITDA
19.921.821.622.322.521.019.8% margin
9871,208285316313294307Gross profit
4,9645,5321,3231,4181,3941,3981,550Sales
FY
2005*
FY
2006
Q1
2006
Q2
2006
Q3
2006
Q4
2006
Q1
2007
(�m)

25
Comments
Klöckner & Co buys and sells products at spot prices generally
Sales increase as a function of the steel price inflation environment
Cost of material are based on an average cost method for inventory and therefore lag the steel price increase
This time lag creates accounting windfall profits (windfall losses in a decreasing steel price environment) inflating (deflating) EBITDA
Assuming stable inventory volume cash flow is impacted by higher NWC needs
The windfall profits (losses) are mirrored by inventory book value increases (decreases)
Theoretical relationship*
1 2 3 4 5 6 7 8 9 10 11 12 13
Steel price Sales Cost of material EBITDA Cash flow
Windfallprofits
Windfall losses
(�m)
Margin
Margin
1
2
3
4
4
5
6 6
Steel cycle and EBITDA/cash flow relationship
*Assuming stable inventory volumes
Appendix

26
Example Bordeaux with 50% loss making customers
48% 48%
14%
9%
25%
52%
All customers Negative cust. ROS 0 to -10% ROS -10% to -20% ROS < -20%
Customer profitability split
Customers 1237 597 177 109 311100% 48% 14% 9% 25%
Tonnes 11,685 1,920 1,273 376 272100% 23% 15% 4% 5%
Tons / line 0.170 0.056 0.082 0.056 0.023
Customer profitability analyzed with activity based costing Software �ProDacapo�
Fully loaded results show that half of the customers have a negative profitability� Account for 23% of tonnes sold� Main driver is low turnover per line
leading to high fix handling costs
The driver is a mere gross margin oriented sales approach with limited understanding for process costs
Measures taken are focussing on an improved pricing approach� Small order surcharges� Surcharges for services (cutting etc.)� Freight cost recovery pricing� Profit would almost double if negative
customers only reach break even
Online customer profitability calculation in SAP system under development
DiscussionNumber of customers split by profitability classes
Prof
itab
leN
egat
ive
Appendix

27
IPO on 28 June 2006 followed by free float increase
IPO Highlights
Issue price: �16 per share
Offer Size: �264 million; of which Klöckner received �104 million gross proceeds from the capital increase
Placement: 16.5 million shares (in total 46.5 million shares); thereof:
� 6.5 million new shares from a capital increase
� 10 million from the selling shareholder Lindsay Goldberg & Bessemer (via Multi Metal Investment S.à.r.l.)
Current shareholder structure
April 2007 sell-down� Free float 100%
January 2007 sell-down� LGB/Management 15.5%� Free float 84.5%
October 2006 sell-down� LGB/Management 45.0%� Free float 55.0%
Post-IPO� LGB/Management 65.0%� Free float 35.0%
� Mainly large European Institutional Investors� Increasing share of US Investors� Growing share of Retail Investors
Appendix

28
Our symbol

29
This presentation contains forward-looking statements. These statements use words like "believes, "assumes," "expects" or similar formulations. Various known and unknown risks, uncertainties and other factors could lead to material differences between the actual future results, financial situation, development or performance of our company and those either expressed or implied by these statements. These factors include, among other things:
Downturns in the business cycle of the industries in which we compete; Increases in the prices of our raw materials, especially if we are unable to pass these costs along
to customers; Fluctuation in international currency exchange rates as well as changes in the general economic
climateand other factors identified in this presentation.In view of these uncertainties, we caution you not to place undue reliance on these forward-looking statements. We assume no liability whatsoever to update these forward-looking statements or to conform them to future events or developments.
Disclaimer