Embed Size (px)
Citation preview
Oslo, March 2, 2017
2
Notice to Recipients
This presentation is not a prospectus and is not an offer to sell, nor a solicitation of an offer to buy, securities.
Except for the historical information contained herein, the matters discussed in this presentation include forward-looking
statements that involve risks and uncertainties. These risks and uncertainties include, among other things, market
conditions and other factors that are described in KNOT Partners’ filings with the U.S Securities and Exchange
Commission, which are available on the SEC’s website at http://www.sec.gov.
Nevertheless, new factors emerge from time to time, and it is not possible for KNOT Partners to predict all of these
factors. Further, KNOT Partners cannot assess the impact of each such factor on its business or the extent to which any
factor, or combination of factors, may cause actual results to be materially different from those contained in any forward-
looking statement. KNOT Partners expressly disclaims any intention or obligation to revise or publicly update any
forward-looking statements whether as a result of new information, future events or otherwise. The forward-looking
statements contained herein are expressly qualified by this cautionary notice to recipients.
3
Agenda
1. Knutsen Group
2. KNOT Offshore Partners LP (KNOP)
4
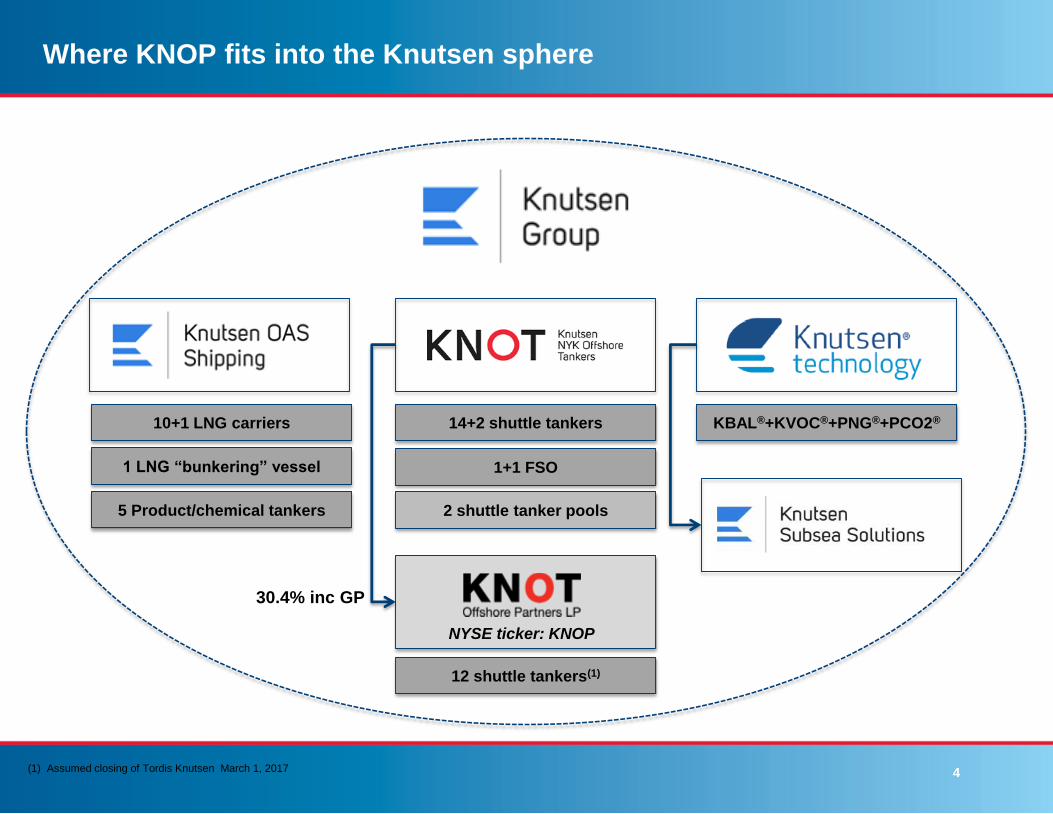
Where KNOP fits into the Knutsen sphere
10+1 LNG carriers
5 Product/chemical tankers
14+2 shuttle tankers
1+1 FSO
33%
12 shuttle tankers(1)
2 shuttle tanker pools
KBAL®+KVOC®+PNG®+PCO2®
NYSE ticker: KNOP
30.4% inc GP
1 LNG “bunkering” vessel
(1) Assumed closing of Tordis Knutsen March 1, 2017
5
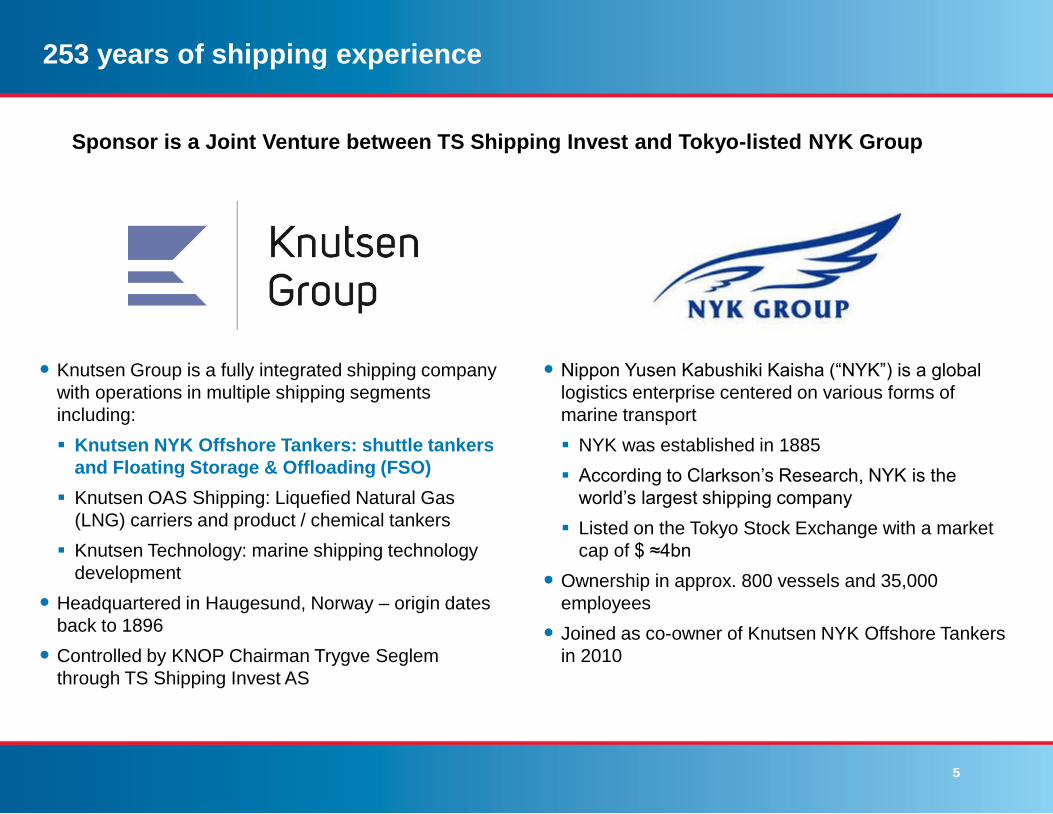
253 years of shipping experience
Sponsor is a Joint Venture between TS Shipping Invest and Tokyo-listed NYK Group
Nippon Yusen Kabushiki Kaisha (“NYK”) is a global
logistics enterprise centered on various forms of
marine transport
NYK was established in 1885
According to Clarkson’s Research, NYK is the
world’s largest shipping company
Listed on the Tokyo Stock Exchange with a market
cap of $ ≈4bn
Ownership in approx. 800 vessels and 35,000
employees
Joined as co-owner of Knutsen NYK Offshore Tankers
in 2010
Knutsen Group is a fully integrated shipping company
with operations in multiple shipping segments
including:
Knutsen NYK Offshore Tankers: shuttle tankers
and Floating Storage & Offloading (FSO)
Knutsen OAS Shipping: Liquefied Natural Gas
(LNG) carriers and product / chemical tankers
Knutsen Technology: marine shipping technology
development
Headquartered in Haugesund, Norway – origin dates
back to 1896
Controlled by KNOP Chairman Trygve Seglem
through TS Shipping Invest AS
6
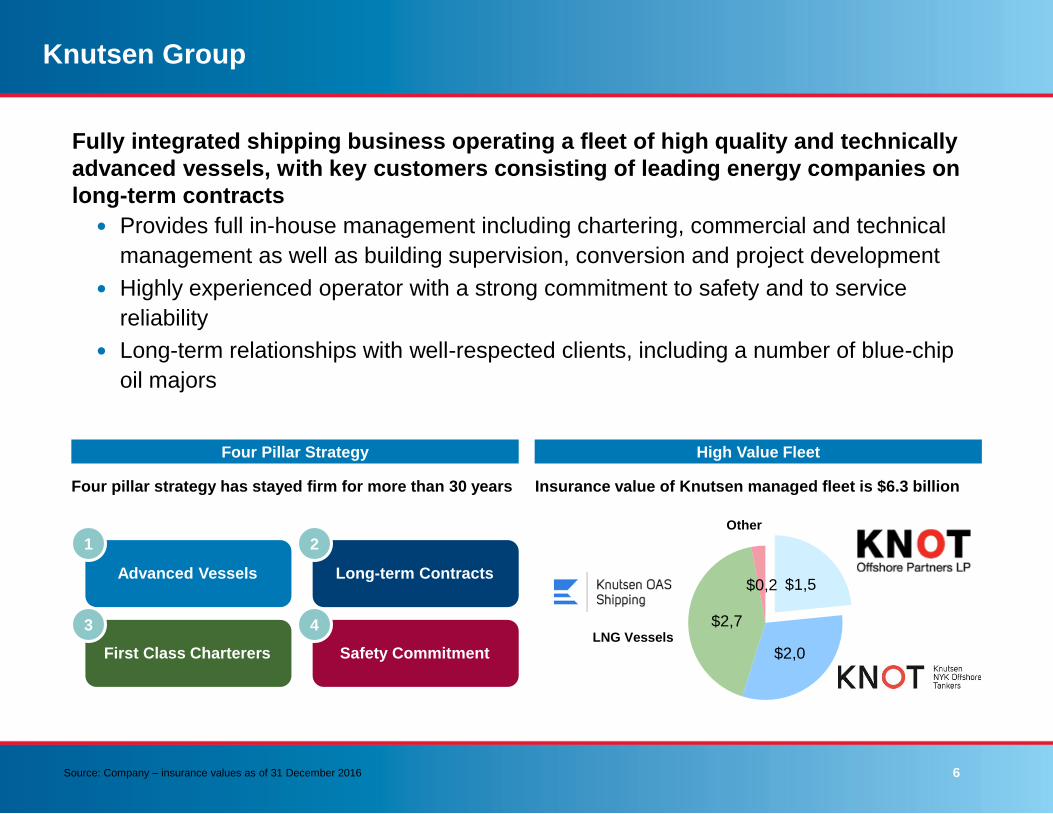
$1,5
$2,0
$2,7
$0,2
Knutsen Group
High Value Fleet
Fully integrated shipping business operating a fleet of high quality and technically
advanced vessels, with key customers consisting of leading energy companies on
long-term contracts
Provides full in-house management including chartering, commercial and technical
management as well as building supervision, conversion and project development
Highly experienced operator with a strong commitment to safety and to service
reliability
Long-term relationships with well-respected clients, including a number of blue-chip
oil majors
Insurance value of Knutsen managed fleet is $6.3 billion
First Class Charterers Safety Commitment
Advanced Vessels Long-term Contracts
3 4
1 2
Four Pillar Strategy
Four pillar strategy has stayed firm for more than 30 years
Other
LNG Vessels
Source: Company – insurance values as of 31 December 2016
7
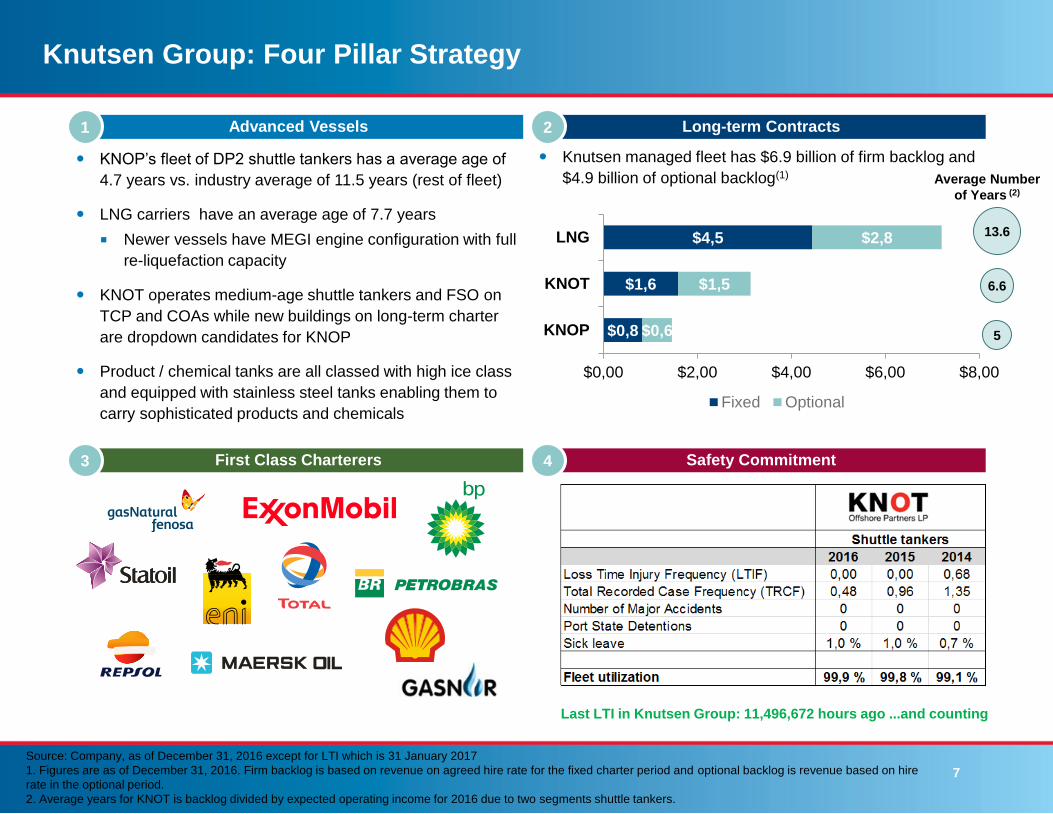
$0,8
$1,6
$4,5
$0,6
$1,5
$2,8
$0,00 $2,00 $4,00 $6,00 $8,00
KNOP
KNOT
LNG
Fixed Optional
Knutsen Group: Four Pillar Strategy
First Class Charterers
Advanced Vessels
3 Safety Commitment4
1 Long-term Contracts2
Knutsen managed fleet has $6.9 billion of firm backlog and
$4.9 billion of optional backlog(1) Average Number
of Years (2)
13.6
6.6
5
KNOP’s fleet of DP2 shuttle tankers has a average age of
4.7 years vs. industry average of 11.5 years (rest of fleet)
LNG carriers have an average age of 7.7 years
Newer vessels have MEGI engine configuration with full
re-liquefaction capacity
KNOT operates medium-age shuttle tankers and FSO on
TCP and COAs while new buildings on long-term charter
are dropdown candidates for KNOP
Product / chemical tanks are all classed with high ice class
and equipped with stainless steel tanks enabling them to
carry sophisticated products and chemicals
Source: Company, as of December 31, 2016 except for LTI which is 31 January 2017
1. Figures are as of December 31, 2016. Firm backlog is based on revenue on agreed hire rate for the fixed charter period and optional backlog is revenue based on hire
rate in the optional period.
2. Average years for KNOT is backlog divided by expected operating income for 2016 due to two segments shuttle tankers.
Last LTI in Knutsen Group: 11,496,672 hours ago ...and counting
8
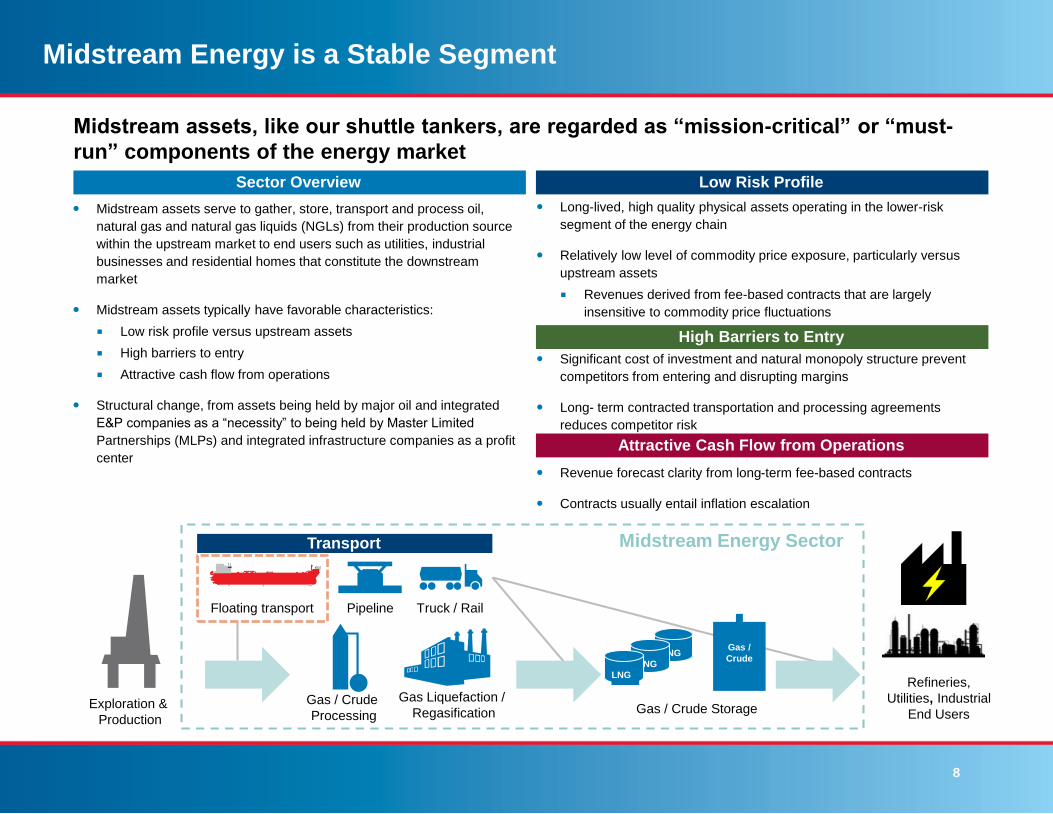
Midstream Energy is a Stable Segment
Long-lived, high quality physical assets operating in the lower-risk
segment of the energy chain
Relatively low level of commodity price exposure, particularly versus
upstream assets
Revenues derived from fee-based contracts that are largely
insensitive to commodity price fluctuations
Significant cost of investment and natural monopoly structure prevent
competitors from entering and disrupting margins
Long- term contracted transportation and processing agreements
reduces competitor risk
Midstream assets, like our shuttle tankers, are regarded as “mission-critical” or “must-
run” components of the energy market
Revenue forecast clarity from long-term fee-based contracts
Contracts usually entail inflation escalation
Attractive Cash Flow from Operations
Sector Overview
Midstream assets serve to gather, store, transport and process oil,
natural gas and natural gas liquids (NGLs) from their production source
within the upstream market to end users such as utilities, industrial
businesses and residential homes that constitute the downstream
market
Midstream assets typically have favorable characteristics:
Low risk profile versus upstream assets
High barriers to entry
Attractive cash flow from operations
Structural change, from assets being held by major oil and integrated
E&P companies as a “necessity” to being held by Master Limited
Partnerships (MLPs) and integrated infrastructure companies as a profit
center
Low Risk Profile
High Barriers to Entry
Exploration &
Production
Refineries,
Utilities, Industrial
End Users
Pipeline Truck / RailFloating transport
Gas / Crude
Processing
LNG
LNG
LNG
Gas /
Crude
Gas Liquefaction /
Regasification Gas / Crude Storage
Transport Midstream Energy Sector
9
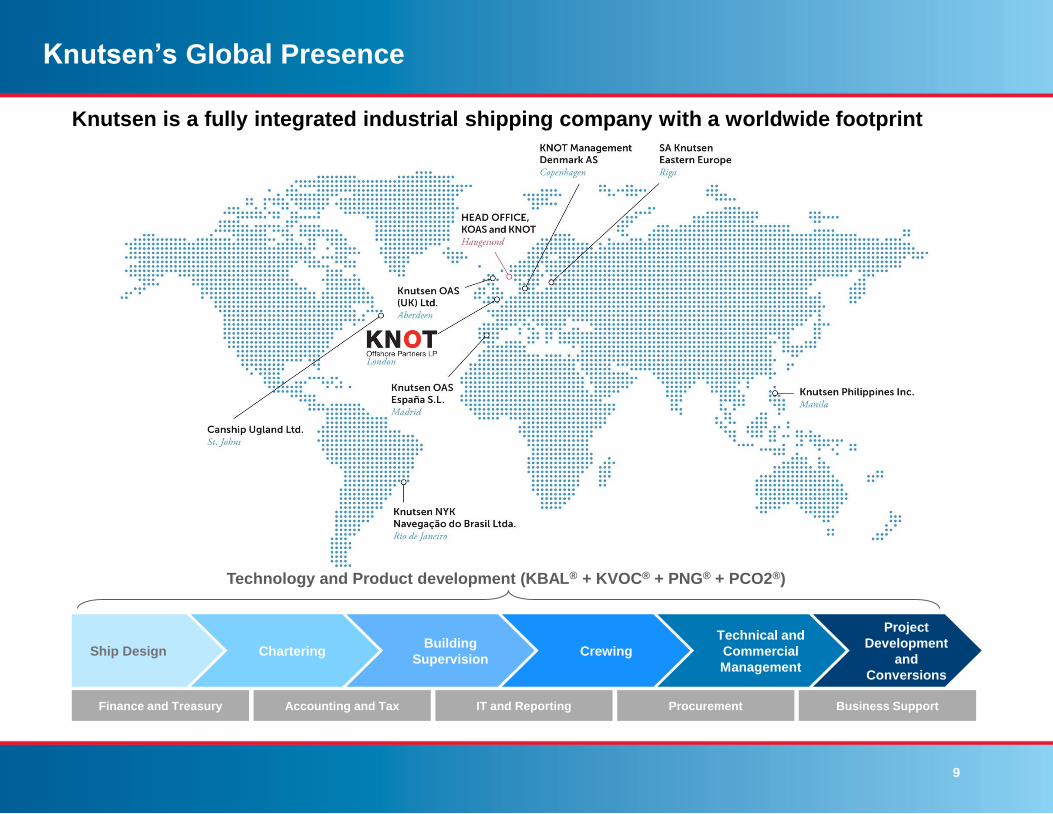
Knutsen’s Global Presence
Project
Development
and
Conversions
Ship Design CharteringBuilding
SupervisionCrewing
Technical and
Commercial
Management
Finance and Treasury Accounting and Tax IT and Reporting Procurement Business Support
Technology and Product development (KBAL® + KVOC® + PNG® + PCO2®)
Knutsen is a fully integrated industrial shipping company with a worldwide footprint
10
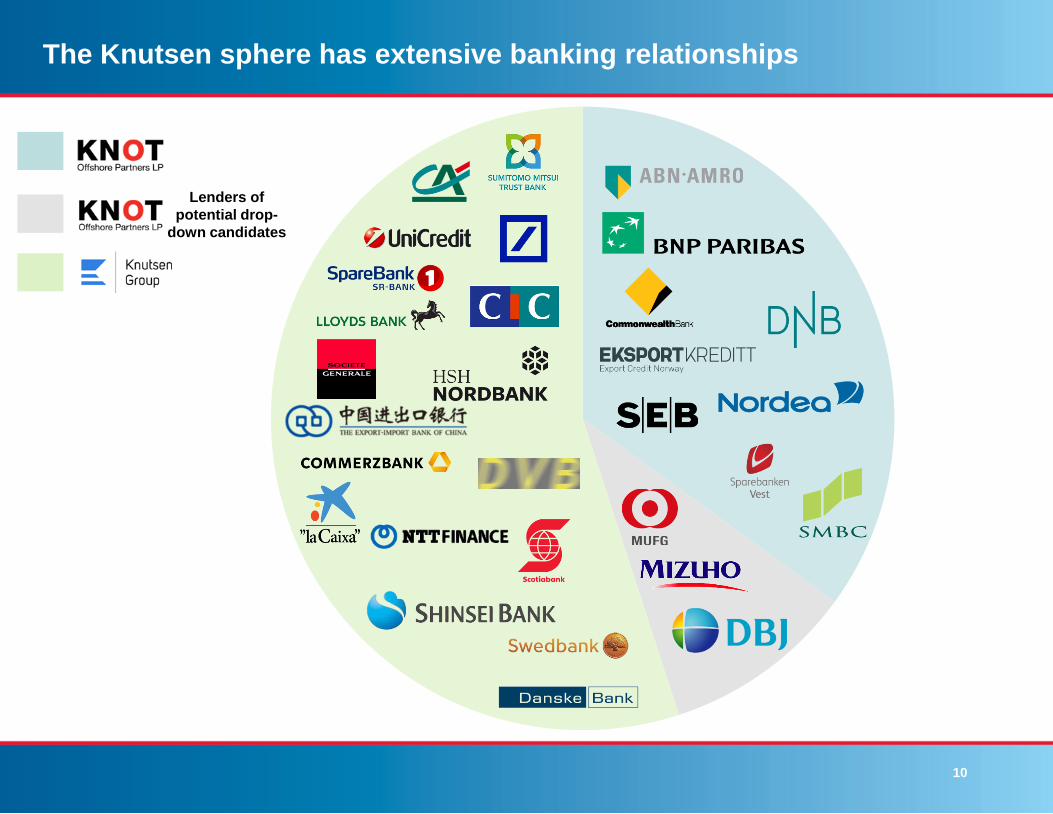
The Knutsen sphere has extensive banking relationships
Lenders of
potential drop-
down candidates
11
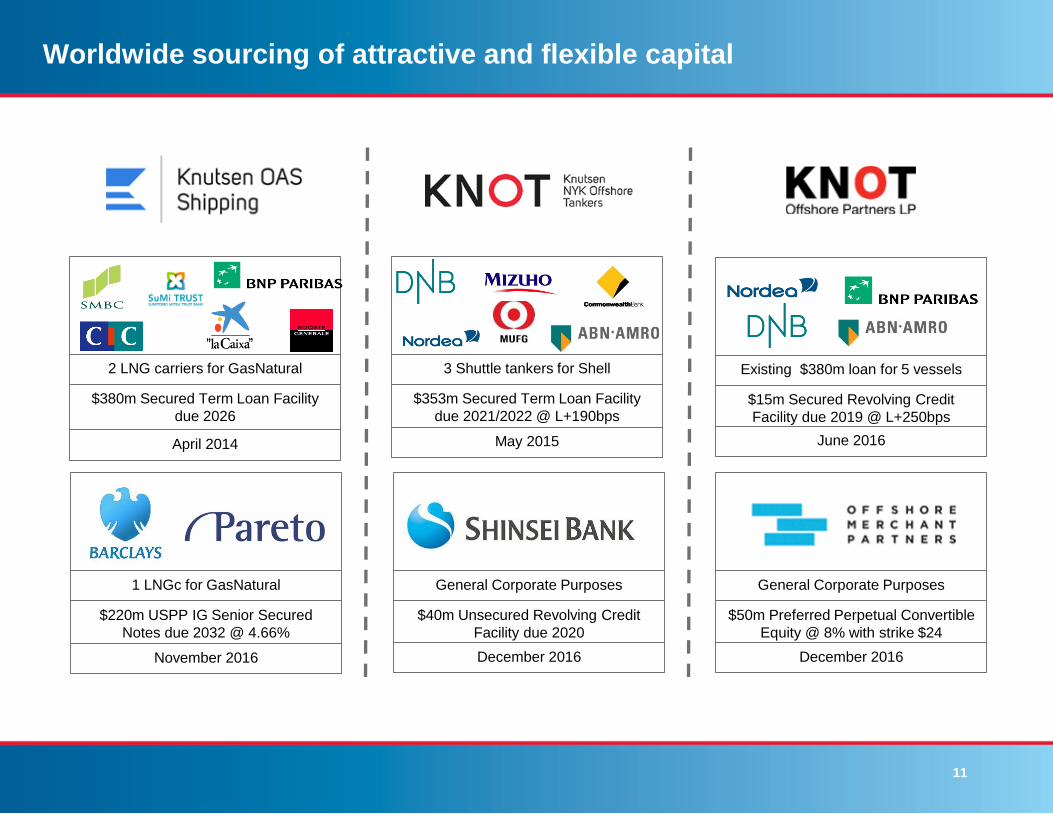
Worldwide sourcing of attractive and flexible capital
May 2015
$353m Secured Term Loan Facility
due 2021/2022 @ L+190bps
3 Shuttle tankers for Shell
November 2016
$220m USPP IG Senior Secured
Notes due 2032 @ 4.66%
1 LNGc for GasNatural
December 2016
$50m Preferred Perpetual Convertible
Equity @ 8% with strike $24
General Corporate Purposes
December 2016
$40m Unsecured Revolving Credit
Facility due 2020
General Corporate Purposes
April 2014
$380m Secured Term Loan Facility
due 2026
2 LNG carriers for GasNatural
June 2016
$15m Secured Revolving Credit
Facility due 2019 @ L+250bps
Existing $380m loan for 5 vessels
12
Agenda
1. Knutsen Group
2. KNOT Offshore Partners LP (KNOP)
13
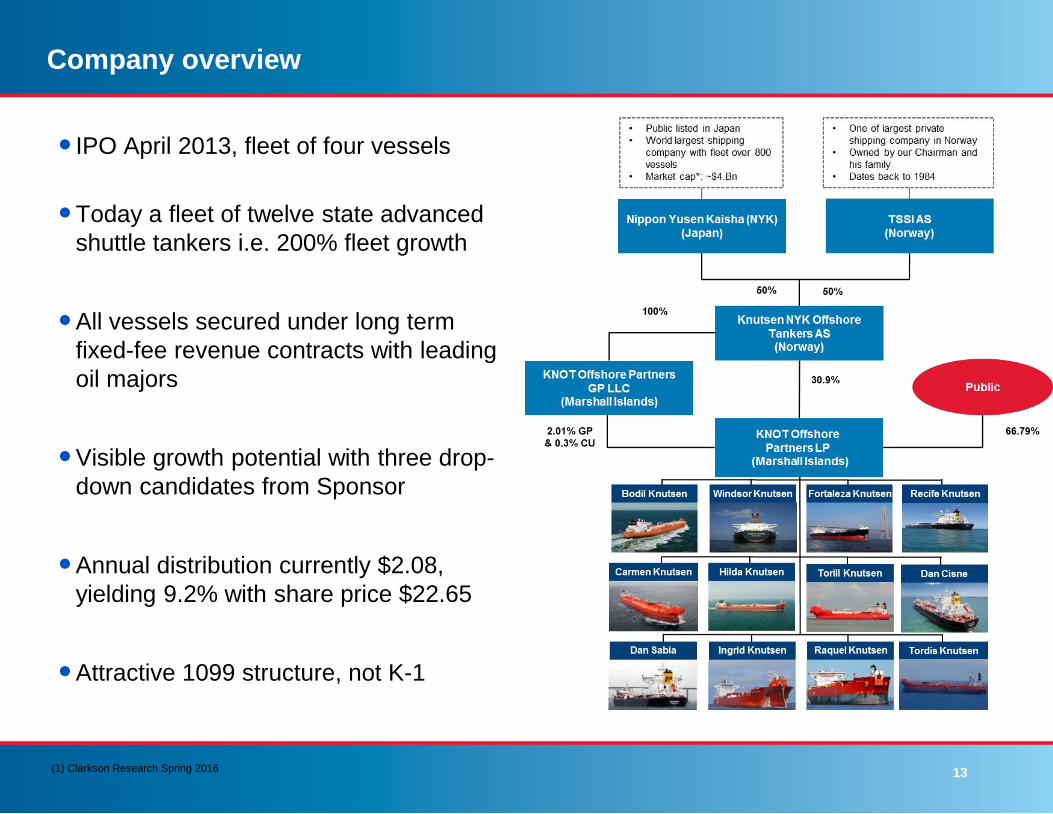
Company overview
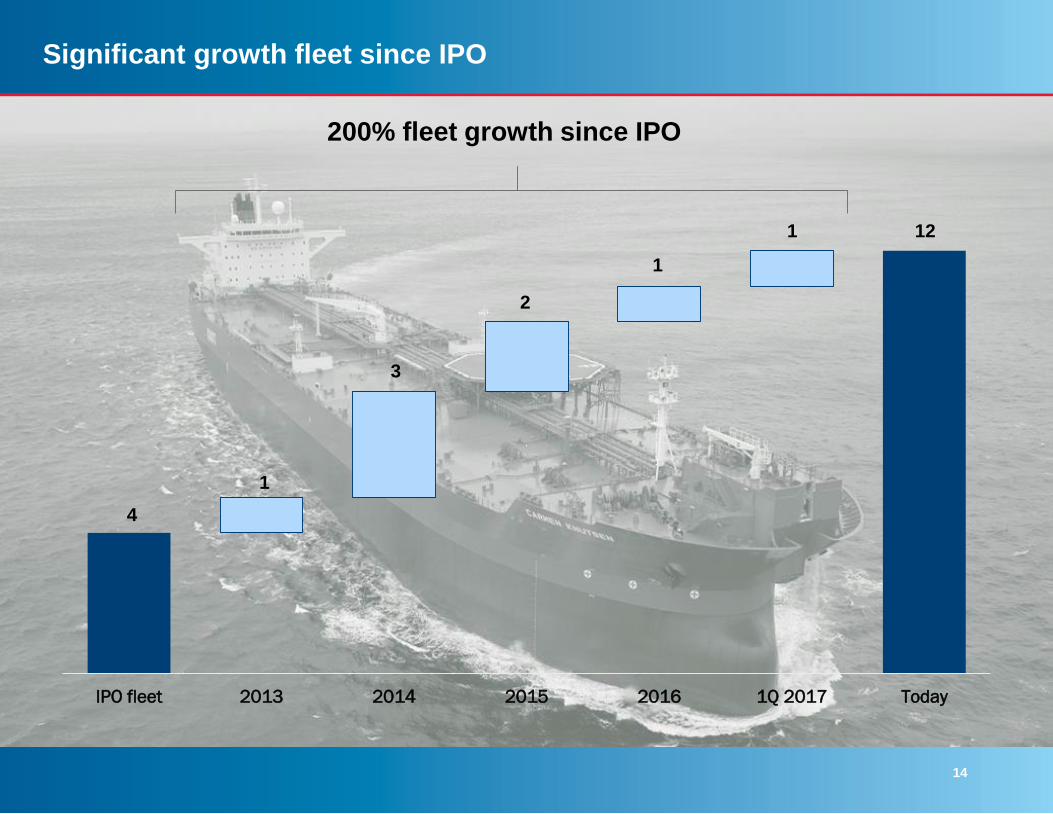
IPO April 2013, fleet of four vessels
Today a fleet of twelve state advanced
shuttle tankers i.e. 200% fleet growth
All vessels secured under long term
fixed-fee revenue contracts with leading
oil majors
Visible growth potential with three drop-
down candidates from Sponsor
Annual distribution currently $2.08,
yielding 9.2% with share price $22.65
Attractive 1099 structure, not K-1
(1) Clarkson Research Spring 2016
14
IPO fleet 2013 2014 2015 2016 1Q 2017 Today
Significant growth fleet since IPO
4
1
3
2
1
1 12
200% fleet growth since IPO
15
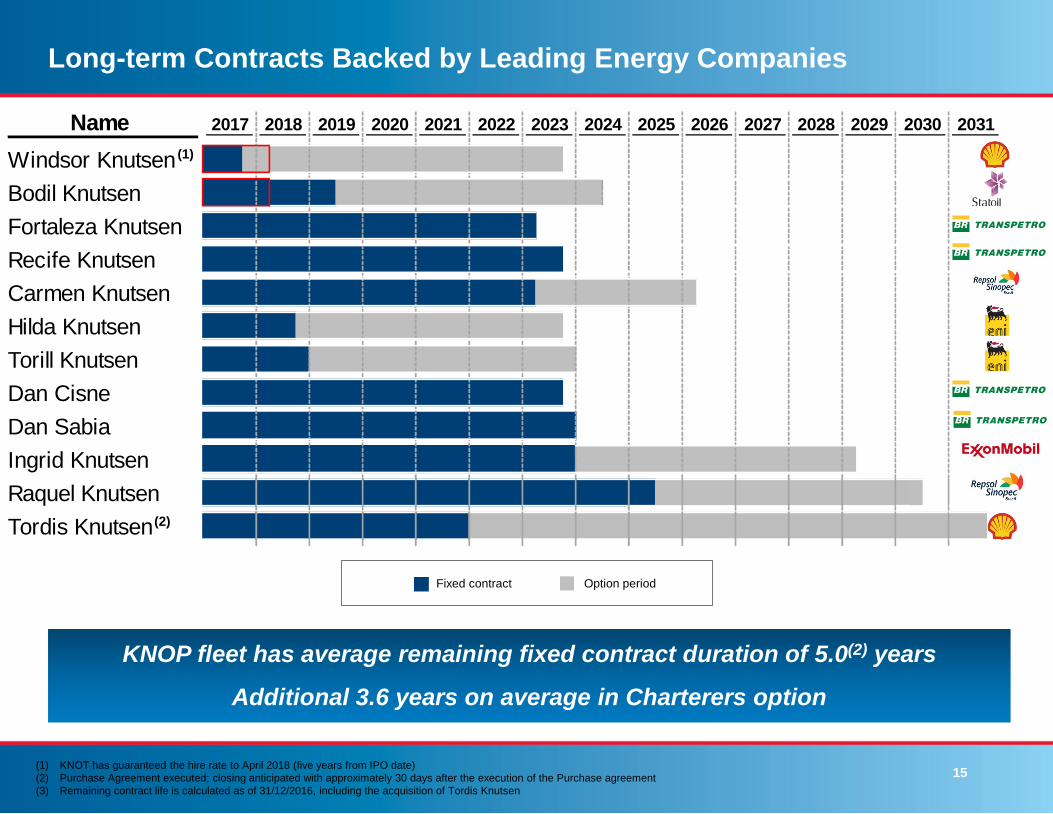
Name 2017 2018 2019 2020 2021 2022 2023 2024 2025 2026 2027 2028 2029 2030 2031
Windsor Knutsen
Bodil Knutsen
Fortaleza Knutsen
Recife Knutsen
Carmen Knutsen
Hilda Knutsen
Torill Knutsen
Dan Cisne
Dan Sabia
Ingrid Knutsen
Raquel Knutsen
Tordis Knutsen
Long-term Contracts Backed by Leading Energy Companies
KNOP fleet has average remaining fixed contract duration of 5.0(2) years
Additional 3.6 years on average in Charterers option
(1)
(2)
Fixed contract Option period
(1) KNOT has guaranteed the hire rate to April 2018 (five years from IPO date)
(2) Purchase Agreement executed; closing anticipated with approximately 30 days after the execution of the Purchase agreement
(3) Remaining contract life is calculated as of 31/12/2016, including the acquisition of Tordis Knutsen
16
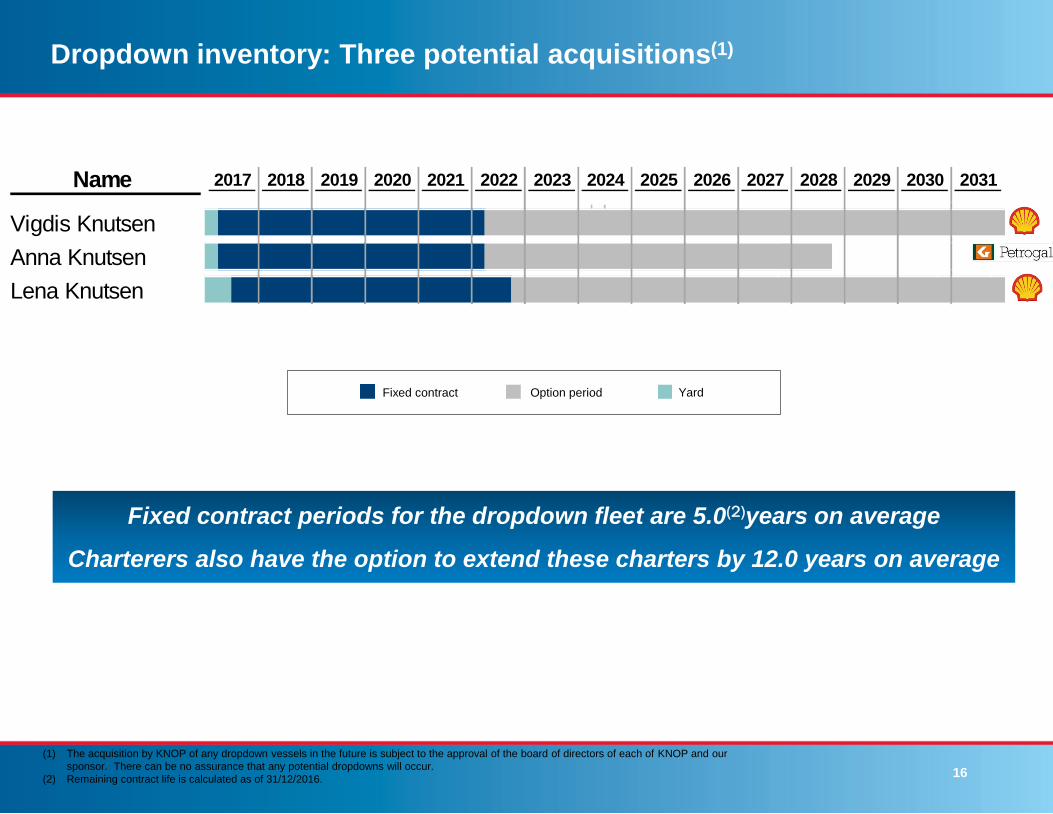
Dropdown inventory: Three potential acquisitions(1)
Fixed contract periods for the dropdown fleet are 5.0(2)years on average
Charterers also have the option to extend these charters by 12.0 years on average
(1) The acquisition by KNOP of any dropdown vessels in the future is subject to the approval of the board of directors of each of KNOP and our
sponsor. There can be no assurance that any potential dropdowns will occur.
(2) Remaining contract life is calculated as of 31/12/2016.
Fixed contract Option period Yard
Name 2017 2018 2019 2020 2021 2022 2023 2024 2025 2026 2027 2028 2029 2030 2031
Vigdis Knutsen
Anna Knutsen
Lena Knutsen
17
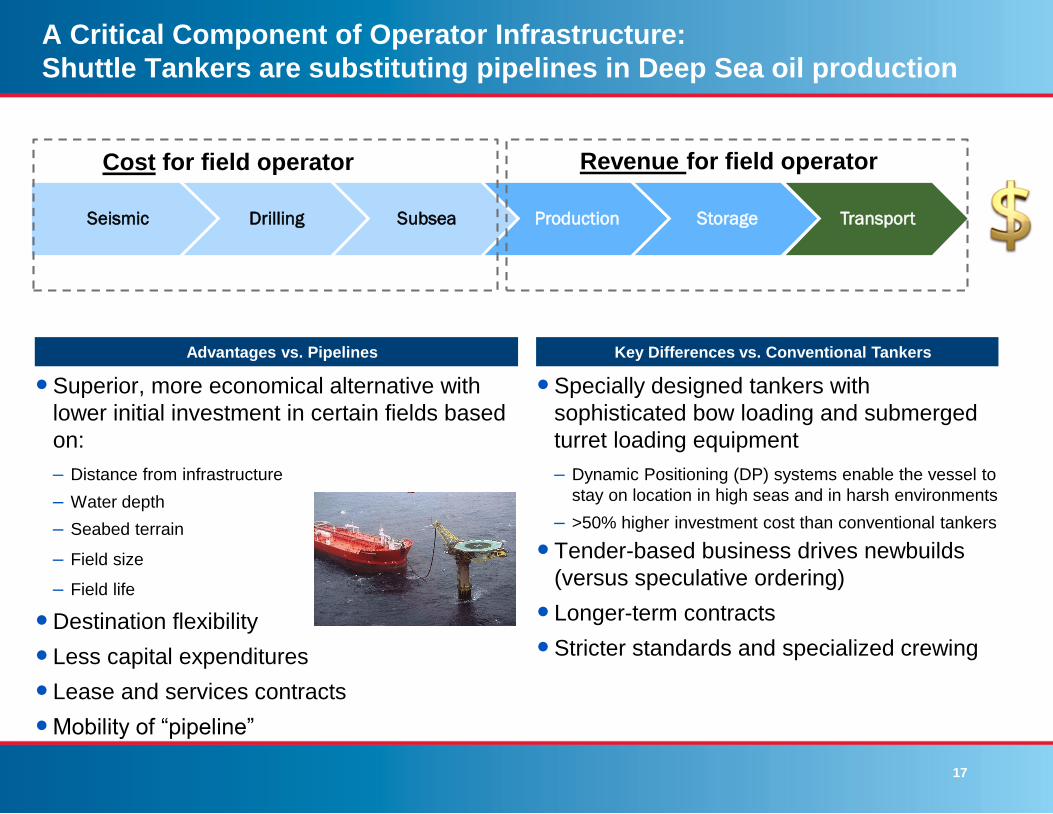
A Critical Component of Operator Infrastructure:
Shuttle Tankers are substituting pipelines in Deep Sea oil production
Superior, more economical alternative with
lower initial investment in certain fields based
on:
– Distance from infrastructure
– Water depth
– Seabed terrain
– Field size
– Field life
Destination flexibility
Less capital expenditures
Lease and services contracts
Mobility of “pipeline”
Specially designed tankers with
sophisticated bow loading and submerged
turret loading equipment
– Dynamic Positioning (DP) systems enable the vessel to
stay on location in high seas and in harsh environments
– >50% higher investment cost than conventional tankers
Tender-based business drives newbuilds
(versus speculative ordering)
Longer-term contracts
Stricter standards and specialized crewing
Advantages vs. Pipelines Key Differences vs. Conventional Tankers
Seismic Drilling Subsea Production Storage Transport
Cost for field operator Revenue for field operator
18
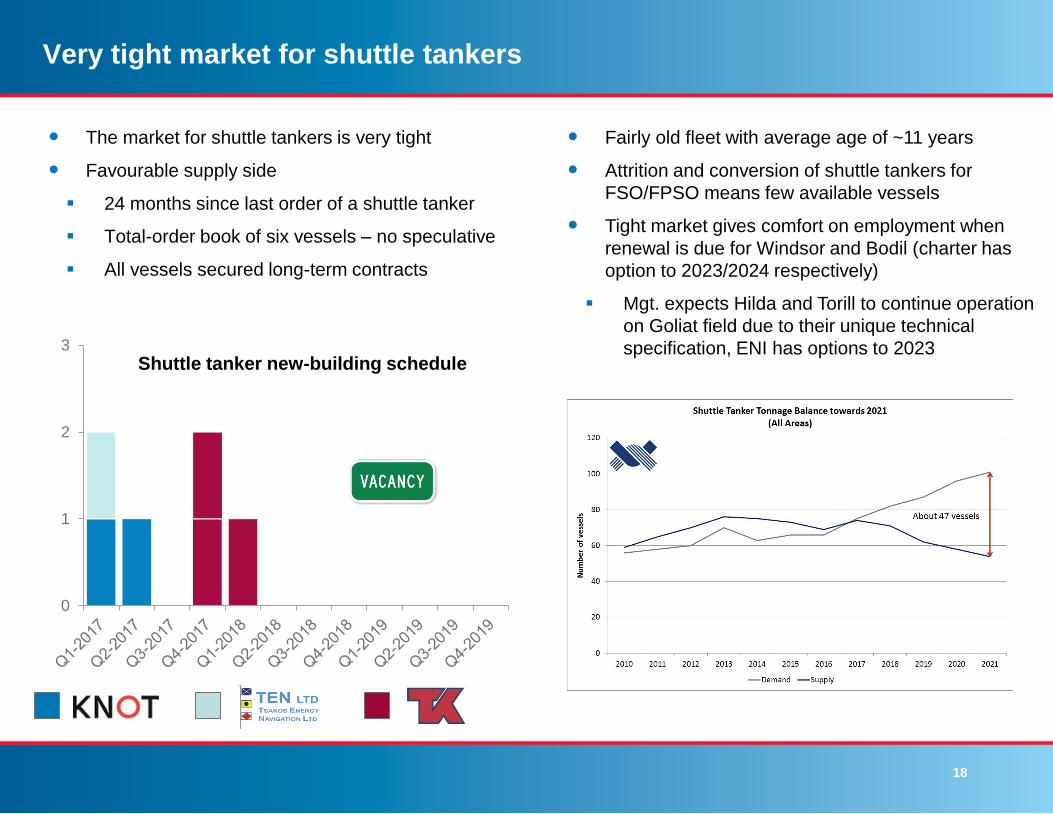
Very tight market for shuttle tankers
The market for shuttle tankers is very tight
Favourable supply side
24 months since last order of a shuttle tanker
Total-order book of six vessels – no speculative
All vessels secured long-term contracts
0
1
2
3
Shuttle tanker new-building schedule
Fairly old fleet with average age of ~11 years
Attrition and conversion of shuttle tankers for
FSO/FPSO means few available vessels
Tight market gives comfort on employment when
renewal is due for Windsor and Bodil (charter has
option to 2023/2024 respectively)
Mgt. expects Hilda and Torill to continue operation
on Goliat field due to their unique technical
specification, ENI has options to 2023
19
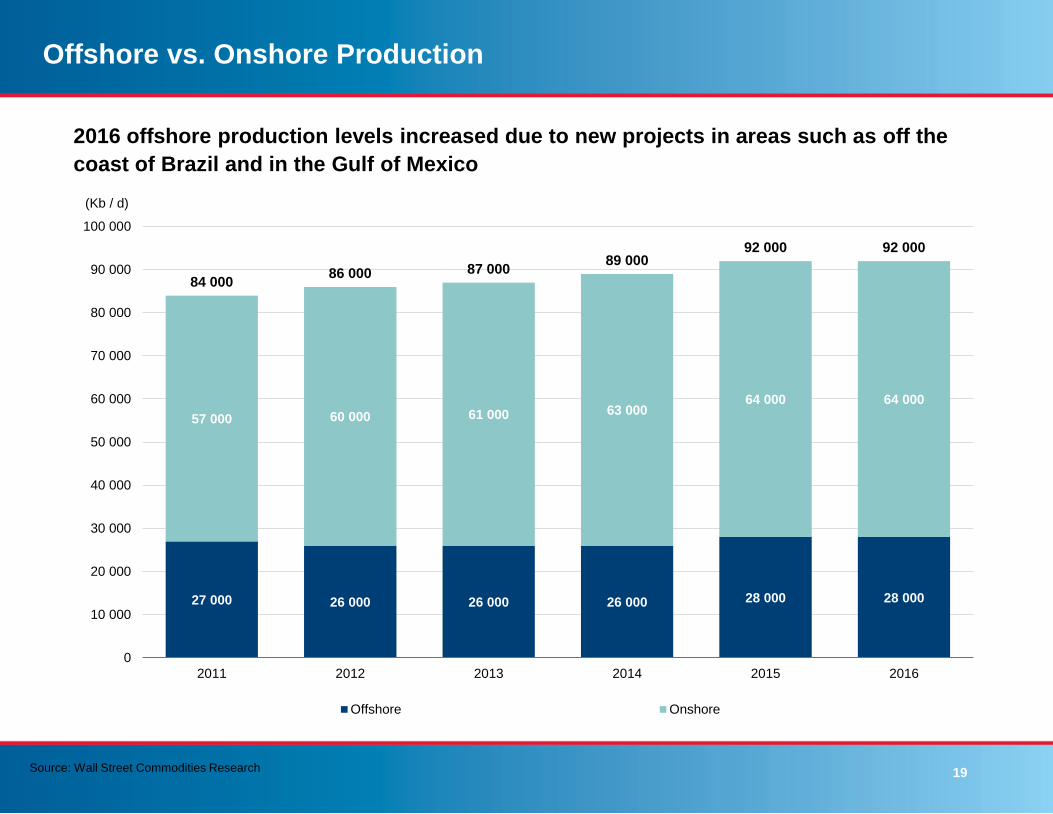
Offshore vs. Onshore Production
27 000 26 000 26 000 26 000 28 000 28 000
57 000 60 000 61 000 63 00064 000 64 000
84 00086 000 87 000
89 00092 000 92 000
0
10 000
20 000
30 000
40 000
50 000
60 000
70 000
80 000
90 000
100 000
2011 2012 2013 2014 2015 2016
(Kb / d)
Offshore Onshore
Source: Wall Street Commodities Research
2016 offshore production levels increased due to new projects in areas such as off the
coast of Brazil and in the Gulf of Mexico
20
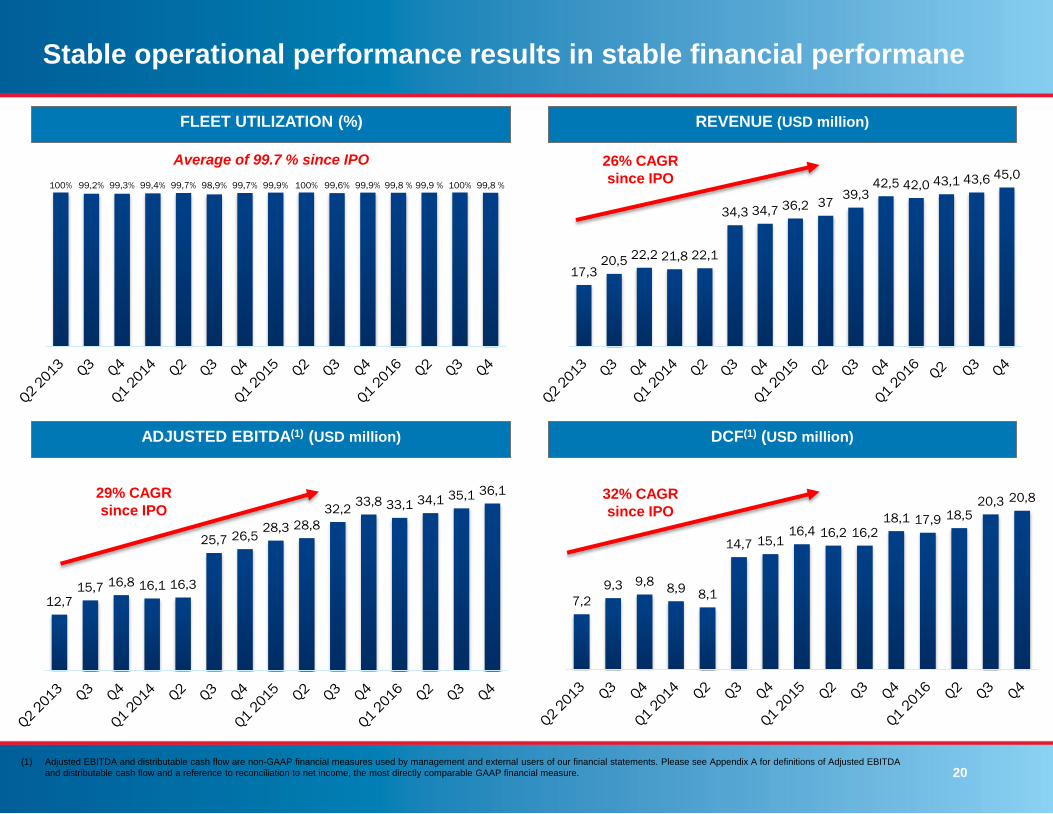
Stable operational performance results in stable financial performane
17,320,5
22,2 21,8 22,1
34,3 34,7 36,2 3739,3
42,5 42,0 43,1 43,6 45,0
REVENUE (USD million)
ADJUSTED EBITDA(1) (USD million)
100% 99,2% 99,3% 99,4% 99,7% 98,9% 99,7% 99,9% 100% 99,6% 99,9% 99,8 % 99,9 % 100% 99,8 %
FLEET UTILIZATION (%)
7,2
9,3 9,88,9
8,1
14,7 15,116,4 16,2 16,2
18,1 17,9 18,520,3 20,8
12,715,7 16,8 16,1 16,3
25,7 26,528,3 28,8
32,233,8 33,1 34,1 35,1 36,1
DCF(1) (USD million)
Average of 99.7 % since IPO 26% CAGR
since IPO
32% CAGR
since IPO
29% CAGR
since IPO
(1) Adjusted EBITDA and distributable cash flow are non-GAAP financial measures used by management and external users of our financial statements. Please see Appendix A for definitions of Adjusted EBITDA
and distributable cash flow and a reference to reconciliation to net income, the most directly comparable GAAP financial measure.
21
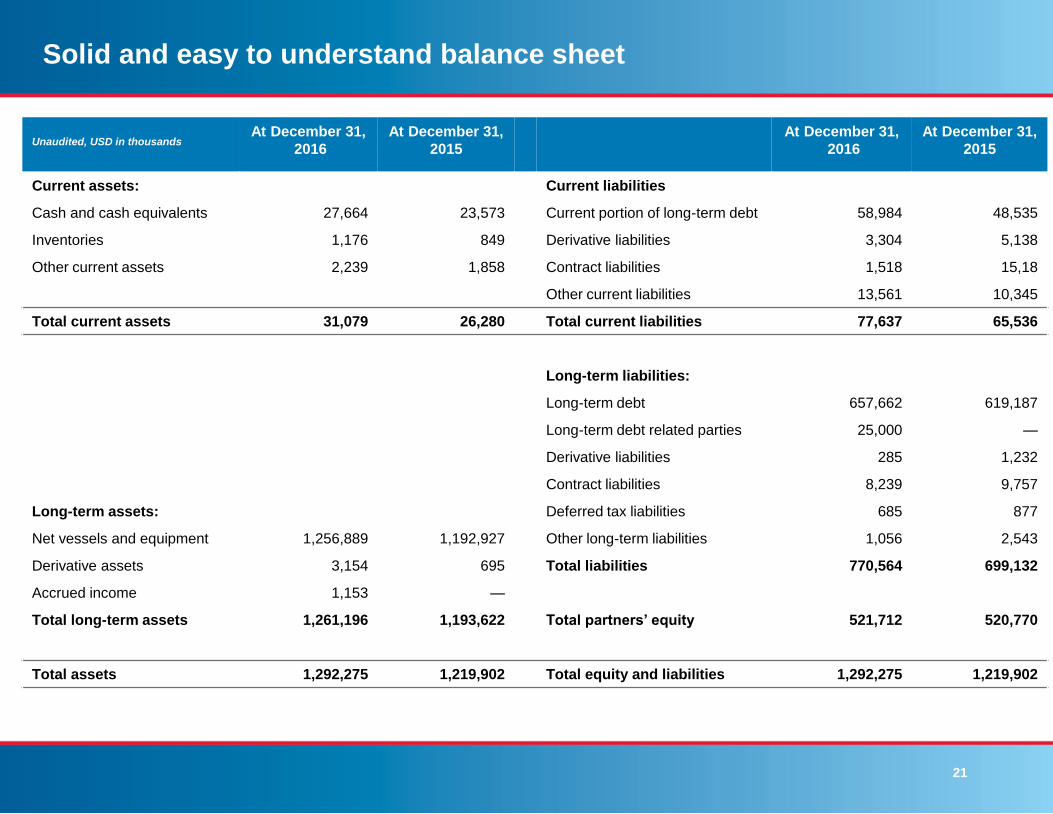
Solid and easy to understand balance sheet
Unaudited, USD in thousands At December 31,
2016
At December 31,
2015
At December 31,
2016
At December 31,
2015
Current assets: Current liabilities
Cash and cash equivalents 27,664 23,573 Current portion of long-term debt 58,984 48,535
Inventories 1,176 849 Derivative liabilities 3,304 5,138
Other current assets 2,239 1,858 Contract liabilities 1,518 15,18
Other current liabilities 13,561 10,345
Total current assets 31,079 26,280 Total current liabilities 77,637 65,536
Long-term liabilities:
Long-term debt 657,662 619,187
Long-term debt related parties 25,000 —
Derivative liabilities 285 1,232
Contract liabilities 8,239 9,757
Long-term assets: Deferred tax liabilities 685 877
Net vessels and equipment 1,256,889 1,192,927 Other long-term liabilities 1,056 2,543
Derivative assets 3,154 695 Total liabilities 770,564 699,132
Accrued income 1,153 —
Total long-term assets 1,261,196 1,193,622 Total partners’ equity 521,712 520,770
Total assets 1,292,275 1,219,902 Total equity and liabilities 1,292,275 1,219,902
13,008
22
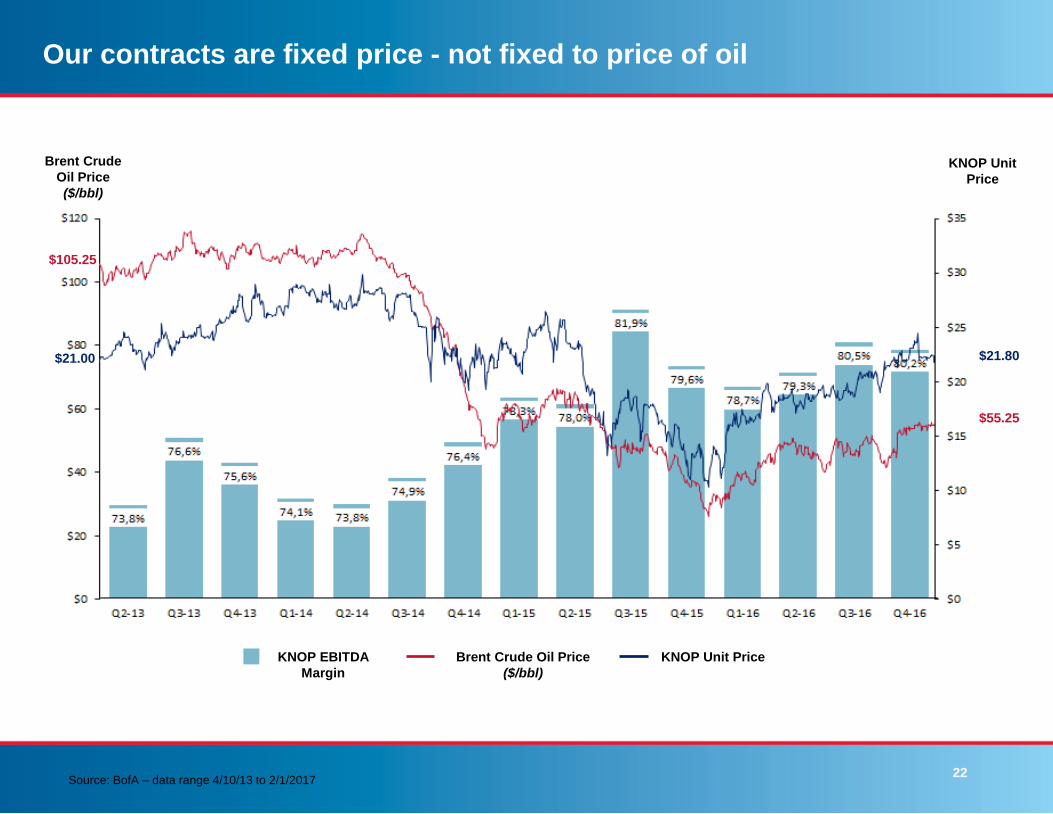
Our contracts are fixed price - not fixed to price of oil
Brent Crude
Oil Price
($/bbl)
KNOP Unit
Price
$105.25
$21.00 $21.80
$55.25
KNOP EBITDA
Margin
Brent Crude Oil Price
($/bbl)
KNOP Unit Price
Source: BofA – data range 4/10/13 to 2/1/2017
23
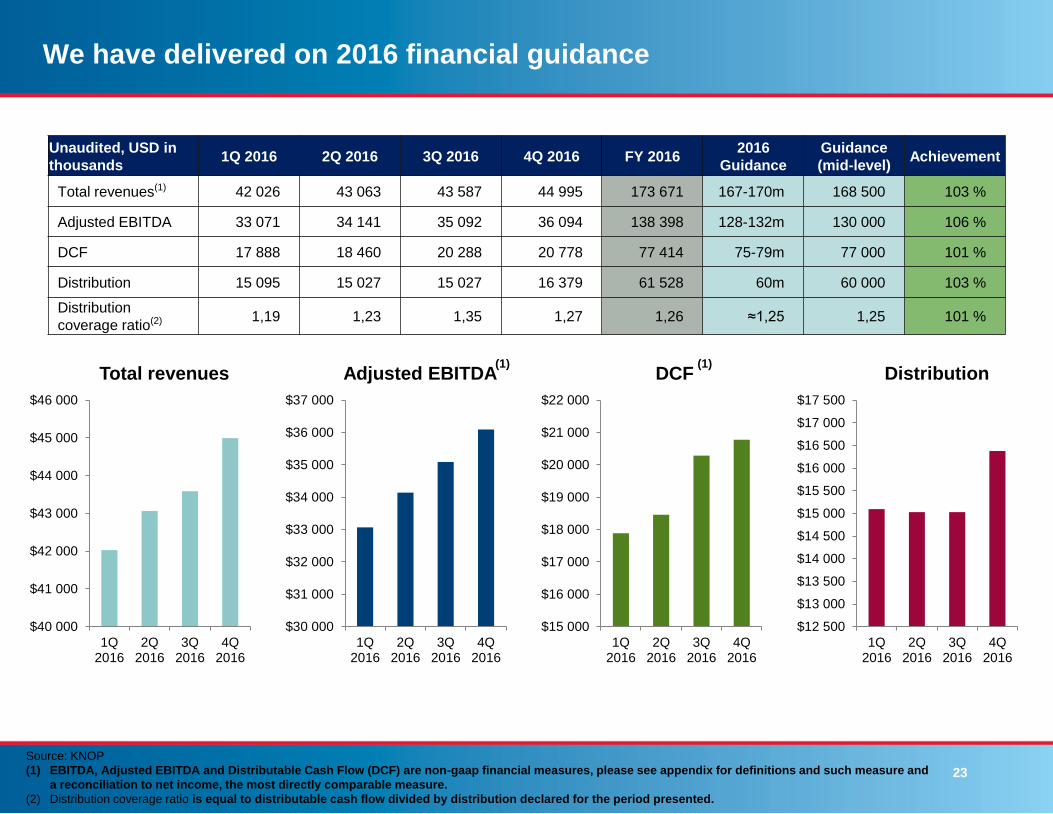
We have delivered on 2016 financial guidance
Unaudited, USD in
thousands 1Q 2016 2Q 2016 3Q 2016 4Q 2016 FY 2016
2016
Guidance
Guidance
(mid-level)Achievement
Total revenues(1) 42 026 43 063 43 587 44 995 173 671 167-170m 168 500 103 %
Adjusted EBITDA 33 071 34 141 35 092 36 094 138 398 128-132m 130 000 106 %
DCF 17 888 18 460 20 288 20 778 77 414 75-79m 77 000 101 %
Distribution 15 095 15 027 15 027 16 379 61 528 60m 60 000 103 %
Distribution
coverage ratio(2) 1,19 1,23 1,35 1,27 1,26 ≈1,25 1,25 101 %
$40 000
$41 000
$42 000
$43 000
$44 000
$45 000
$46 000
1Q2016
2Q2016
3Q2016
4Q2016
Total revenues
$30 000
$31 000
$32 000
$33 000
$34 000
$35 000
$36 000
$37 000
1Q2016
2Q2016
3Q2016
4Q2016
Adjusted EBITDA
$15 000
$16 000
$17 000
$18 000
$19 000
$20 000
$21 000
$22 000
1Q2016
2Q2016
3Q2016
4Q2016
DCF
$12 500
$13 000
$13 500
$14 000
$14 500
$15 000
$15 500
$16 000
$16 500
$17 000
$17 500
1Q2016
2Q2016
3Q2016
4Q2016
Distribution
Source: KNOP
(1) EBITDA, Adjusted EBITDA and Distributable Cash Flow (DCF) are non-gaap financial measures, please see appendix for definitions and such measure and
a reconciliation to net income, the most directly comparable measure.
(2) Distribution coverage ratio is equal to distributable cash flow divided by distribution declared for the period presented.
(1) (1)
24
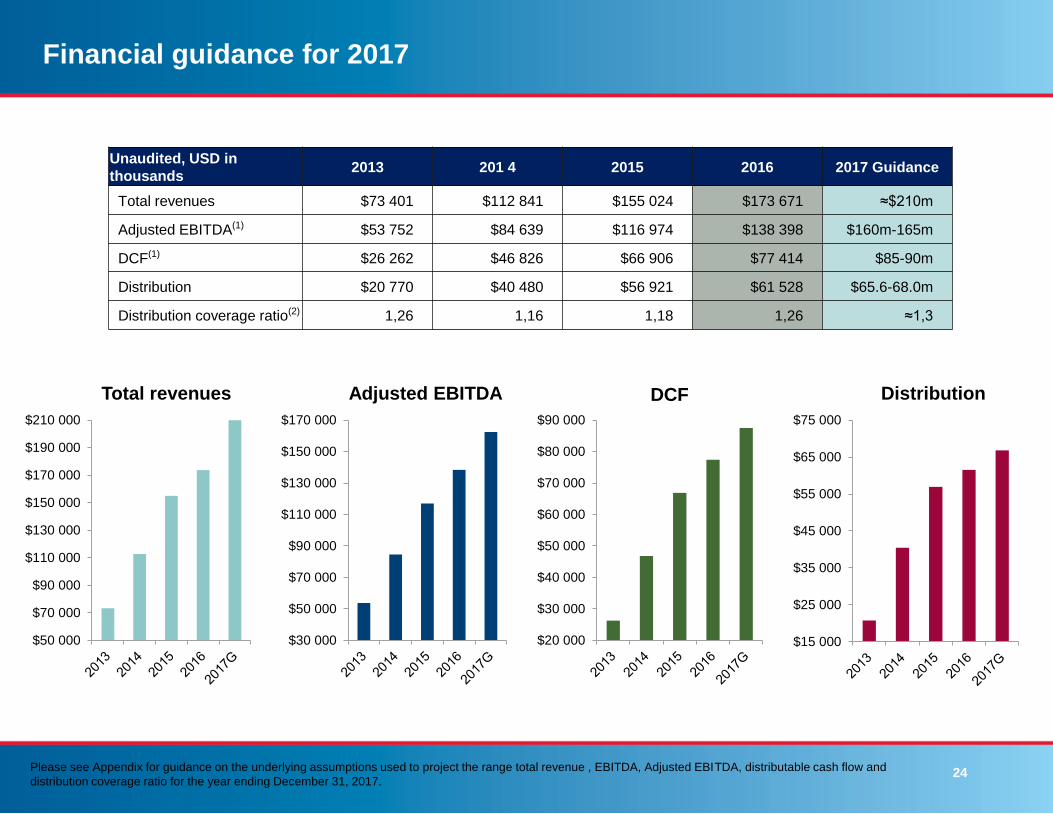
Financial guidance for 2017
Unaudited, USD in
thousands 2013 201 4 2015 2016 2017 Guidance
Total revenues $73 401 $112 841 $155 024 $173 671 ≈$210m
Adjusted EBITDA(1) $53 752 $84 639 $116 974 $138 398 $160m-165m
DCF(1) $26 262 $46 826 $66 906 $77 414 $85-90m
Distribution $20 770 $40 480 $56 921 $61 528 $65.6-68.0m
Distribution coverage ratio(2) 1,26 1,16 1,18 1,26 ≈1,3
$50 000
$70 000
$90 000
$110 000
$130 000
$150 000
$170 000
$190 000
$210 000
Total revenues
$30 000
$50 000
$70 000
$90 000
$110 000
$130 000
$150 000
$170 000
Adjusted EBITDA
$20 000
$30 000
$40 000
$50 000
$60 000
$70 000
$80 000
$90 000
DCF
$15 000
$25 000
$35 000
$45 000
$55 000
$65 000
$75 000
Distribution
Please see Appendix for guidance on the underlying assumptions used to project the range total revenue , EBITDA, Adjusted EBITDA, distributable cash flow and
distribution coverage ratio for the year ending December 31, 2017.
25
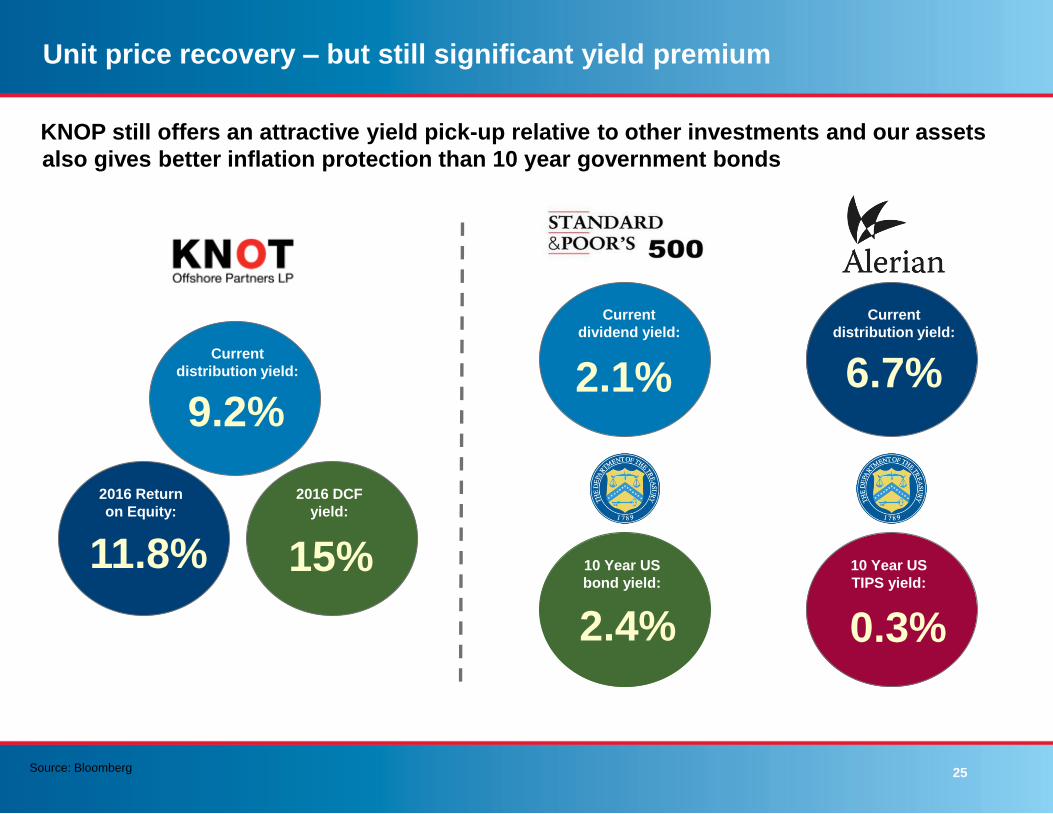
Unit price recovery – but still significant yield premium
KNOP still offers an attractive yield pick-up relative to other investments and our assets
also gives better inflation protection than 10 year government bonds
Current
distribution yield:
9.2%
Current
distribution yield:
6.7%
2016 Return
on Equity:
11.8%
2016 DCF
yield:
15%
Current
dividend yield:
2.1%
10 Year US
TIPS yield:
10 Year US
bond yield:
2.4% 0.3%
Source: Bloomberg
26
Summary
Strong operational and financial
performance where we beat financial
guidance on all five measures for 2016
Attractive yield of 9.2% with annualized
distribution of $2.08 per unit
Successfully raised approx. $105m of new
equity with 2.5m common units offering
and a private placement of Series A
Convertible Preferred units
Growth is back with drop-down in both Q4-
2016 and Q1-2017, with intention of
additional drop-down in Q2-2017
With tight market and tenders back
Sponsor expects to build further drop-down
inventory
(1) Adjusted EBITDA and distributable cash flow are non-GAAP financial measures used by management and external users of our financial statements. Please see Appendix A for definitions of
Adjusted EBITDA and distributable cash flow and a reference to reconciliation to net income, the most directly comparable GAAP financial measure.
(2) Quarterly distribution annualized / unit price $21.40 per 13 February, 2017
Appendix
APPENDIX
28
Non-GAAP Financial Measures
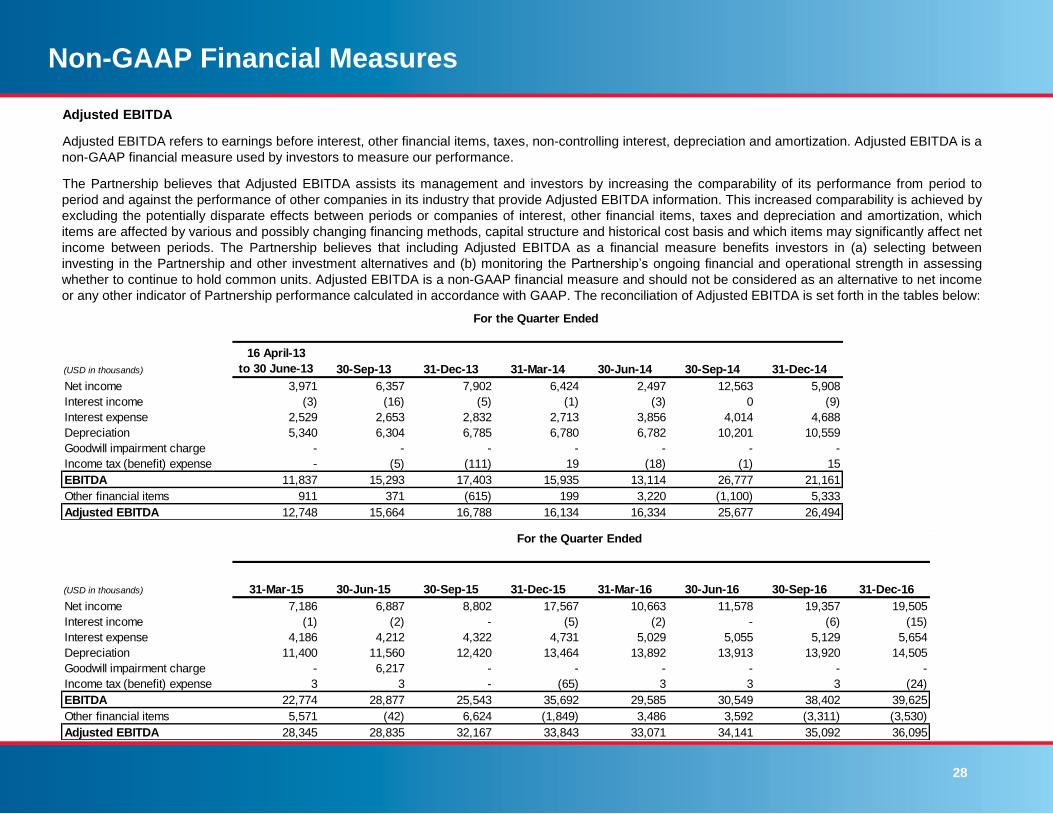
Adjusted EBITDA
Adjusted EBITDA refers to earnings before interest, other financial items, taxes, non-controlling interest, depreciation and amortization. Adjusted EBITDA is a
non-GAAP financial measure used by investors to measure our performance.
The Partnership believes that Adjusted EBITDA assists its management and investors by increasing the comparability of its performance from period to
period and against the performance of other companies in its industry that provide Adjusted EBITDA information. This increased comparability is achieved by
excluding the potentially disparate effects between periods or companies of interest, other financial items, taxes and depreciation and amortization, which
items are affected by various and possibly changing financing methods, capital structure and historical cost basis and which items may significantly affect net
income between periods. The Partnership believes that including Adjusted EBITDA as a financial measure benefits investors in (a) selecting between
investing in the Partnership and other investment alternatives and (b) monitoring the Partnership’s ongoing financial and operational strength in assessing
whether to continue to hold common units. Adjusted EBITDA is a non-GAAP financial measure and should not be considered as an alternative to net income
or any other indicator of Partnership performance calculated in accordance with GAAP. The reconciliation of Adjusted EBITDA is set forth in the tables below:
(USD in thousands)
16 April-13
to 30 June-13 30-Sep-13 31-Dec-13 31-Mar-14 30-Jun-14 30-Sep-14 31-Dec-14
Net income 3,971 6,357 7,902 6,424 2,497 12,563 5,908
Interest income (3) (16) (5) (1) (3) 0 (9)
Interest expense 2,529 2,653 2,832 2,713 3,856 4,014 4,688
Depreciation 5,340 6,304 6,785 6,780 6,782 10,201 10,559
Goodwill impairment charge - - - - - - -
Income tax (benefit) expense - (5) (111) 19 (18) (1) 15
EBITDA 11,837 15,293 17,403 15,935 13,114 26,777 21,161
Other financial items 911 371 (615) 199 3,220 (1,100) 5,333
Adjusted EBITDA 12,748 15,664 16,788 16,134 16,334 25,677 26,494
For the Quarter Ended
(USD in thousands) 31-Mar-15 30-Jun-15 30-Sep-15 31-Dec-15 31-Mar-16 30-Jun-16 30-Sep-16 31-Dec-16
Net income 7,186 6,887 8,802 17,567 10,663 11,578 19,357 19,505
Interest income (1) (2) - (5) (2) - (6) (15)
Interest expense 4,186 4,212 4,322 4,731 5,029 5,055 5,129 5,654
Depreciation 11,400 11,560 12,420 13,464 13,892 13,913 13,920 14,505
Goodwill impairment charge - 6,217 - - - - - -
Income tax (benefit) expense 3 3 - (65) 3 3 3 (24)
EBITDA 22,774 28,877 25,543 35,692 29,585 30,549 38,402 39,625
Other financial items 5,571 (42) 6,624 (1,849) 3,486 3,592 (3,311) (3,530)
Adjusted EBITDA 28,345 28,835 32,167 33,843 33,071 34,141 35,092 36,095
For the Quarter Ended
29
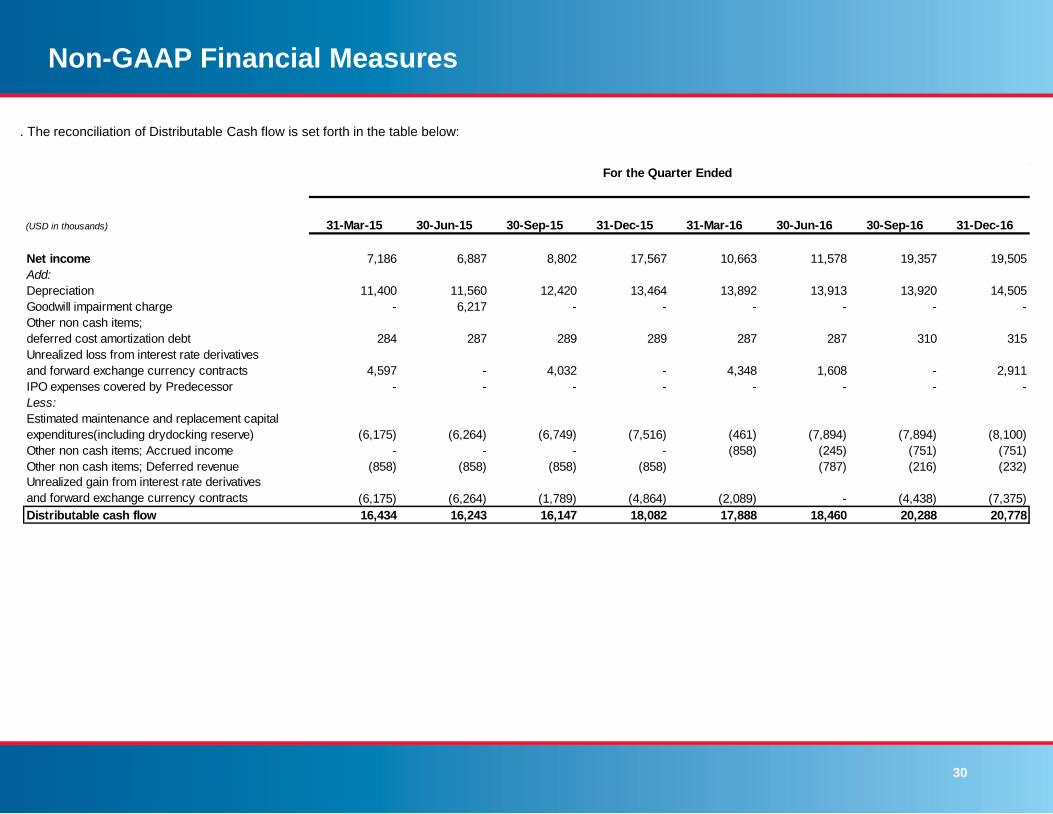
Non-GAAP Financial Measures
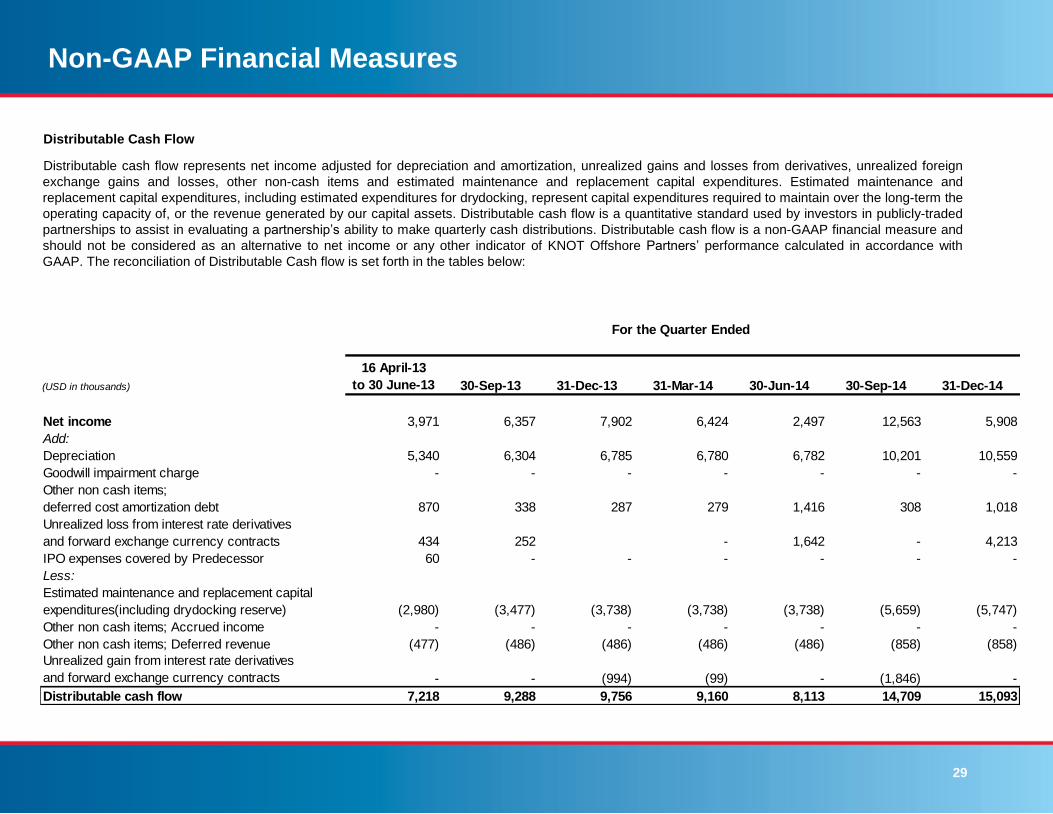
Distributable Cash Flow
Distributable cash flow represents net income adjusted for depreciation and amortization, unrealized gains and losses from derivatives, unrealized foreign
exchange gains and losses, other non-cash items and estimated maintenance and replacement capital expenditures. Estimated maintenance and
replacement capital expenditures, including estimated expenditures for drydocking, represent capital expenditures required to maintain over the long-term the
operating capacity of, or the revenue generated by our capital assets. Distributable cash flow is a quantitative standard used by investors in publicly-traded
partnerships to assist in evaluating a partnership’s ability to make quarterly cash distributions. Distributable cash flow is a non-GAAP financial measure and
should not be considered as an alternative to net income or any other indicator of KNOT Offshore Partners’ performance calculated in accordance with
GAAP. The reconciliation of Distributable Cash flow is set forth in the tables below:
(USD in thousands)
16 April-13
to 30 June-13 30-Sep-13 31-Dec-13 31-Mar-14 30-Jun-14 30-Sep-14 31-Dec-14
Net income 3,971 6,357 7,902 6,424 2,497 12,563 5,908
Add:
Depreciation 5,340 6,304 6,785 6,780 6,782 10,201 10,559
Goodwill impairment charge - - - - - - -
Other non cash items;
deferred cost amortization debt 870 338 287 279 1,416 308 1,018
Unrealized loss from interest rate derivatives
and forward exchange currency contracts 434 252 - 1,642 - 4,213
IPO expenses covered by Predecessor 60 - - - - - -
Less:
Estimated maintenance and replacement capital
expenditures(including drydocking reserve) (2,980) (3,477) (3,738) (3,738) (3,738) (5,659) (5,747)
Other non cash items; Accrued income - - - - - - -
Other non cash items; Deferred revenue (477) (486) (486) (486) (486) (858) (858)
Unrealized gain from interest rate derivatives
and forward exchange currency contracts - - (994) (99) - (1,846) -
Distributable cash flow 7,218 9,288 9,756 9,160 8,113 14,709 15,093
For the Quarter Ended
30
Non-GAAP Financial Measures
(USD in thousands) 31-Mar-15 30-Jun-15 30-Sep-15 31-Dec-15 31-Mar-16 30-Jun-16 30-Sep-16 31-Dec-16
Net income 7,186 6,887 8,802 17,567 10,663 11,578 19,357 19,505
Add:
Depreciation 11,400 11,560 12,420 13,464 13,892 13,913 13,920 14,505
Goodwill impairment charge - 6,217 - - - - - -
Other non cash items;
deferred cost amortization debt 284 287 289 289 287 287 310 315
Unrealized loss from interest rate derivatives
and forward exchange currency contracts 4,597 - 4,032 - 4,348 1,608 - 2,911
IPO expenses covered by Predecessor - - - - - - - -
Less:
Estimated maintenance and replacement capital
expenditures(including drydocking reserve) (6,175) (6,264) (6,749) (7,516) (461) (7,894) (7,894) (8,100)
Other non cash items; Accrued income - - - - (858) (245) (751) (751)
Other non cash items; Deferred revenue (858) (858) (858) (858) (787) (216) (232)
Unrealized gain from interest rate derivatives
and forward exchange currency contracts (6,175) (6,264) (1,789) (4,864) (2,089) - (4,438) (7,375)
Distributable cash flow 16,434 16,243 16,147 18,082 17,888 18,460 20,288 20,778
For the Quarter Ended
. The reconciliation of Distributable Cash flow is set forth in the table below:
31
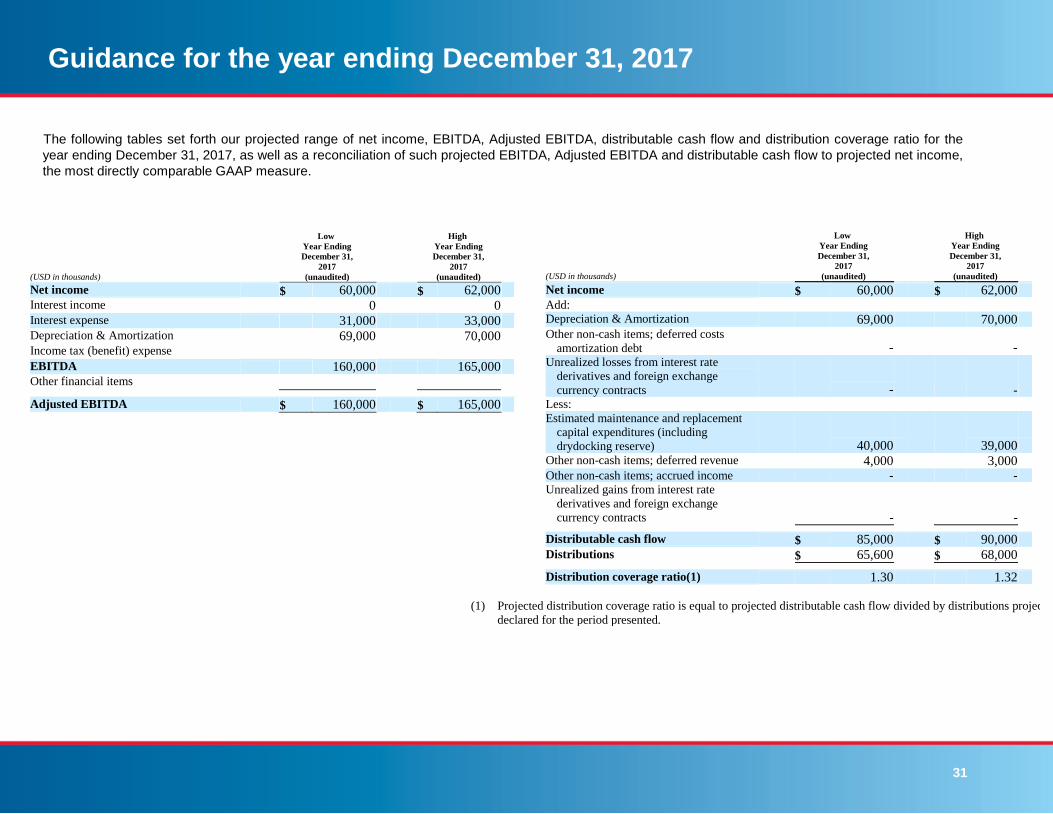
Guidance for the year ending December 31, 2017
The following tables set forth our projected range of net income, EBITDA, Adjusted EBITDA, distributable cash flow and distribution coverage ratio for the
year ending December 31, 2017, as well as a reconciliation of such projected EBITDA, Adjusted EBITDA and distributable cash flow to projected net income,
the most directly comparable GAAP measure.
(USD in thousands)
Low
Year Ending
December 31,
2017
(unaudited)
High
Year Ending
December 31,
2017
(unaudited) Net income $ 60,000 $ 62,000 Interest income 0 0 Interest expense 31,000 33,000 Depreciation & Amortization 69,000 70,000 Income tax (benefit) expense EBITDA 160,000 165,000 Other financial items Adjusted EBITDA $ 160,000 $ 165,000
(USD in thousands)
Low
Year Ending
December 31,
2017
(unaudited)
High
Year Ending
December 31,
2017
(unaudited) Net income $ 60,000 $ 62,000 Add: Depreciation & Amortization 69,000 70,000 Other non-cash items; deferred costs
amortization debt - - Unrealized losses from interest rate
derivatives and foreign exchange
currency contracts - - Less: Estimated maintenance and replacement
capital expenditures (including
drydocking reserve) 40,000 39,000 Other non-cash items; deferred revenue 4,000 3,000 Other non-cash items; accrued income - -
Unrealized gains from interest rate
derivatives and foreign exchange
currency contracts - - Distributable cash flow $ 85,000 $ 90,000 Distributions $ 65,600 $ 68,000 Distribution coverage ratio(1) 1.30 1.32
(1) Projected distribution coverage ratio is equal to projected distributable cash flow divided by distributions projected to be
declared for the period presented.
32
Guidance for the year ending December 31, 2017
The projected amounts set forth in the tables above exclude the impact of any acquisitions other than the Acquisition and are based on the following
assumptions:
closing of the Acquisition on March 1, 2017;
no dispositions of vessels;
no impairment expense;
timely receipt of charter hire specified in the time charter and bareboat charter contracts;
no unscheduled off-hire;
no realized or unrealized gains or losses on derivative instruments;
no additional equity issuances;
vessel operating costs according to current internal estimates; and
general and administrative expenses based on management’s current internal estimates.
We consider the above assumptions to be reasonable as of the date of this press release, but if these assumptions prove to be incorrect, actual net income,
EBITDA, Adjusted EBITDA, distributable cash flow and distribution coverage ratio could differ materially from our guidance. Neither our independent auditors nor
any other independent accountants have compiled, examined, or performed any procedures with respect to the prospective financial information contained
herein, nor have they expressed any opinion or any other form of assurance on such information or its achievability and assume no responsibility for, and
disclaim any association with, such prospective financial information.