Embed Size (px)
Citation preview

New Relic Analyst and Investor DayNovember 16, 2016

Welcome!Path to $1Bn. Revenue Run-Rate
Jon ParkerSr. Director, Strategic Finance and Investor Relations

This presentation and the information contained herein (including any information that may be incorporated by reference) is provided for informational purposes only and should not be construed as an offer, commitment, promise or obligation on behalf of New Relic, Inc. (“New Relic”) to sell securities or deliver any product, material, code, functionality or other feature. Any information provided hereby is proprietary to New Relic and may not be replicated or disclosed without New Relic’s express written permission. Such information may contain forward-looking statements within the meaning of federal securities laws. Any statement that is not a historical fact or refers to expectations, projections, future plans, objectives, estimates, goals, or other characterizations of future events is a forward-looking statement. These forward-looking statements can often be identified as such because the context of the statement will include words such as “believes,” “anticipates,” “expects” or words of similar import. Forward-looking statements contained in this presentation include, but are not limited to, statements concerning New Relic's future financial performance, growth prospects, ability to attract and retain customers, ability to execute on its sales and product strategies, product and feature releases and related benefits, and ability to successfully expand in its existing markets and into new markets. Actual results may differ materially from those expressed in these forward-looking statements, which speak only as of the date hereof, and are subject to change at any time without notice. Existing and prospective investors, customers and other third parties transacting business with New Relic are cautioned not to place undue reliance on this forward-looking information. The achievement or success of the matters covered by such forward-looking statements are based on New Relic’s current assumptions, expectations and beliefs and are subject to substantial risks, uncertainties, assumptions and changes in circumstances that may cause the actual results, performance or achievements to differ materially from those expressed or implied in any forward-looking statement. Further information on factors that could affect such forward-looking statements is included in the filings New Relic makes with the SEC from time to time. Copies of these documents may be obtained by visiting New Relic’s Investor Relations website at http://ir.newrelic.com or the SEC’s website at www.sec.gov. New Relic assumes no obligation and does not intend to update these forward-looking statements, except as required by law. New Relic makes no warranties, expressed or implied, in this presentation or otherwise, with respect to the information provided.
New Relic's fiscal year ends March 31. This presentation includes certain non-GAAP financial measures as defined by the SEC rules. These non-GAAP financial measures are in addition to, and not as a substitute for or superior to, measures of financial performance prepared in accordance with GAAP. There are a number of limitations related to the use of these non-GAAP financial measures versus their nearest GAAP equivalents. For example, other companies may calculate non-GAAP financial measures differently or may use other measures to evaluate their performance, all of which could reduce the usefulness of New Relic's non-GAAP financial measures as tools for comparison. As required by Regulation G, New Relic has provided a reconciliation of those measures to the most directly comparable GAAP measures, which is available in the appendix.
Safe Harbor

Agenda
1:10pm Lew Cirne, Founder and CEO - New Relic Strategy and Vision
1:45pm Jim Gochee, Chief Product Officer - Product Strategy
2:15pm BREAK
2:25pm Hilarie Koplow-McAdams, President – Go-to-Market Strategy
3:05pm Customer Panel
3:45pm Mark Sachleben, Chief Financial Officer – Financial Strategy

New Relic Strategy and VisionLew CirneFounder and CEO

Five Years to 4X
$250M $1BRun-Rate Exiting
Q217Run-Rate Exiting
FY22

“At least 80% of enterprises will implement multi-cloud
strategies over the next several years”
– IDC
CEO’s expecting their digital revenue to increase
by >80% by 2020 - Gartner
“By the end of 2018, at least half of IT Spending will be
cloud-based” – IDC
Major Market Forces Driving Confidence in our Opportunity

50%US sales from Digital in 2015
75%Customer interactions
with Capital One are digital
10MStream sessions
per day
Digital Experience is Now Brand Experience

The Age of the Digital Business


FRIDAYBLACK
247 MILLION SHOPPERS

SERIESWORLD
2,430 regular season games

NOT EASY


New technology and dynamic infrastructure
Everything is changing
New processes and faster velocity
New business modelsand revenue streams

ExecutivesQuality AssuranceDevelopers Customer care Project ManagerIT Operations

ExecutivesQuality Assurance
Developers Customer care
Project ManagerIT Operations

IT Operations
Digital is a team sport
ExecutivesQuality Assurance
Developers Customer care
Project ManagerIT Operations

The first, best place to look to understand your digital business
ExecutivesQuality AssuranceDevelopers Customer care Project ManagerIT Operations

New Relic’s Solution
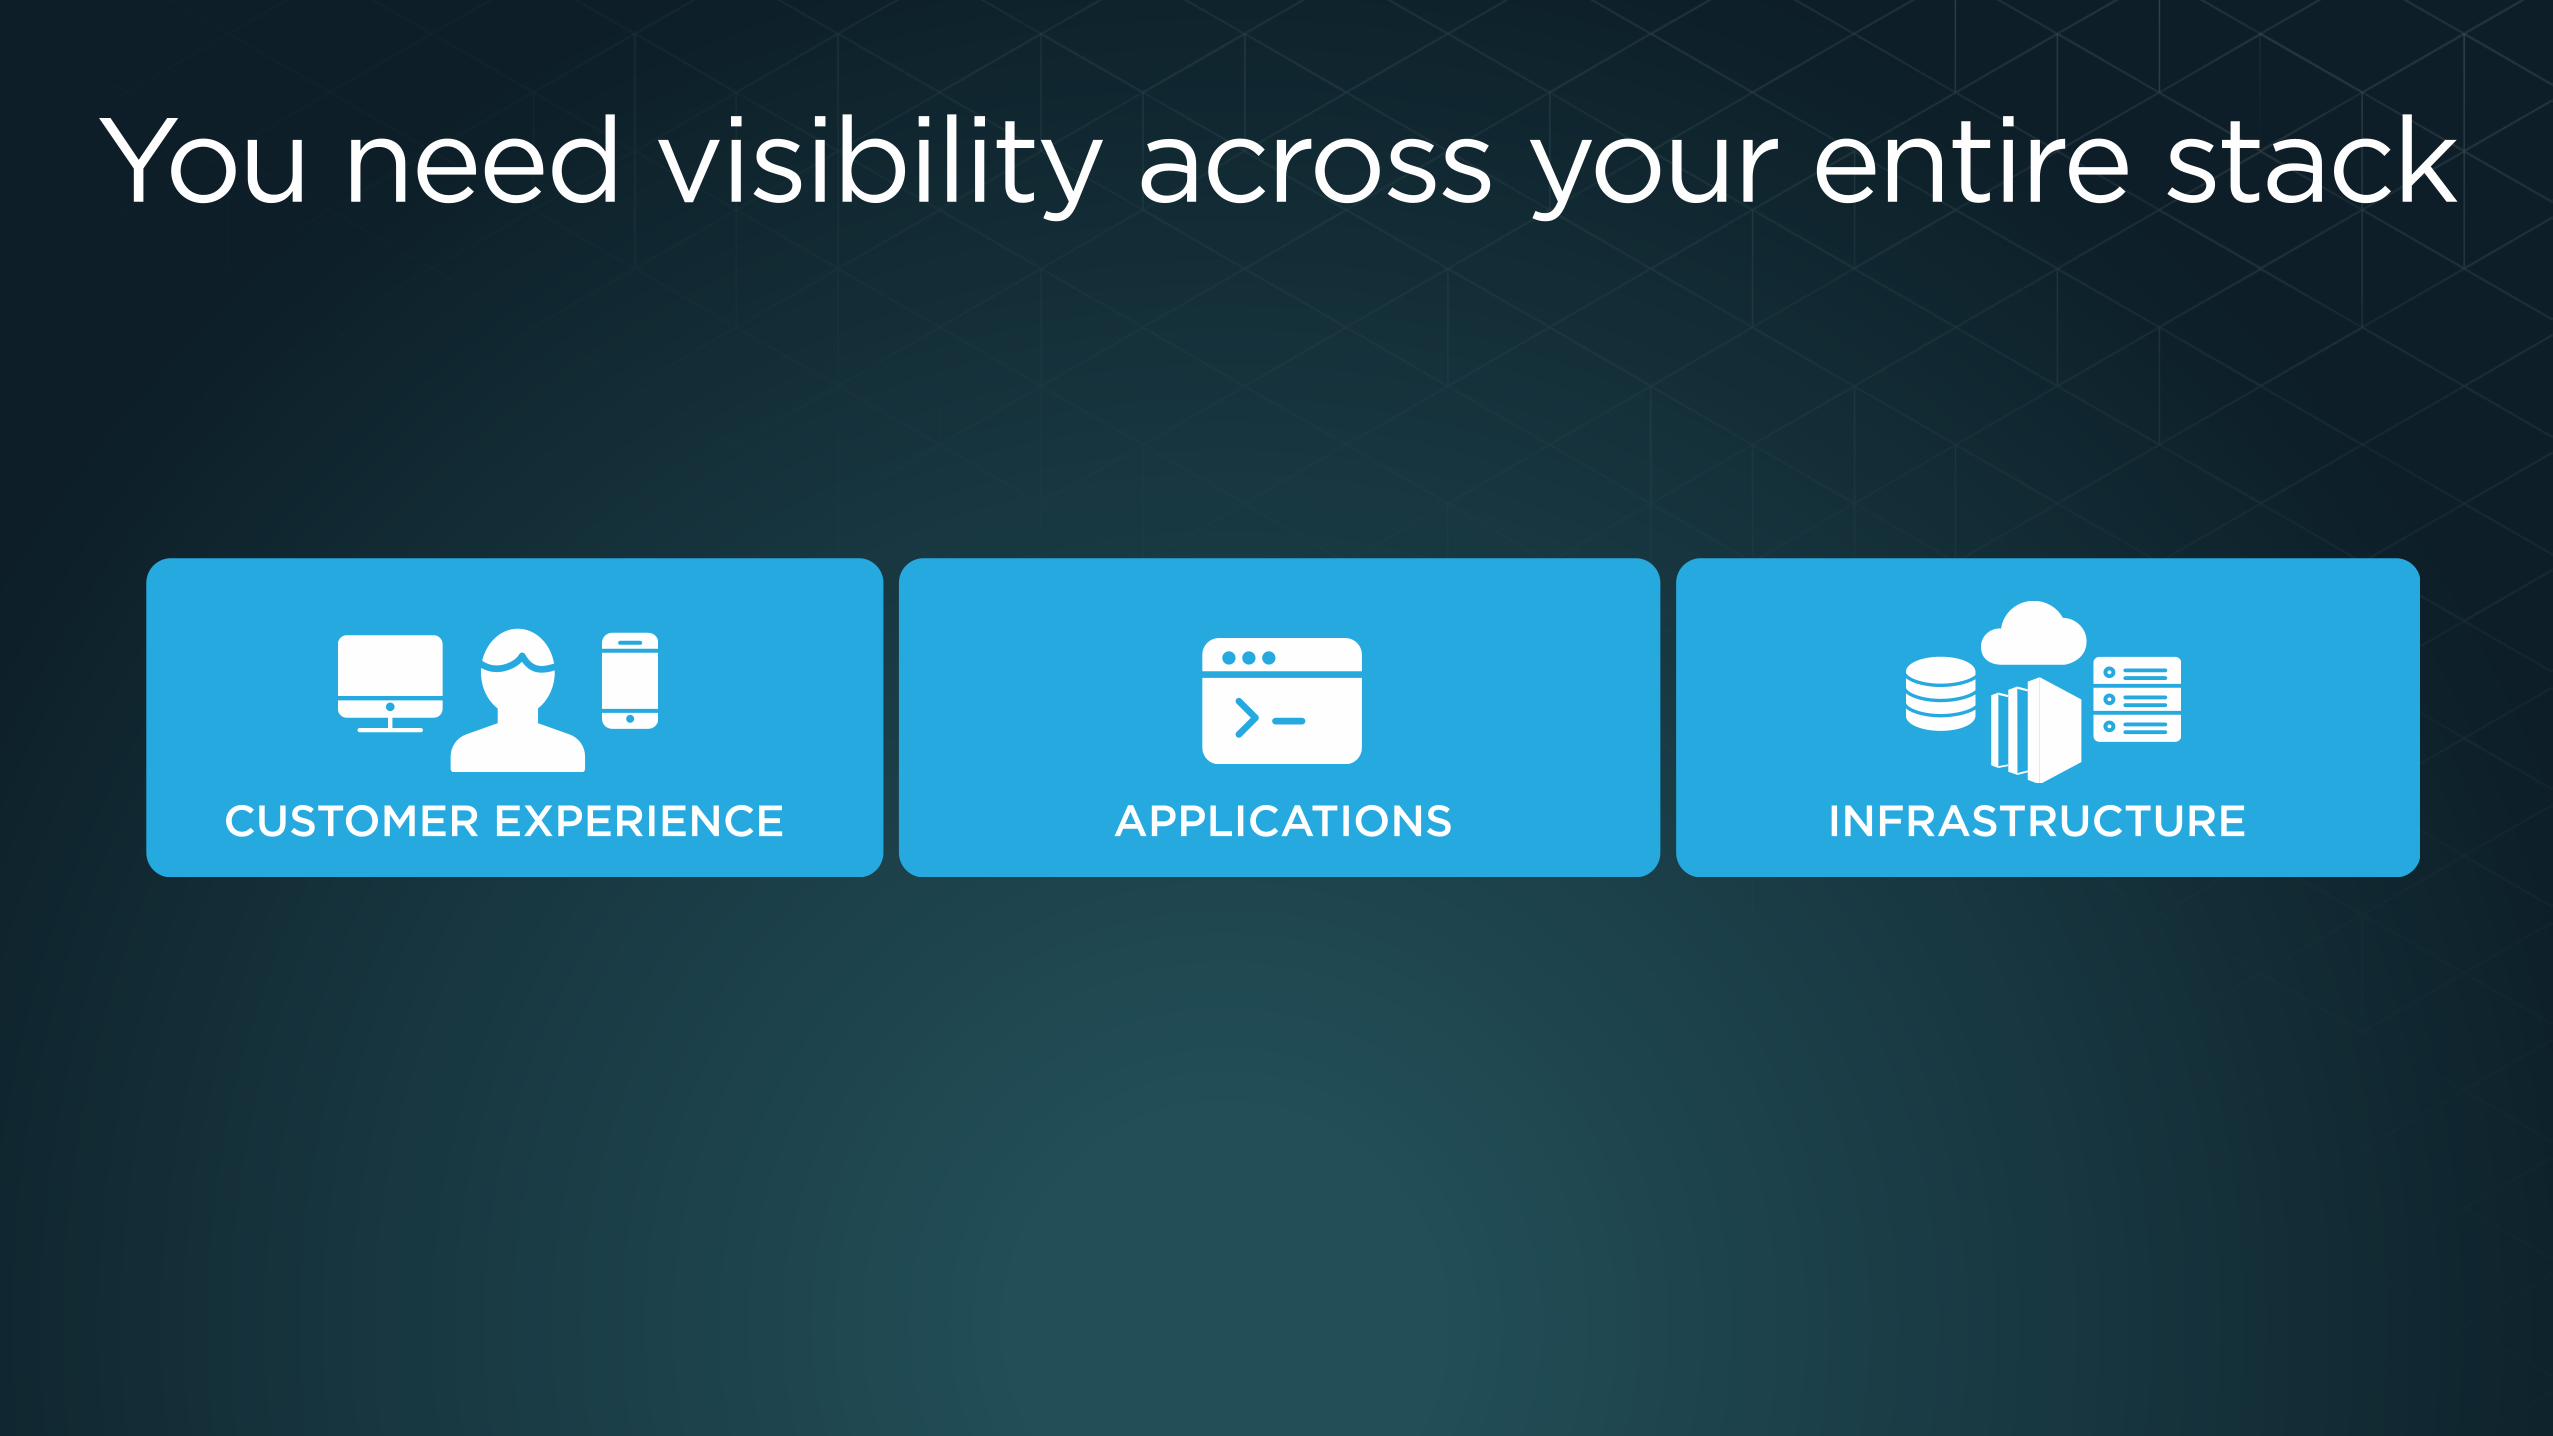
CUSTOMER EXPERIENCE APPLICATIONS INFRASTRUCTURE
You need visibility across your entire stack

CUSTOMER EXPERIENCE APPLICATIONS INFRASTRUCTURE
Metrics and Full Instrumentation
Metrics Dashboards Alerts

Scalable Cloud Platform
CUSTOMER EXPERIENCE APPLICATIONS INFRASTRUCTURE
Metrics Dashboards Alerts
Multi-Tenant On-Demand Scale Enterprise Security
CLOUD ANALYTICS PLATFORM
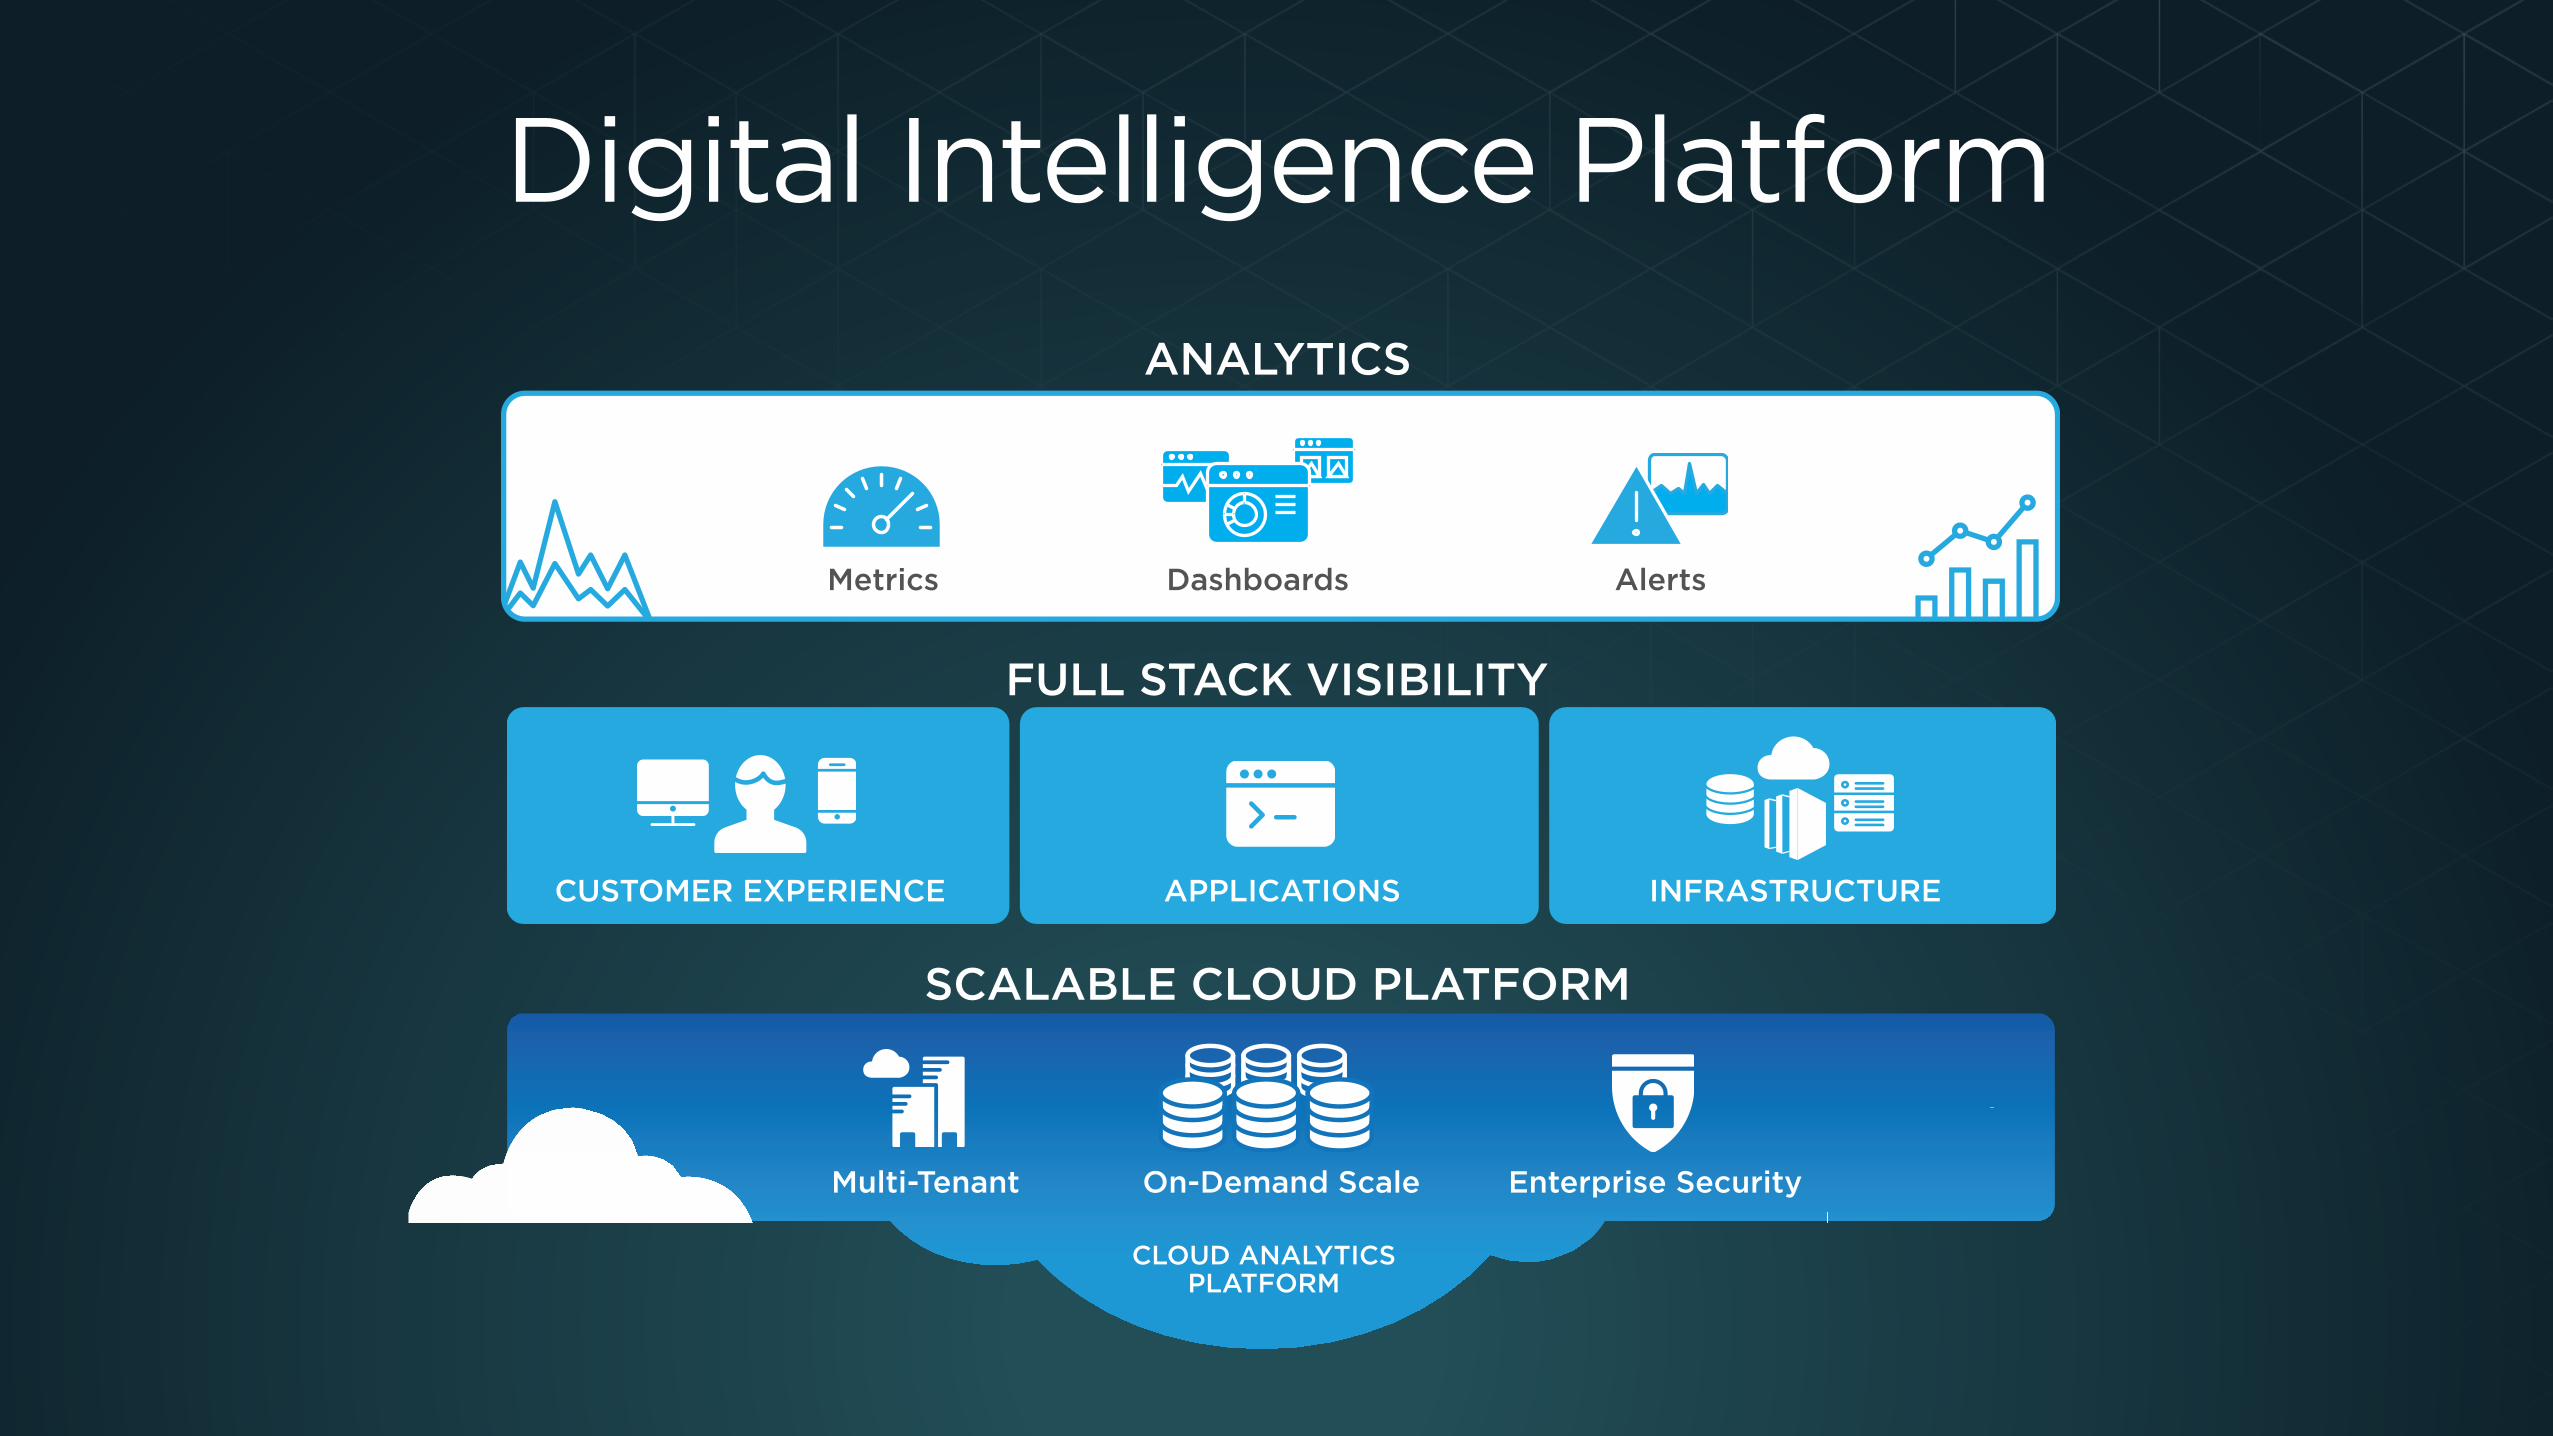
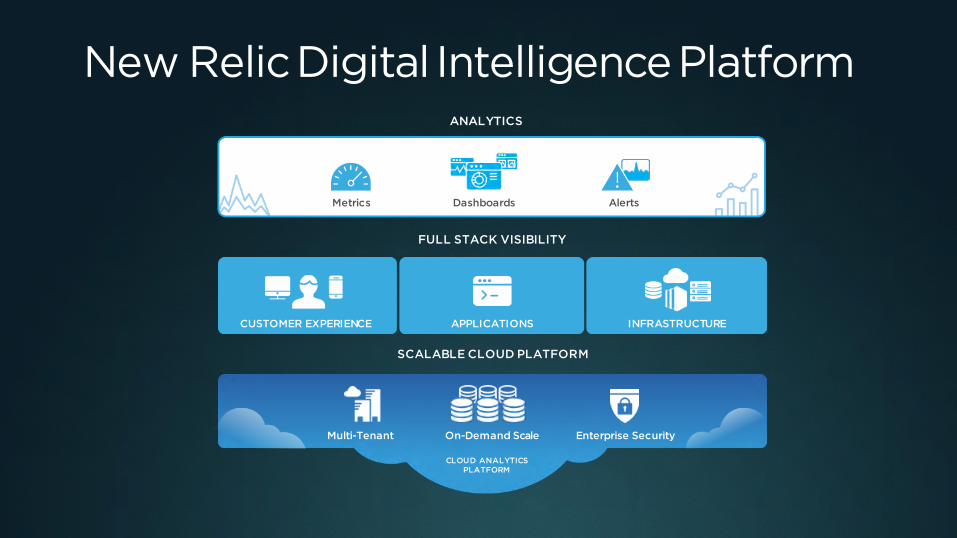
Digital Intelligence Platform
CUSTOMER EXPERIENCE APPLICATIONS INFRASTRUCTURE
Metrics Dashboards Alerts
Multi-Tenant On-Demand Scale Enterprise Security
CLOUD ANALYTICS PLATFORM
ANALYTICS
FULL STACK VISIBILITY
SCALABLE CLOUD PLATFORM
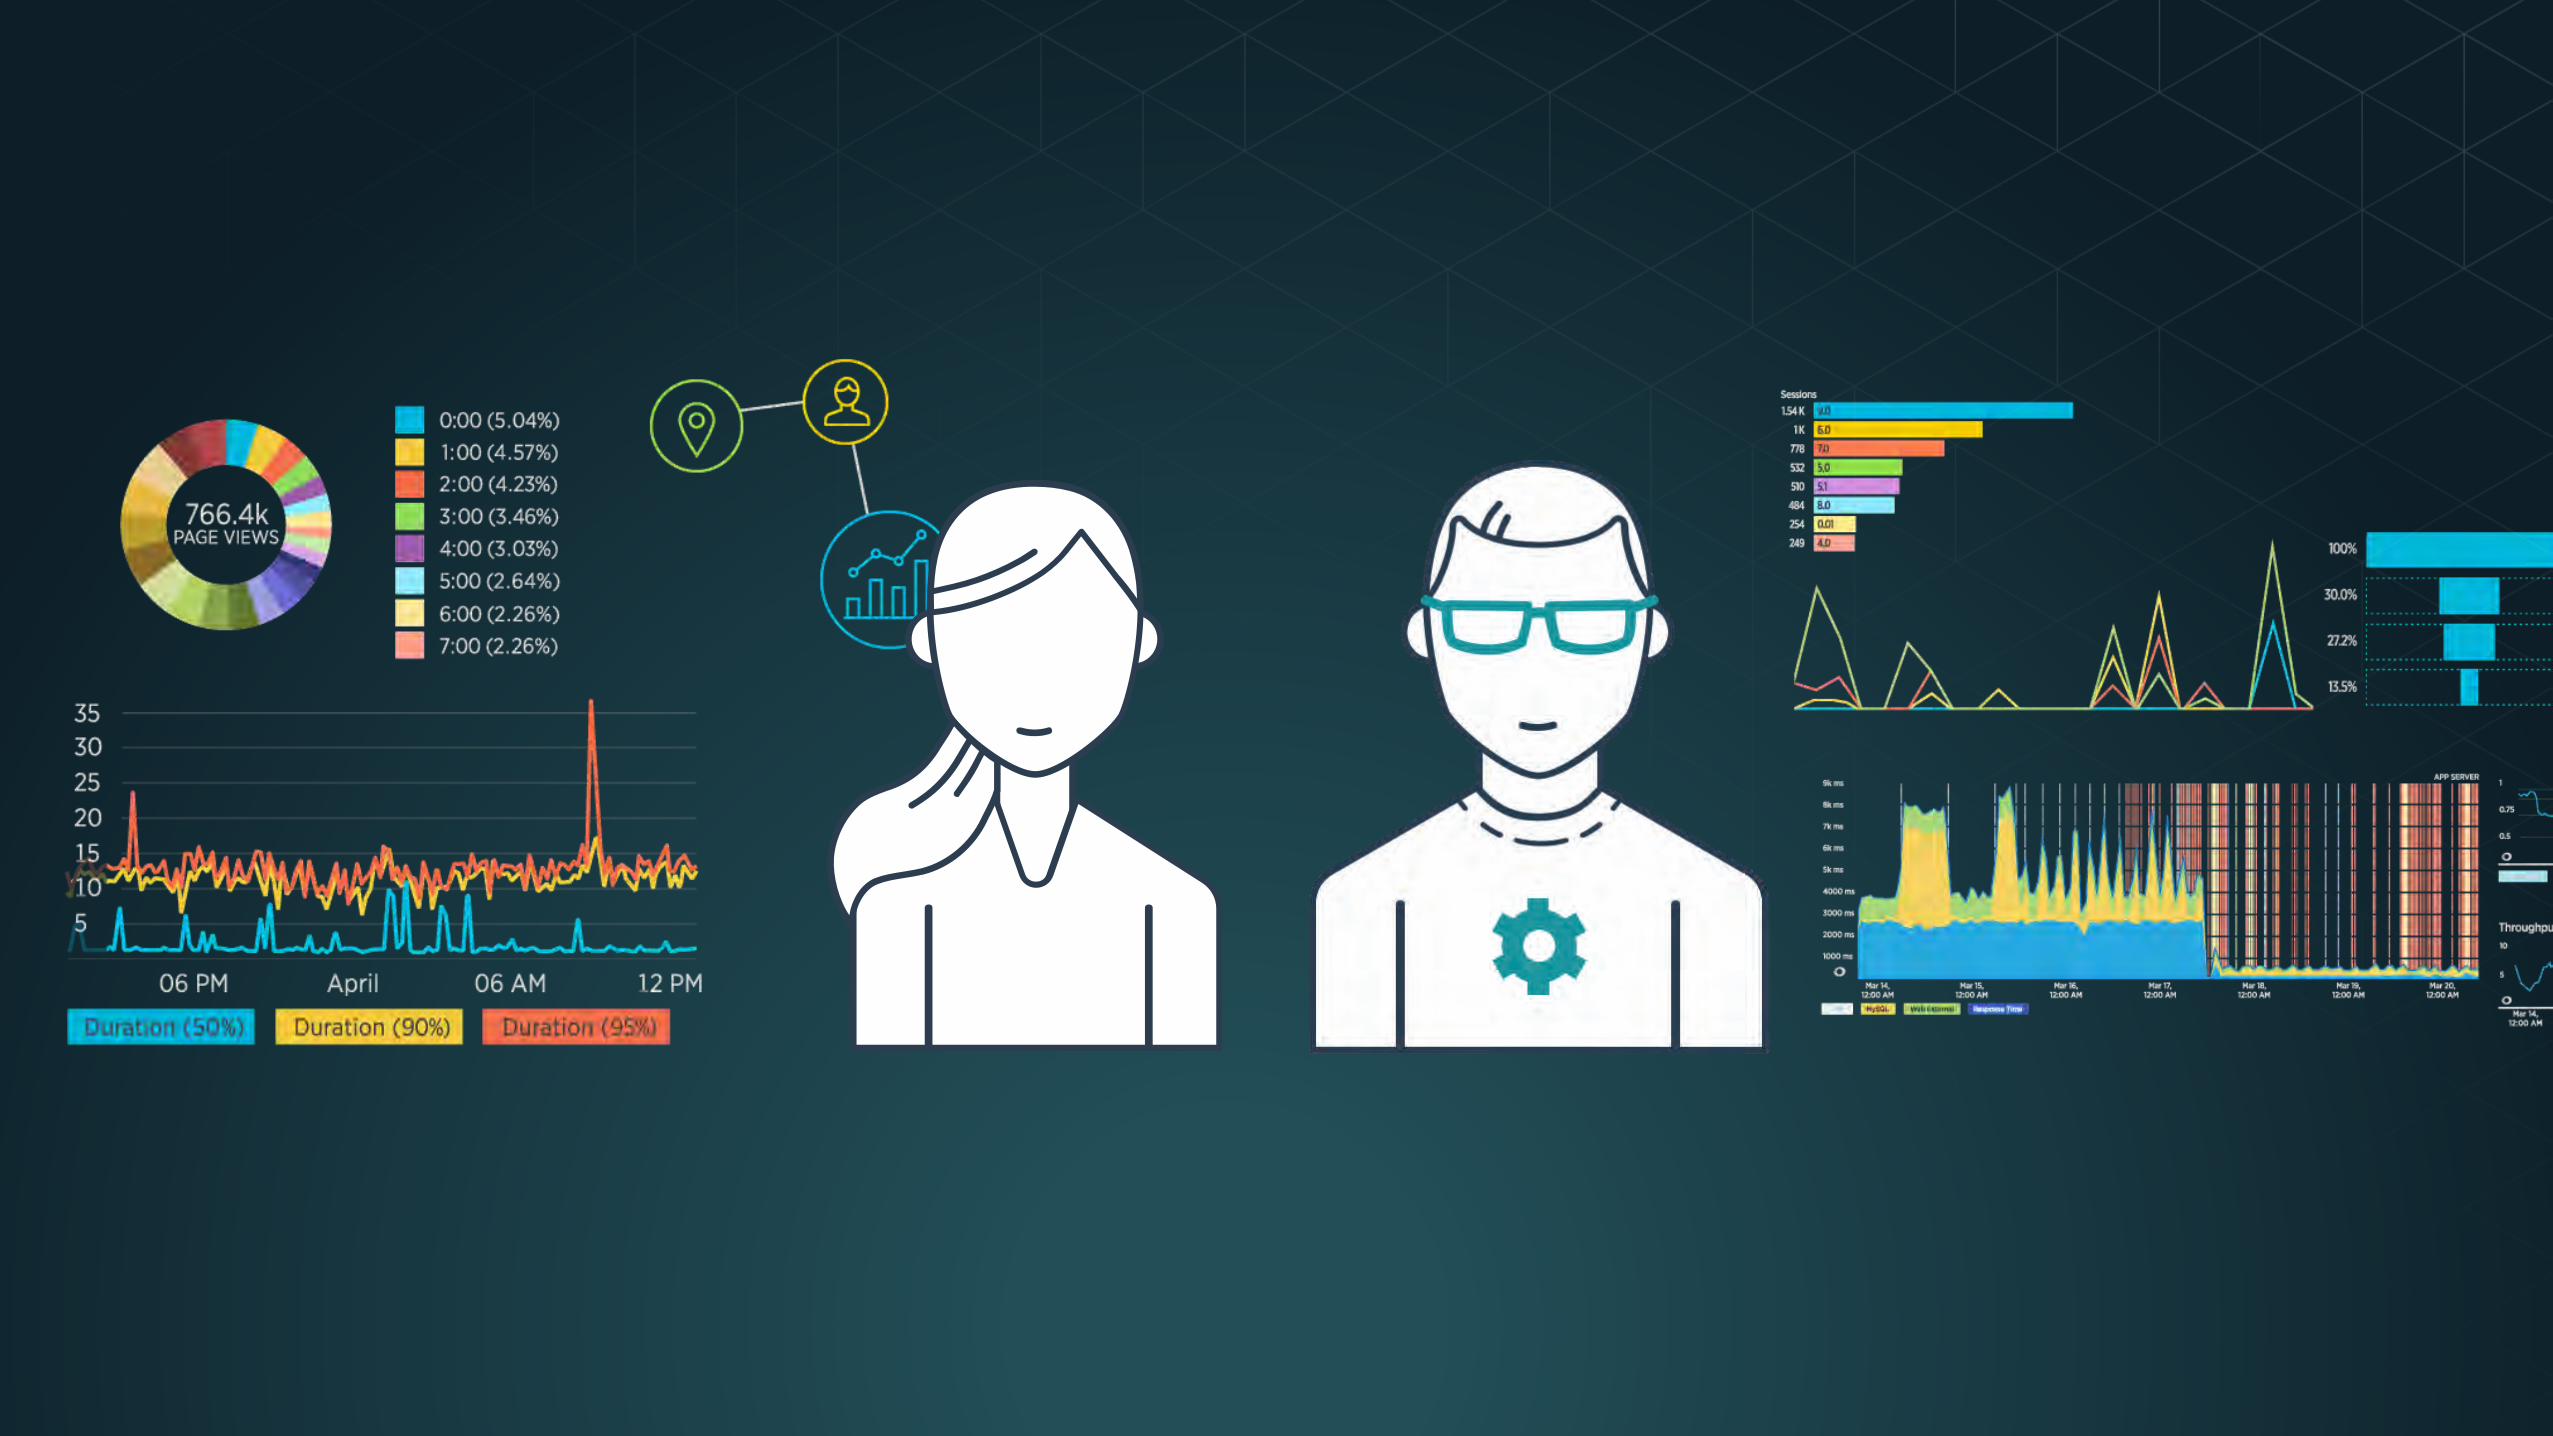

More data, more people
Executives
Customer Care
Operations
Product ManagerDevelopers
Quality Assurance

PROJECT SEYMOUR

New Relic is Uniquely Positioned to Capitalize
Leader in Product Innovation
Devout / LoyalFollowing
100% Cloud
Massive Data Ingestion Engine

Drivers of $1B
Increase ARPU
Greater User Adoption
Add New Customers
Continued Leadershipin Product Innovation
Seeking to Build a $1B PlatformJim GocheeChief Product Officer

This document and the information herein (including any information that may be incorporated by reference) is providedfor informational purposes only and should not be construed as an offer, commitment, promise or obligation on behalf ofNew Relic, Inc. (“New Relic”) to sell securities or deliver any product, material, code, functionality, or other feature. Anyinformation provided hereby is proprietary to New Relic and may not be replicated or disclosed without New Relic’sexpresswritten permission.
Such information may contain forward-looking statements within the meaning of federal securities laws. Any statementthat is not a historical fact or refers to expectations, projections, future plans, objectives, estimates, goals, or othercharacterizations of future events is a forward-looking statement. These forward-looking statements can often beidentified as such because the context of the statement will include words such as “believes,” “anticipates,”, “expects” orwords of similar import.
Actual results may differ materially from those expressed in these forward-looking statements, which speak only as ofthe date hereof, and are subject to change at any time without notice. Existing and prospective investors, customers andother third parties transacting business with NewRelic are cautioned not to place undue reliance on this forward-lookinginformation. The achievement or success of the matters covered by such forward-looking statements are based on NewRelic’s current assumptions, expectations, and beliefs and are subject to substantial risks, uncertainties, assumptions, andchanges in circumstances that may cause the actual results, performance, or achievements to differ materially fromthose expressed or implied in any forward-looking statement. Further information on factors that could affect suchforward-looking statements is included in the filings New Relic makes with the SEC from time to time. Copies of thesedocuments may be obtained by visiting New Relic’s Investor Relations website at ir.newrelic.com or the SEC’s website atwww.sec.gov.
New Relic assumes no obligation and does not intend to update these forward-looking statements, except as requiredby law. New Relic makes no warranties, expressed or implied, in this document or otherwise, with respect to theinformation provided.
New Relic Digital Intelligence Platform ANALYTICS
FULL STACK VISIBILITY
SCALABLE CLOUD PLATFORM
CUSTOMER EXPERIENCE APPLICATIONS INFRASTRUCTURE
Multi-Tenant On-Demand Scale Enterprise Security
CLOUD ANALYTICS PLATFORM
Metrics Dashboards Alerts

4
From Digital to IT Ops
Confidential ©2008-16 New Relic, Inc. All rights reserved.
We own the conversation with the Chief Digital Officer
We land with a digital initiative
We work back through the application stack
Started with a Mobile App
Then to apps that directly supported mobile experience
Then to apps that service the business
1 2 3

APM $5B
Infrastructure$9B
BrowserMobile Synthetics
Customer Experience $2B
Analytics $9B
Recent Announcements Meaningfully Broaden TAM
Addressable Market based on internal estimates and third-party research. Analytics derived from IDC 2016 market forecasts for Customer Relationship Analytic Apps, Supply Chain and Product-Centric Analytic Apps and Visual Data Discovery; Infrastructure derived from IDC 2016 market forecasts for Change and Configuration Management and IT Event and Log Management Tools; APM derived from bottoms-up analysis of number of addressable SMB and Enterprise customers and current New Relic APM ASP; Mobile derived from estimates of Global Monthly Active Users and current New Relic Mobile ASP; Browser derived from estimates of Global Page Views and current New Relic Browser ASP; Synthetics derived from estimates of addressable SMB and Enterprise customers and current New Relic Synthetics ASP.

COMPETITIVE LANDSCAPE
Market Dynamics
New Relic Differentiation
Infrastructure
• Rapidly evolving infrastructure (cloud, micro-services)
• Legacy vendors and open source tools inadequate / complicated
• Cloud-native, designed for modern infrastructure
• Combines app andinfrastructure visibility
Cloud Platforms
• Our core competency
• On-prem and cloud
• Neutral 3rd party
• Large market, leaders in fierce competition
• Differentiated services on top of commodity infrastructure
• Pushing to move workloads to cloud
Business Analytics
• Large market with varied competitors (systems of record, analytics, reporting, more)
• Shifting to cloud
• Siloed use cases
• Real-time visibility into application data flow
• Our APM agents proactively collect data
APM
• Modern software architectures, rapid technical innovation
• Legacy tools unable to keep up with pace of change
• Cloud-native, designed for modern apps
• Breadth of visibility and coverage

Product Announcements

UNIFIED DASHBOARDS
SERVING ENTERPRISE CUSTOMERS WITH NEW CAPABILITES
BASELINE ALERTS
CRASH ANALYSIS

CUSTOMER LOVE


“Gartner believes that more than 80% of all mission-critical IT service outages result from people and process errors and failures, and of those outages, more than 50% result from a
lack of coordination between change, release and configuration management processes."
Four Steps to Optimize Configuration Management Process and Tools, By Ronni J. Colville, Doc # G00258557, October 2013

DynamicReal-timeSee the state
AVAILABLE TODAY

KEY FEATURES
Correlated metrics and change events
for faster MTTD / MTTR
Tag-driven dynamically-
scalable alerts and dashboards
Infra-wide search to find vulnerable
packages in seconds
Native support for AWS EC2 and Docker
Visibility for key AWS servicesCloudFront, DynamoDB, EBS, ElastiCache, ELB, IAM, Kinesis, RDS, SNS, SQS, and VPC
Integration and monitoring of configuration
management tools

Growing our Market Opportunity

?? ?
Network Monitoring
Database Monitoring
Web & User Analytics
Marketing Automation
Customer Support
Analytics
Cloud Cost Analytics
IoTAnalytics
SecuritySales
Automation
Logging
Data Center
Monitoring
We’re not done building software…
NRDB

Broader Product Suite Diversifies Our Business Mix
Non-APM
APM
0%
20%
40%
60%
80%
100%
FY14A FY15A FY16A FY17E FY18E FY19E FY20E FY21E FY22E
Re
ve
nu
e M
ix %
The above table is designed to be illustrative of potential trends and should not be construed as guidance or a financial outlook of any kind.
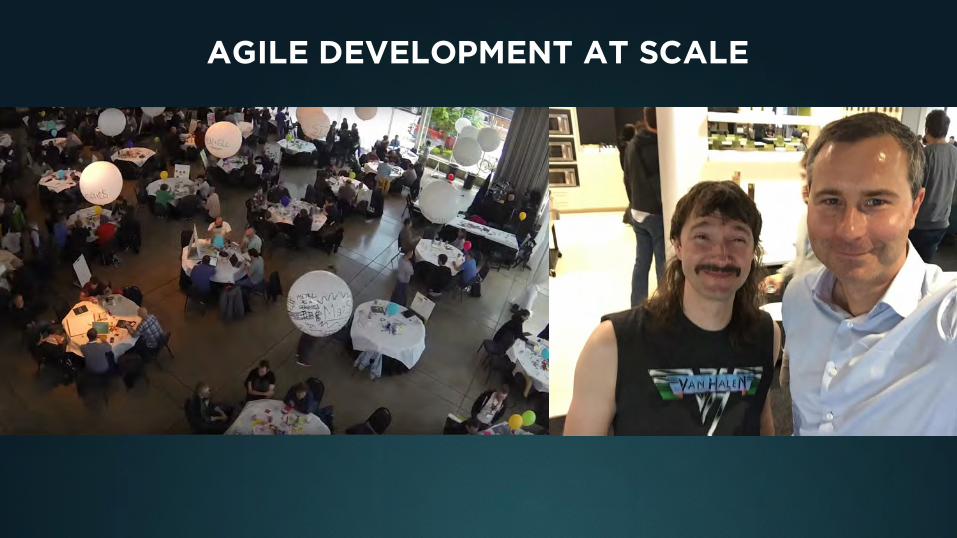
AGILE DEVELOPMENT AT SCALE

Building a $1B GTM EngineHilarie Koplow-McAdamsPresident

This document and the information herein (including any information that may be incorporated by reference) is providedfor informational purposes only and should not be construed as an offer, commitment, promise or obligation on behalf ofNew Relic, Inc. (“New Relic”) to sell securities or deliver any product, material, code, functionality, or other feature. Anyinformation provided hereby is proprietary to New Relic and may not be replicated or disclosed without New Relic’sexpresswritten permission.
Such information may contain forward-looking statements within the meaning of federal securities laws. Any statementthat is not a historical fact or refers to expectations, projections, future plans, objectives, estimates, goals, or othercharacterizations of future events is a forward-looking statement. These forward-looking statements can often beidentified as such because the context of the statement will include words such as “believes,” “anticipates,”, “expects” orwords of similar import.
Actual results may differ materially from those expressed in these forward-looking statements, which speak only as ofthe date hereof, and are subject to change at any time without notice. Existing and prospective investors, customers andother third parties transacting business with NewRelic are cautioned not to place undue reliance on this forward-lookinginformation. The achievement or success of the matters covered by such forward-looking statements are based on NewRelic’s current assumptions, expectations, and beliefs and are subject to substantial risks, uncertainties, assumptions, andchanges in circumstances that may cause the actual results, performance, or achievements to differ materially fromthose expressed or implied in any forward-looking statement. Further information on factors that could affect suchforward-looking statements is included in the filings New Relic makes with the SEC from time to time. Copies of thesedocuments may be obtained by visiting New Relic’s Investor Relations website at ir.newrelic.com or the SEC’s website atwww.sec.gov.
New Relic assumes no obligation and does not intend to update these forward-looking statements, except as requiredby law. New Relic makes no warranties, expressed or implied, in this document or otherwise, with respect to theinformation provided.

Agenda
New Relic at $1B Key Drivers and Characteristics
Review of Land and Expand Model
Reflection on Progress and Evolution

Drivers of Growth
1.6x Products per Customer
Increase Spend
More 100+ User Customers
Greater User Adoption
<10% Penetrated in Enterprise or SMB
Add New Customers
Significant Addressable TAM
Continued Leadershipin Product Innovation
Penetration based on internal estimates of total addressable market

Enterprise, International Growth Key Drivers to $1B
Today Q4F22Q1F15
Enterprise % of Revenue
~43% 60-70%~33%
SMB % of Revenue ~57% 30-40%~67%
Current data represents the fiscal quarter ending September 30, 2016. the future financial results presented are hypothetical amounts for achievement of certain scenarios and are not projections, guidance or an outlook for the company's future financial results

International % ~29% 30-40%~31%
US % ~71% 60-70%~69%
Enterprise, International Growth Key Drivers to $1B
Today Q4F22Q1F15
Current data represents the fiscal quarter ending September 30, 2016. the future financial results presented are hypothetical amounts for achievement of certain scenarios and are not projections, guidance or an outlook for the company's future financial results

How Do We Get There?Land & Expand

The Land & Expand ModelFrom viral adoption to enterprise standard
Hypothetical ARR
Technical Win (Land)
Broaden Across Company and
Products (Expand)
Platform Solution (Expand)
Standardization
$50 - $100K+ $100 – 500K+ $500K – $1M+ $1M+

Strategic Land Deals Growing in Size and Scope
1H’15
$190K Average Land / 1.1x Products
1H’17
$281K Average Land / 3.1x Products
Strategic land deals represents initial transactions into a paid business account for >$100K ARR. Excludes Partnership Transaction.

ExpandConsistent Historical Customer Growth Over Time
$0M
$50M
$100M
$150M
$200M
$250M
FY10 FY11 FY12 FY13 FY14 FY15 FY16
To
tal
AR
R
2010
2013
2011
2012
2016
2014
2015
CAGR
34%
38%
33%
Chart reflects growth in total ARR over time, net of churn, for the group of customers that joined New Relic in each respective year. As of March 31, 2016.

As our customers’ digital businesses grow, so does our business

ExpandGrowing with a $1M+ Customer’s Environment
(Internet Company)
Number of APM Hosts Annual Subscription Value
FY12
FY13
FY14
FY15
FY16
FY17
Now over $1M
FY12
FY13
FY14
FY15
FY16
FY17
19xRepeat purchaser since initial
purchase in 2011
EvaluatingCurrent Products

ExpandStandardizing Across Business Units
(Media Company)
Number of APM Hosts Annual Subscription Value
FY13
FY14
FY15
FY16
FY13
FY14
FY15
FY16
FY17
FY17
>50xIncrease in number
of hosts
Now over $1M

ExpandOur Largest Customers Come Back for More
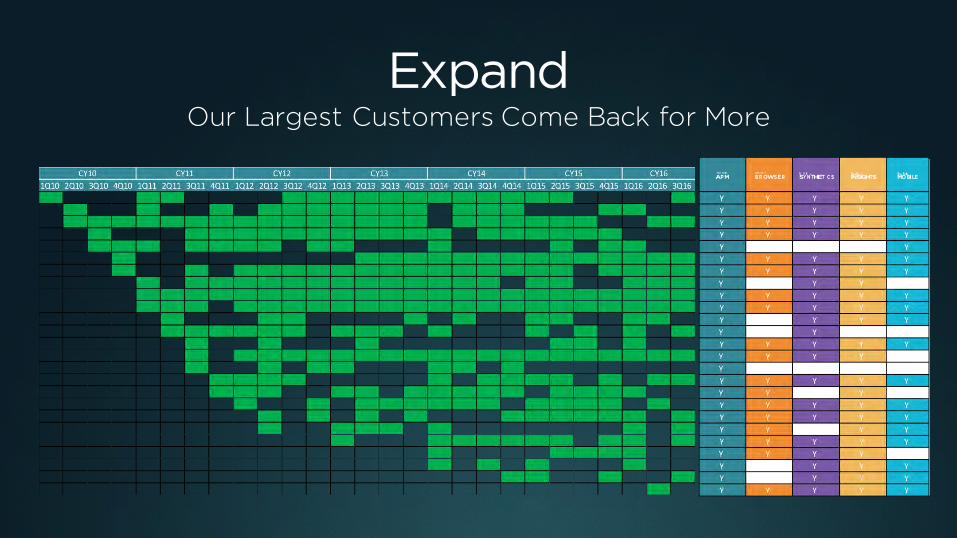
ExpandOur Largest Customers Come Back for More

Where We’ve Been Where We’re Going
SMB Continued Investment and
Optimization
Significantly expanded Enterprise
field coverage
Evolving Marketing and Partnership
strategy

Beginning of FY15
Feet on the Street

Today
Feet on the Street

Investments Driving More Strategic Relationships
0
100
200
300
400
500
Sep2013
Sep2014
Sep2015
Sep2016
Paid Business Accounts >$100K in Annual Revenue
Paid Business Accounts >$1M in Annual Revenue
Note: Annualized subscription revenue calculated as quarterly revenue multiplied by 4 for each quarterly period. See Appendix for an explanation of how we define a Paid Business Account
by Fiscal Quarter by Fiscal Quarter
0
10
20
30
Sep2013
Sep2014
Sep2015
Sep2016

14,000+ Customers

Importance of PartnersCLOUD PLATFORM
SI & DA
RESELLERS
MSPS
INTEGRATION PARTNERS

Marketing Evolution – Partnering to Win

Customers Tell Our Story

Training Datanerds Around the Globe

CUSTOMER PANEL
ModeratorHilarie Koplow-McAdams
President
Kevin EvansVP, DevOps and Cloud
Services
Thomas SqueoSVP, Digital Transformation
& Enterprise Architect
Scott FarnumSr. Manager, Scalability &
Performance Services

Setting the Foundation for $1BMark SachlebenCFO

This presentation contains “forward-looking” statements, as that term is defined under the federal securities laws. Any statement that refers to expectations, projections or other characterizations of future events, including financial projections and future market conditions, is a forward-looking statement. Statements included in this presentation that are forward-looking statements include but are not limited to statements regarding our future financial performance, such as the steps and potential achievement associated with respect to a hypothetical future one billion dollar run rate, including cohort growth and customer acquisition, compound annual growth rate (CAGR), revenue, customers, revenue per average paid business account, revenue mix, gross margin, capital expenditures and operating margin, outlook on financial results for the full fiscal 2017, our expectations as to non-GAAP loss from operations and operating leverage, and our expectations as to the relative business mix of enterprise, mid-market and emerging company customers . These forward-looking statements are based on our assumptions, expectations and beliefs as of the date of this presentation and are subject to substantial risks, uncertainties, assumptions, and changes in circumstances that may cause our actual results, performance, or achievements to differ materially from those expressed or implied in any forward-looking statement. We assume no obligation and do not intend to update these forward-lookingstatements, except as required by law. For more information about factors that may cause actual results to differ materially from forward-looking statements, please refer to our November 7, 2016 press release, as well as the risks described in our most recent Form 10-Q filed with the Securities and Exchange Commission (“SEC”), particularly in the section titled Risk Factors.
This presentation also contains certain non-GAAP financial measures as defined by the SEC rules. These non-GAAP financial measures are in addition to, and not a substitute for or superior to, measures of financial performance prepared in accordance with GAAP. There are a number of limitations related to the use of these non-GAAP financial measures versus their nearest GAAP equivalents. For example, other companies may calculate non-GAAP financial measures differently or may use other measures to evaluate their performance, all of which could reduce the usefulness of our non-GAAP financial measures as tools for comparison. Please refer to our November 7, 2016 press release for additional information as to why we believe these non-GAAP financial measures are useful to investors and others in assessing our operating performance. As required by Regulation G, we have provided a reconciliation of those measures to their most directly comparable GAAP measures, which is available in the appendix to this presentation. However, we have not reconciled our expectations as to non-GAAP loss from operations in future periods to its most directly comparable GAAP measure because certain items, namely stock-based compensation, lawsuit litigation expenses and employer payroll taxes on equity incentive plans, are out of our control or cannot be reasonably predicted. Accordingly, reconciliation is not available without unreasonable effort, although it is important to note that these factors could be material to our results computed in accordance with GAAP.

Agenda
Path to $1B Revenue Run-Rate
Key Growth Drivers
Path to Profitability

Path to a $1B Revenue Run-Rate
$0
$500
$1,000
FY14 FY15 FY16 FY17e
Revenue from FY17 and Prior Installed Base
Cohort growth defined as annualized ARR growth for all customers initially signed in a fiscal period, inclusive of churn. The future financial results presented are hypothetical amounts for achievement of certain scenarios and are not projections, guidance or an outlook for the company's future financial results. FY17e based on midpoint of guidance
30%+ Historical Cohort Growth
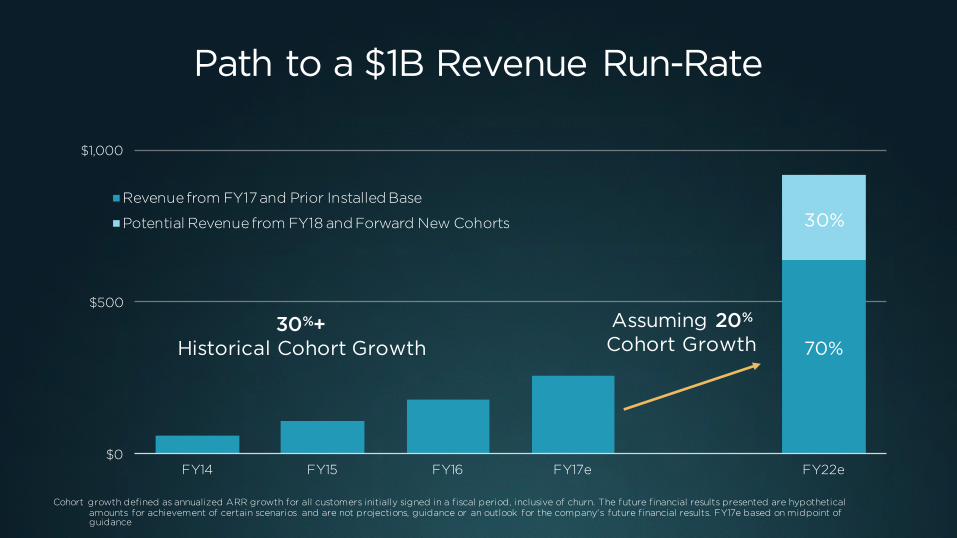
Path to a $1B Revenue Run-Rate
$0
$500
$1,000
FY14 FY15 FY16 FY17e FY22e
Revenue from FY17 and Prior Installed Base
Potential Revenue from FY18 and Forward New Cohorts
Cohort growth defined as annualized ARR growth for all customers initially signed in a fiscal period, inclusive of churn. The future financial results presented are hypothetical amounts for achievement of certain scenarios and are not projections, guidance or an outlook for the company's future financial results. FY17e based on midpoint of guidance
30%+ Historical Cohort Growth
Assuming 20%
Cohort Growth 70%
30%

Key Drivers to $1Bn
Q1F15 Today Q4F22Required Growth /
CAGR
Enterprise
% of Revenue ~33% ~43% 60–70%
Customers >900 >1,500 3,500–4,000 ~95 net / quarter
ASP >$30K >$65K $150–200K ~20%
SMB
% of Revenue ~67% ~57% 30–40%
Customers >8,500 >12,500 20,000–25,000
~430 net / quarter
ASP >$7K >$11K $14–18K ~6%
Current data represents the fiscal quarter ending September 30, 2016. The future financial results presented are hypothetical amounts for achievement of certain scenarios and are not projections, guidance or an outlook for the company's future financial results. ASP defined as annualized revenue per average paid business account.

Key Drivers to $1Bn
Q1F15 Today Q4F22
APM % of Revenue 97% ~80% <50%
Non-APM % of Revenue 3% ~20% >50%
U.S. % of Revenue ~69% ~71% 60–70%
International % of Revenue ~31% ~29% 30–40%
Current data represents the fiscal quarter ending September 30, 2016. The future financial results presented are hypothetical amounts for achievement of certain scenarios and are not projections, guidance or an outlook for the company's future financial results. ASP defined as annualized revenue per average paid business account.

One of the Fastest Growing Software Companies
$12 $30$63
$110
$181
$257
FY12 FY13 FY14 FY15 FY16 FY17E
Historical Revenue Historical Quarterly Revenue
Note: FY17 Revenue based on midpoint of previously provided guidance
$ Millions $ Millions
$23 $25$29
$33$38
$43$48
$52
$59$63
Q1 Q2 Q3 Q4 Q1 Q2 Q3 Q4 Q1 Q2
2015 2016 2017
CAGR 85%
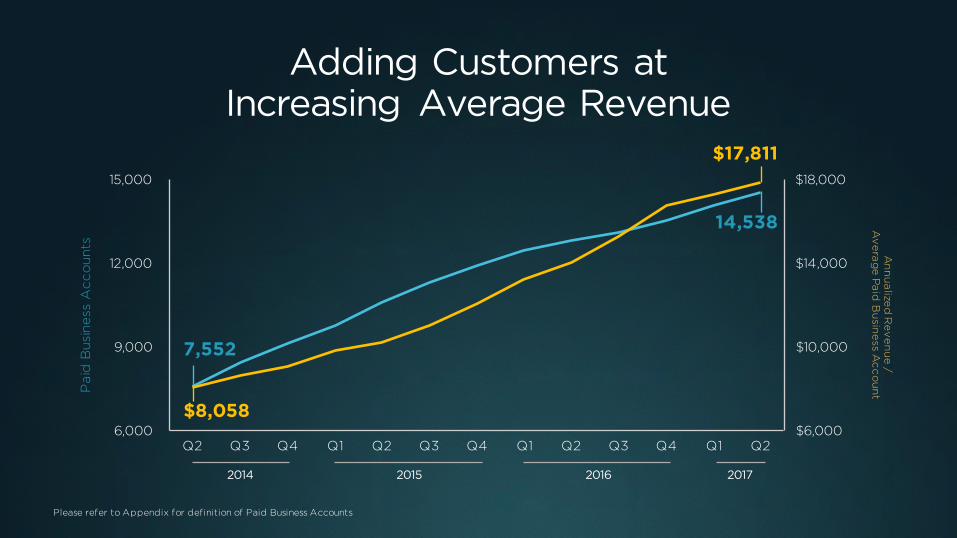
Adding Customers at Increasing Average Revenue
$6,000
$10,000
$14,000
$18,000
6,000
9,000
12,000
15,000
Q2 Q3 Q4 Q1 Q2 Q3 Q4 Q1 Q2 Q3 Q4 Q1 Q2
An
nu
alize
dR
ev
en
ue
/A
ve
rag
e P
aid
Bu
sine
ss Ac
co
un
tPaid
Busi
ness
Accounts
2014 2015 2016 2017
Please refer to Appendix for definition of Paid Business Accounts
7,552
$8,058
14,538
$17,811

$25,000
$50,000
$75,000
$6,000
$9,000
$12,000
Q2 Q3 Q4 Q1 Q2 Q3 Q4 Q1 Q2 Q3 Q4 Q1 Q2
With Spend Increasing Across Both Parts of the Business
Note: ASP measured as annualized revenue per average paid business account
En
terp
rise A
SP
sSM
B A
SP
>50% Growth since Q1’15
>100% Growth since Q1’15
2014 2015 2016 2017

Investments Driving More Strategic Relationships
0
100
200
300
400
500
Sep2013
Sep2014
Sep2015
Sep2016
Paid Business Accounts >$100K in Annual Revenue
Paid Business Accounts >$1M in Annual Revenue
Annualized subscription revenue calculated as quarterly revenue multiplied by 4 for each quarterly period. See Appendix for an explanation of how we define a Paid Business Account
by Fiscal Quarter by Fiscal Quarter
0
10
20
30
Sep2013
Sep2014
Sep2015
Sep2016

Strong (but variable) Dollar-based Net Expansion Rates
80%
100%
120%
140%
Q2 Q3 Q4 Q1 Q2 Q3 Q4 Q1 Q2 Q3 Q4 Q1 Q2
New Relic calculated Net Expansion Rate
See Appendix for an explanation of how we calculate Dollar-Based Net Expansion rate
Do
llar-
ba
sed
Ne
t E
xp
an
sio
n R
ate
2014 2015 2016 2017

Strong (but variable) Dollar-based Net Expansion Rates
80%
100%
120%
140%
Q2 Q3 Q4 Q1 Q2 Q3 Q4 Q1 Q2 Q3 Q4 Q1 Q2
New Relic Net Expansion Rate based on peer methodology
New Relic calculated Net Expansion Rate
See Appendix for an explanation of how we calculate Dollar-Based Net Expansion rate. Peer methodology based on typical SaaS company metric analyzing year-over-year change in customer spend by previous year’s base of customers.
Do
llar-
ba
sed
Ne
t E
xp
an
sio
n R
ate
2014 2015 2016 2017

Installed Base Breakdown of MRR by:
96%86% 80%
4%14% 20%
Q215
Q216
Q217
APM Non-APM
Product Category Product Ownership Commitment Type
94%78% 73%
6%22% 27%
Q215
Q216
Q217
Single Product Multi-Product
96%86% 81%
4%14% 19%
Q215
Q216
Q217
Annual Multi-Year

New Products Expand Our Potential Wallet Share
Today Potential with New Relic Infrastructure
Potential Longer-Term State
$1.00
~$2.00
~$3.00
New Products
Amounts shown are not drawn to scale and are indicative of hypothetical scenarios.
? ? ?
? ?

Path to Profitability
Best-in-Class gross margin provides
degrees of freedom
SMB already profitable, Enterprise showing
early leverage
Non-GAAP operating income positive
no later than Q4’18

50%
60%
70%
80%
90%
Best-in-Class Gross Margins
Source: Company earnings releases filed with the SEC covering the last six months reported as of November 7, 2016. Peers identified based on Wall Street Research comparable SaaS company groupings.
GAAP Gross Margin vs. SaaS Peers
Peer Average: 66%

Increasing Scale Delivering Operating Leverage
90%76%
66%
24%
20%22%
14%
18%16%
17%
19%19%
144%133%
123%112%
0%
25%
50%
75%
100%
125%
150%
FY14 FY15 FY16 FY17E
S&MR&DG&ACOGS
Expenses as a Percentage of Revenue
Note: Expenses and COGS are presented on a non-GAAP basis; see Appendix for reconciliation to the most directly comparable GAAP measures; FY17 Based on midpoint of guidance.

Strong and Consistent Operating Leverage Improvements
-44%
-33%
-23%
-12%
-33%
-12%
2% 3%
-56%
-32%
-8%-5%
-50%
-40%
-30%
-20%
-10%
0%
10%
FY14 FY15 FY16 1H17
Operating Margin
Operating Cash Flow Margin
Free Cash Flow Margin
Note: Metrics are Non-GAAP and exclude stock-based compensation, amortization of acquired intangibles, equity-related taxes, litigation and acquisition-related expenses. See Appendix for definition of Free Cash Flow as well as a reconciliation of these Non-GAAP financial measures.

Long-term Target Operating Model
Note: Metrics are Non-GAAP and exclude stock-based compensation, amortization of purchased intangibles, litigation and acquisition-related expenses. See Appendix for reconciliation.
(% of Revenue) FY14 FY15 FY16 2Q17FY22
Target DriverLong-Term
Target
Gross Margin 83% 81% 81% 83% 78-82%Continued investments in delivery, support and services 78–82%
Sales & Marketing 90% 76% 66% 58% 40-42%Increased mix of productive reps, renewals, installed base 35–38%
Research & Development
24% 20% 22% 19% 17-19% Maturation of product portfolio 15–18%
General & Administrative
14% 18% 16% 14% 10-12% Economies of Scale 7–9%
Operating Margin (44%) (33%) (23%) (8%) 8-12% 20–25%

Deferred Revenue Factors
In-Period Duration Seasonality Mix Shift Co-Terming

Billing Mix Has Continued to Push Towards Annual, But Slowing
0%
25%
50%
75%
100%
Q1 Q2 Q3 Q4 Q1 Q2 Q3 Q4 Q1 Q2
2015 2016 2017
Monthly
Annual
Quarterly
Other

2
4
6
8
Q1'15 Q2'15 Q3'15 Q4'15 Q1'16 Q2'16 Q3'16 Q4'16 Q1'17 Q2'17
Installed Base Duration
In-Period Duration Fluctuates and Can Create Distortions
Mo
nth
s

2
4
6
8
Q1'15 Q2'15 Q3'15 Q4'15 Q1'16 Q2'16 Q3'16 Q4'16 Q1'17 Q2'17
In-Period Duration
Installed Base Duration
In-Period Duration Fluctuates and Can Create Distortions
Mo
nth
s
$5.6M tied to multi-year billings which did not repeat in Q2’17
Installed base duration defined as dollar-weighted billing duration of full customer base. In-period duration defined as dollar-weighted billing duration of customers billed during that period.

Appendix – DefinitionsMonthly Recurring Revenue (MRR)Our monthly recurring revenue represents the revenue that we would contractually expect to receive from those customers over the following month, without any increase or reduction in any of their subscriptions.
Number of Paid Business AccountsWe define the number of paid business accounts at the end of any particular period as the number of accounts at the end of the period as identified by a unique account identifier for which we have recognized revenue on the last day of the period indicated. A single organization or customer may have multiple paid business accounts for separate divisions, segments, or subsidiaries.>$100K and >$1M / year paid business accounts represents paid business accounts who have MRR greater than $100,000 divided by twelve or $1,000,000 divided by twelve, respectively.
We define our annualized revenue per average paid business account as the annualized revenue for the current period divided by the average of the number of paid business accounts at the end of the current period and the end of the prior period.
Dollar-Based Net Expansion RateOur dollar-based net expansion rate compares our recurring subscription revenue from customers from one period to the next. We measure our dollar-based net expansion rate on a monthly basis because many of our customers change their subscriptions more frequently than quarterly or annually. To calculate our annual dollar-based net expansion rate, we first establish the base period monthly recurring revenue from all our customers at the end of a month. This represents the revenue we would contractually expect to receive from those customers over the following month, without any increase or reduction in any of their subscriptions.
We then (i) calculate the actual monthly recurring revenue from those same customers at the end of that following month; then (ii) divide that following month’s recurring revenue by the base month’s recurring revenue to arrive at our monthly net expansion rate; then (iii) calculate a quarterly net expansion rate by compounding the net expansion rates of the three months in the quarter; and then (iv) calculate our annualized net expansion rate by compounding our quarterly net expansion rate over an annual period.
Free Cash FlowWe define free cash flow as cash from operating activities minus purchases of property and equipment minus capitalized software development costs.

Appendix – Non-GAAP to GAAP ReconciliationReconciliation from GAAP to Non-GAAP Results
(In thousands, except per share data; unaudited)
Year Ended March 31,Three
Months Ended
2016 2015 2014 Sept. 30, 2016Reconciliation of gross profit and gross margin:
GAAP gross profit $144,126 $88,589 $52,394 $ 51,662 Plus: Stock-based compensation 1,238 591 159 513 Plus: Amortization of purchased intangibles 939 400 — 200 Plus: Amortization of stock-based compensation capitalized in software development costs 544 179 54 169 Plus: Employer payroll tax on employee equity incentive plans 18 — — 30 Non-GAAP gross profit $146,865 $89,759 $52,607 $ 52,574 GAAP gross margin 79% 80% 83% 81%Non-GAAP adjustments 2% 1% 0% 2%Non-GAAP gross margin 81% 81% 83% 83%Reconciliation of operating expenses:
GAAP research and development $46,394 $24,024 $16,496 $ 14,741 Less: Stock-based compensation (6,659) (2,055) (1,425) (2,522)Less: Employer payroll tax on employee equity incentive plans (258) — — (88)Non-GAAP research and development $39,477 $21,969 $15,071 $ 12,131 GAAP sales and marketing $129,677 $89,162 $58,156 $ 40,382 Less: Stock-based compensation (9,258) (5,108) (1,373) (3,409)Less: Amortization of purchased intangibles (50) (25) — (14)Less: Employer payroll tax on employee equity incentive plans (503) — — (148)Non-GAAP sales and marketing $119,866 $84,029 $56,783 $ 36,811 GAAP general and administrative $35,693 $25,319 $17,178 $ 10,833 Less: Stock-based compensation (6,113) (3,912) (3,263) (1,819)Less: Lawsuit litigation (46) (1,322) (5,135) (2)Less: Amortization of purchased intangibles (150) (75) — (41)Less: Transaction costs related to acquisition (385) (71) — —Less: Employer payroll tax on employee equity incentive plans (301) — — (395)Non-GAAP general and administrative $28,698 $19,939 $8,780 $ 8,576 Reconciliation of loss from operations and operating margin:
GAAP loss from operations $(67,638) $(49,916) $(39,436) $ (14,294)Plus: Stock-based compensation 23,268 11,666 6,220 8,263 Plus: Lawsuit litigation 46 1,322 5,135 2 Plus: Amortization of purchased intangibles 1,139 500 — 255 Plus: Transaction costs related to acquisition 385 71 — —Plus: Amortization of stock-based compensation capitalized in software development costs 544 179 54 169 Plus: Employer payroll tax on employee equity incentive plans 1,080 — — 661 Non-GAAP loss from operations $(41,176) $(36,178) $(28,027) $ (4,944)GAAP operating margin (37%) (45%) (62%) (23%)Non-GAAP adjustments 14% 12% 18% 15%Non-GAAP operating margin (23%) (33%) (44%) (8%)

Appendix – Non-GAAP to GAAP ReconciliationReconciliation of GAAP Cash Flows from Operating Activities to Free Cash Flows
(In thousands; unaudited)
Three Months Ended
Sept. 30, 2016 Jun. 30, 2016
Net cash provided by (used in) operating activities $431 $3,406 Capital expenditures (6,963) (1,527)
Capitalized software development costs (1,021) (712)
Free cash flows (Non-GAAP) (7,553) 1,167
Reconciliation of GAAP Cash Flows from Operating Activities to Free Cash Flows
(In thousands; unaudited)
Year Ended March 31,
2016 2015 2014
Net cash provided by (used in) operating activities $4,006 $(13,621) $(20,713)Capital expenditures (11,732) (12,628) (9,758)
Capitalized software development costs (6,748) (9,017) (5,199)
Free cash flows (Non-GAAP) (14,474) (35,266) (35,670)
![Tech M&A Monthly€¦ · Half-Day Tech M&A Bootcamp The most attended tech executive conference in ... New Relic [USA] Transaction Value: $37M ... Research Analyst. 44. Sellers Panel](https://img.pdfslide.net/doc/110x75/5ed0a7370b370e0edc660064/tech-ma-monthly-half-day-tech-ma-bootcamp-the-most-attended-tech-executive.jpg)