Embed Size (px)
Citation preview
8 MARCH 2017
CONFERENCE CALL FY2016 – PRELIMINARY RESULTS
RETAILERS
FY2016 – Preliminary Results 2 8 March 2017
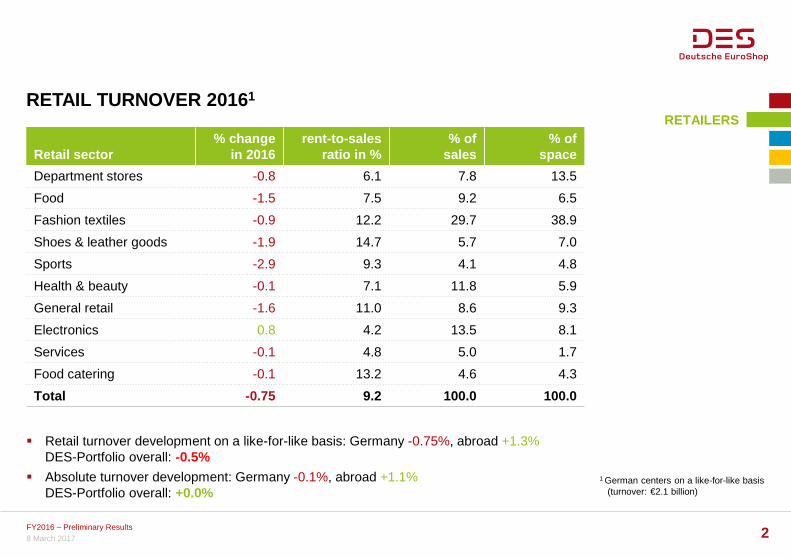
RETAIL TURNOVER 20161
1 German centers on a like-for-like basis (turnover: €2.1 billion)
Retail sector % change
in 2016 rent-to-sales
ratio in % % of
sales % of
space
Department stores -0.8 6.1 7.8 13.5
Food -1.5 7.5 9.2 6.5
Fashion textiles -0.9 12.2 29.7 38.9
Shoes & leather goods -1.9 14.7 5.7 7.0
Sports -2.9 9.3 4.1 4.8
Health & beauty -0.1 7.1 11.8 5.9
General retail -1.6 11.0 8.6 9.3
Electronics 0.8 4.2 13.5 8.1
Services -0.1 4.8 5.0 1.7
Food catering -0.1 13.2 4.6 4.3
Total -0.75 9.2 100.0 100.0
Retail turnover development on a like-for-like basis: Germany -0.75%, abroad +1.3% DES-Portfolio overall: -0.5%
Absolute turnover development: Germany -0.1%, abroad +1.1% DES-Portfolio overall: +0.0%
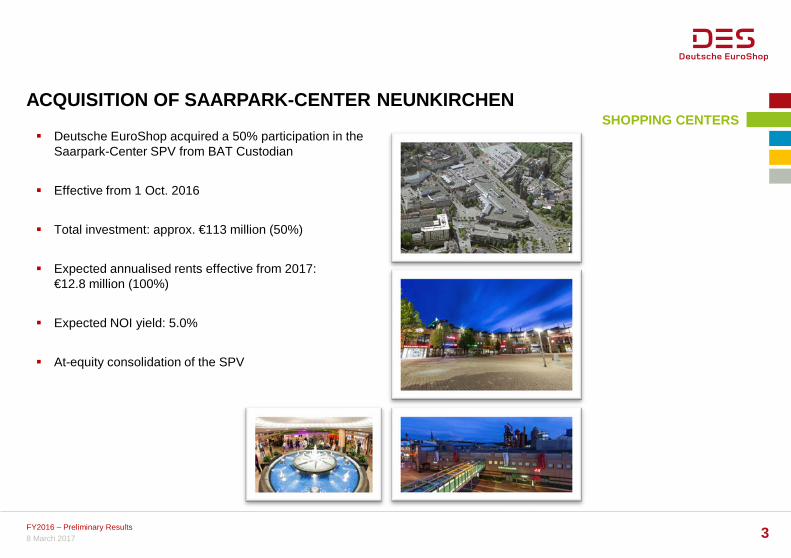
ACQUISITION OF SAARPARK-CENTER NEUNKIRCHEN SHOPPING CENTERS
8 March 2017 FY2016 – Preliminary Results
Deutsche EuroShop acquired a 50% participation in the Saarpark-Center SPV from BAT Custodian
Effective from 1 Oct. 2016
Total investment: approx. €113 million (50%)
Expected annualised rents effective from 2017: €12.8 million (100%)
Expected NOI yield: 5.0%
At-equity consolidation of the SPV
3
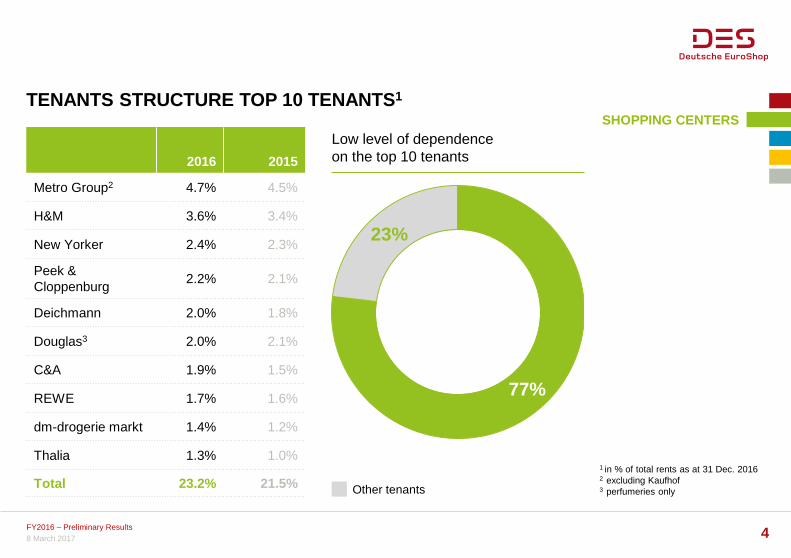
TENANTS STRUCTURE TOP 10 TENANTS1
1 in % of total rents as at 31 Dec. 2016 2 excluding Kaufhof 3 perfumeries only
SHOPPING CENTERS
2016 2015
Metro Group2 4.7% 4.5%
H&M 3.6% 3.4%
New Yorker 2.4% 2.3%
Peek & Cloppenburg
2.2% 2.1%
Deichmann 2.0% 1.8%
Douglas3 2.0% 2.1%
C&A 1.9% 1.5%
REWE 1.7% 1.6%
dm-drogerie markt 1.4% 1.2%
Thalia 1.3% 1.0%
Total 23.2% 21.5%
77%
23%
Other tenants
FY2016 – Preliminary Results 4
Low level of dependence on the top 10 tenants
8 March 2017
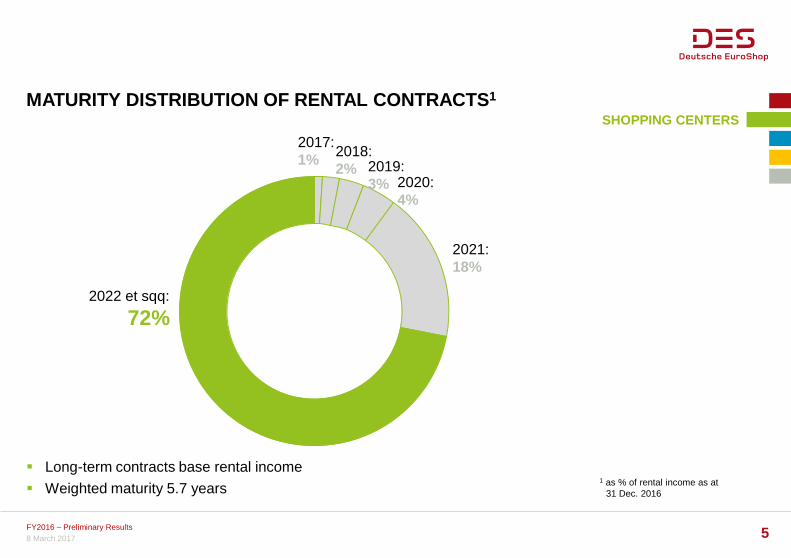
MATURITY DISTRIBUTION OF RENTAL CONTRACTS1
1 as % of rental income as at 31 Dec. 2016
SHOPPING CENTERS
2022 et sqq:
72%
2021: 18%
2020: 4%
2019: 3%
2018: 2%
2017: 1%
FY2016 – Preliminary Results 5
Long-term contracts base rental income
Weighted maturity 5.7 years
8 March 2017
205.1
Target Actual Target Actual
178.6
Target Actual
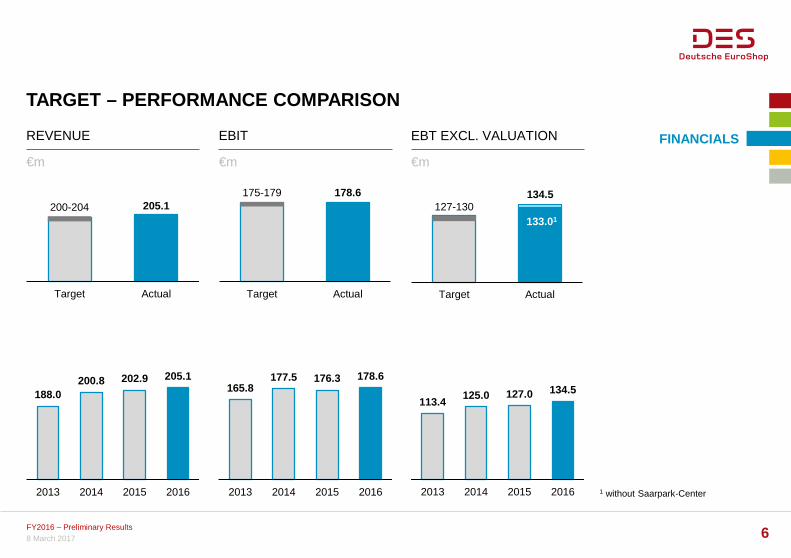
TARGET – PERFORMANCE COMPARISON
1 without Saarpark-Center
FINANCIALS REVENUE EBIT EBT EXCL. VALUATION
€m €m €m
200-204 175-179
127-130
188.0 200.8 202.9 205.1
2013 2014 2015 2016
113.4 125.0 127.0 134.5
2013 2014 2015 2016
165.8 177.5 176.3 178.6
2013 2014 2015 2016
FY2016 – Preliminary Results 6 8 March 2017
134.5
133.01
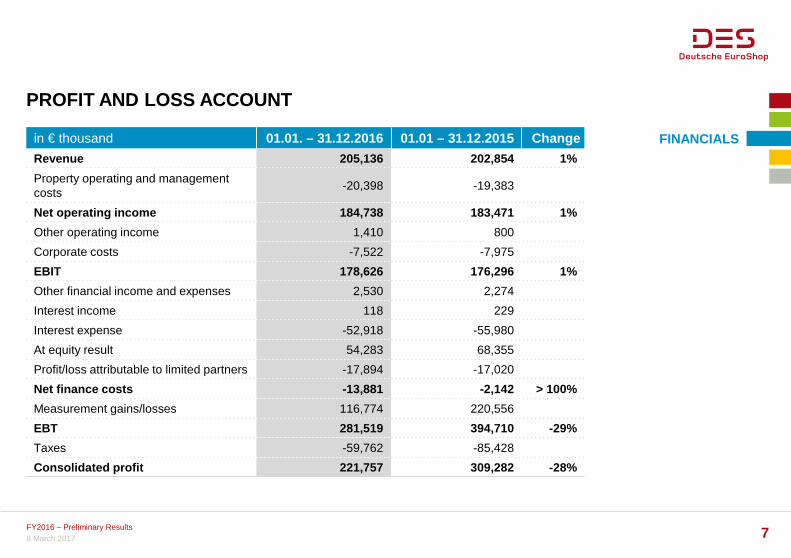
PROFIT AND LOSS ACCOUNT
FINANCIALS in € thousand 01.01. – 31.12.2016 01.01 – 31.12.2015 Change
Revenue 205,136 202,854 1%
Property operating and management costs
-20,398 -19,383
Net operating income 184,738 183,471 1%
Other operating income 1,410 800
Corporate costs -7,522 -7,975
EBIT 178,626 176,296 1%
Other financial income and expenses 2,530 2,274
Interest income 118 229
Interest expense -52,918 -55,980
At equity result 54,283 68,355
Profit/loss attributable to limited partners -17,894 -17,020
Net finance costs -13,881 -2,142 > 100%
Measurement gains/losses 116,774 220,556
EBT 281,519 394,710 -29%
Taxes -59,762 -85,428
Consolidated profit 221,757 309,282 -28%
FY2016 – Preliminary Results 7 8 March 2017
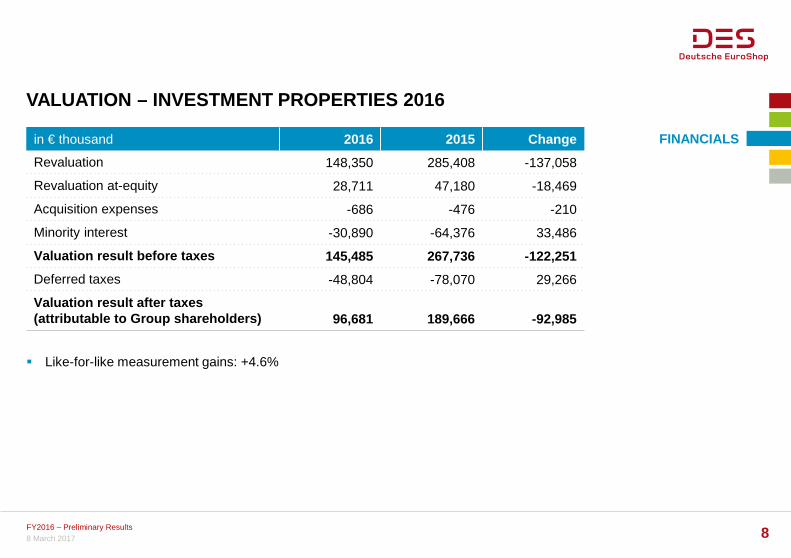
VALUATION – INVESTMENT PROPERTIES 2016
FINANCIALS
Like-for-like measurement gains: +4.6%
FY2016 – Preliminary Results 8 8 March 2017
in € thousand 2016 2015 Change
Revaluation 148,350 285,408 -137,058
Revaluation at-equity 28,711 47,180 -18,469
Acquisition expenses -686 -476 -210
Minority interest -30,890 -64,376 33,486
Valuation result before taxes 145,485 267,736 -122,251
Deferred taxes -48,804 -78,070 29,266
Valuation result after taxes (attributable to Group shareholders) 96,681 189,666 -92,985
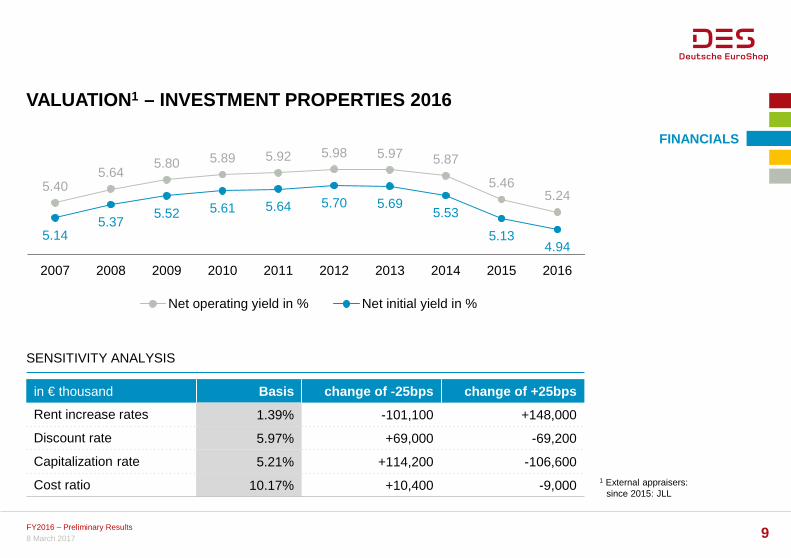
5.40 5.64
5.80 5.89 5.92 5.98 5.97 5.87
5.46 5.24
5.14 5.37
5.52 5.61 5.64 5.70 5.69 5.53
5.13 4.94
2007 2008 2009 2010 2011 2012 2013 2014 2015 2016
Net operating yield in % Net initial yield in %
VALUATION1 – INVESTMENT PROPERTIES 2016
1 External appraisers: since 2015: JLL
SENSITIVITY ANALYSIS
in € thousand Basis change of -25bps change of +25bps
Rent increase rates 1.39% -101,100 +148,000
Discount rate 5.97% +69,000 -69,200
Capitalization rate 5.21% +114,200 -106,600
Cost ratio 10.17% +10,400 -9,000
FINANCIALS
FY2016 – Preliminary Results 9 8 March 2017
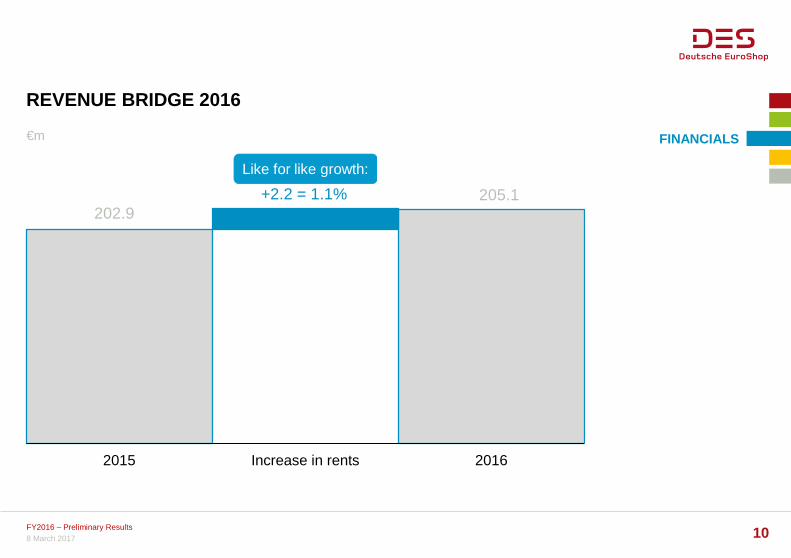
202.9 +2.2 = 1.1% 205.1
2015 Increase in rents 2016
REVENUE BRIDGE 2016
FINANCIALS €m
Like for like growth:
FY2016 – Preliminary Results 10 8 March 2017
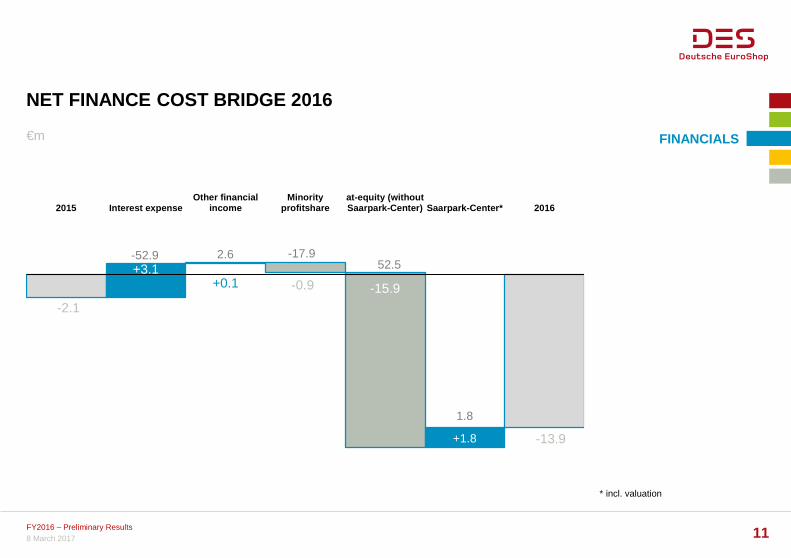
NET FINANCE COST BRIDGE 2016
* incl. valuation
FINANCIALS €m
-0.9
-13.9
+3.1 +0.1 -15.9
2015 Interest expenseOther financial
incomeMinority
profitshareat-equity (withoutSaarpark-Center) Saarpark-Center* 2016
-52.9
-2.1
2.6
FY2016 – Preliminary Results 11 8 March 2017
52.5 -17.9
1.8
+1.8
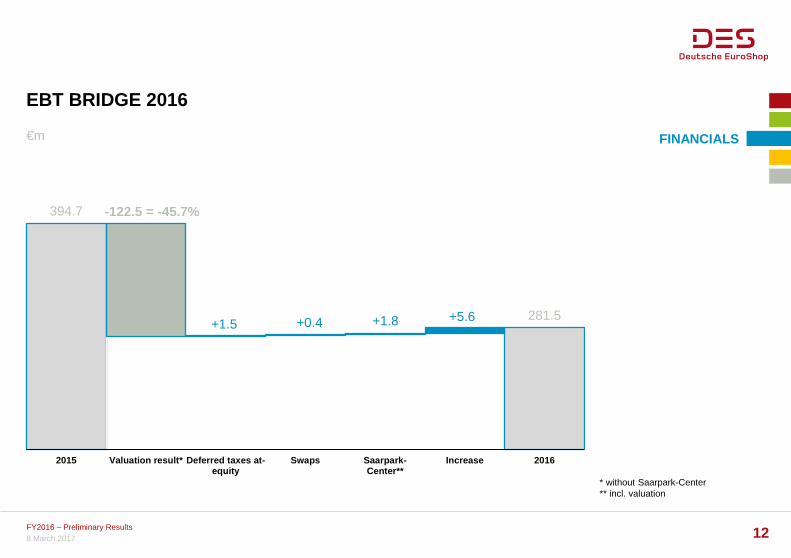
EBT BRIDGE 2016
* without Saarpark-Center ** incl. valuation
€m
394.7 -122.5 = -45.7%
+5.6 +0.4 +1.8 281.5
2015 Valuation result* Deferred taxes at-equity
Swaps Saarpark-Center**
Increase 2016
FINANCIALS
FY2016 – Preliminary Results 12 8 March 2017
+1.5
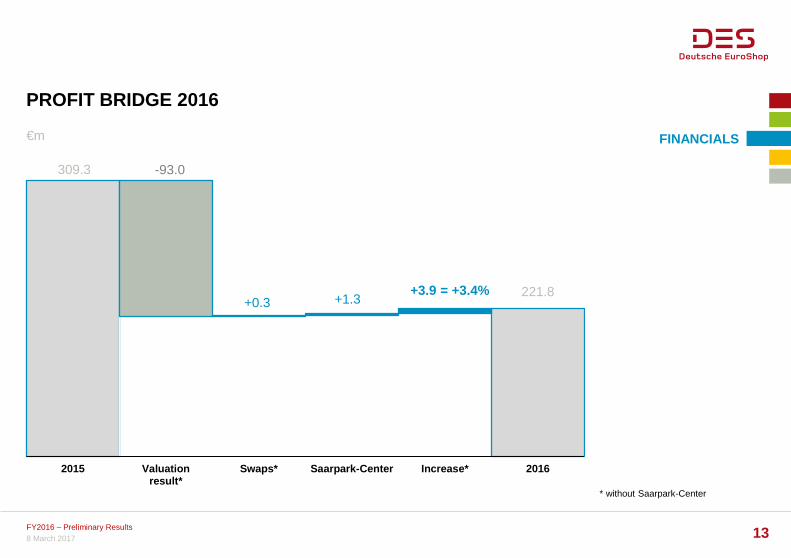
PROFIT BRIDGE 2016
* without Saarpark-Center
€m FINANCIALS
309.3
+1.3 +0.3 221.8
-93.0
+3.9 = +3.4%
2015 Valuationresult*
Swaps* Saarpark-Center Increase* 2016
FY2016 – Preliminary Results 13 8 March 2017
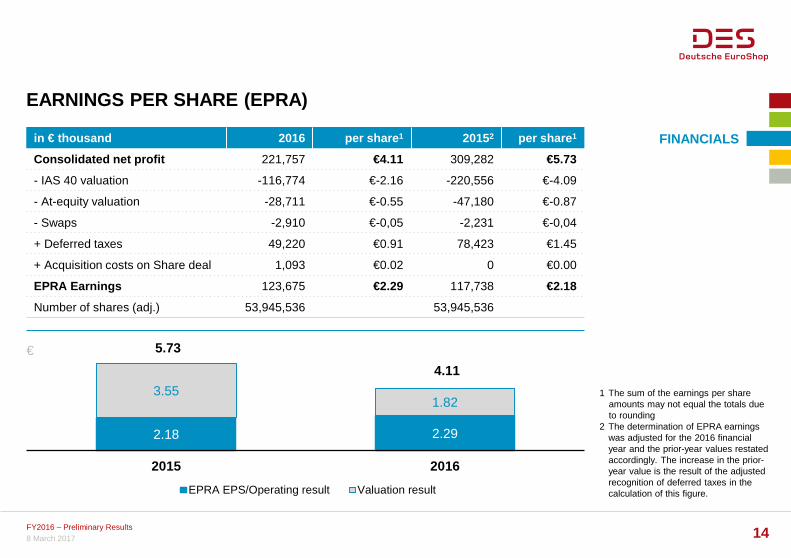
EARNINGS PER SHARE (EPRA)
1 The sum of the earnings per share amounts may not equal the totals due to rounding
2 The determination of EPRA earnings was adjusted for the 2016 financial year and the prior-year values restated accordingly. The increase in the prior-year value is the result of the adjusted recognition of deferred taxes in the calculation of this figure.
2.18 2.29
3.55 1.82
2015 2016
EPRA EPS/Operating result Valuation result
€
FINANCIALS
FY2016 – Preliminary Results 14 8 March 2017
in € thousand 2016 per share1 20152 per share1
Consolidated net profit 221,757 €4.11 309,282 €5.73
- IAS 40 valuation -116,774 €-2.16 -220,556 €-4.09
- At-equity valuation -28,711 €-0.55 -47,180 €-0.87
- Swaps -2,910 €-0,05 -2,231 €-0,04
+ Deferred taxes 49,220 €0.91 78,423 €1.45
+ Acquisition costs on Share deal 1,093 €0.02 0 €0.00
EPRA Earnings 123,675 €2.29 117,738 €2.18
Number of shares (adj.) 53,945,536 53,945,536
5.73
4.11
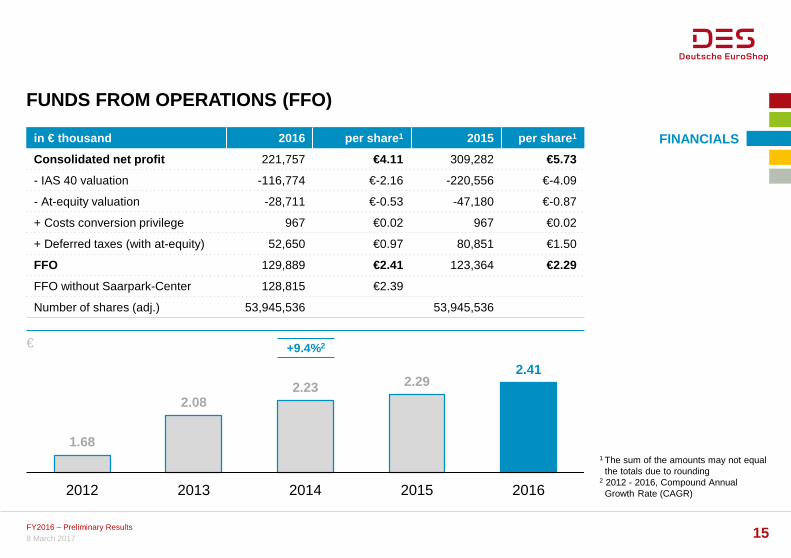
FUNDS FROM OPERATIONS (FFO)
1 The sum of the amounts may not equal the totals due to rounding 2 2012 - 2016, Compound Annual Growth Rate (CAGR)
FINANCIALS
€
1.68
2.08 2.23 2.29
2.41
2012 2013 2014 2015 2016
FY2016 – Preliminary Results 15 8 March 2017
+9.4%2
in € thousand 2016 per share1 2015 per share1
Consolidated net profit 221,757 €4.11 309,282 €5.73
- IAS 40 valuation -116,774 €-2.16 -220,556 €-4.09
- At-equity valuation -28,711 €-0.53 -47,180 €-0.87
+ Costs conversion privilege 967 €0.02 967 €0.02
+ Deferred taxes (with at-equity) 52,650 €0.97 80,851 €1.50
FFO 129,889 €2.41 123,364 €2.29
FFO without Saarpark-Center 128,815 €2.39
Number of shares (adj.) 53,945,536 53,945,536
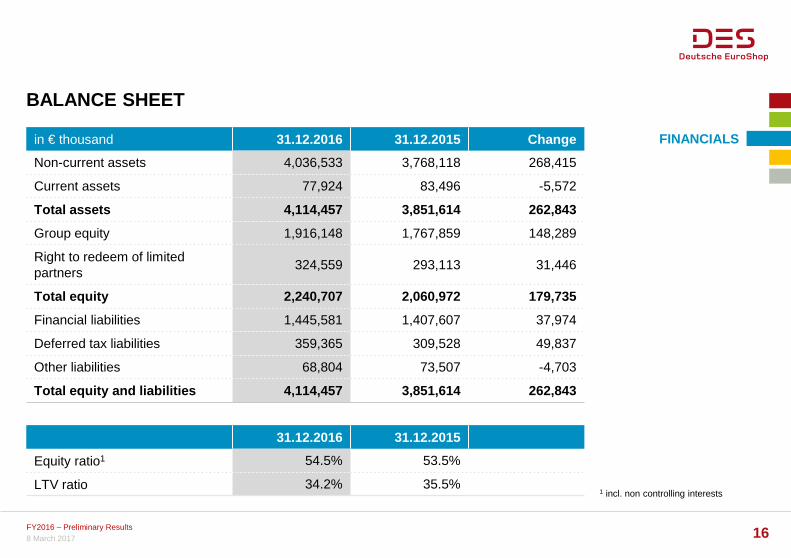
BALANCE SHEET
1 incl. non controlling interests
FINANCIALS in € thousand 31.12.2016 31.12.2015 Change
Non-current assets 4,036,533 3,768,118 268,415
Current assets 77,924 83,496 -5,572
Total assets 4,114,457 3,851,614 262,843
Group equity 1,916,148 1,767,859 148,289
Right to redeem of limited partners
324,559 293,113 31,446
Total equity 2,240,707 2,060,972 179,735
Financial liabilities 1,445,581 1,407,607 37,974
Deferred tax liabilities 359,365 309,528 49,837
Other liabilities 68,804 73,507 -4,703
Total equity and liabilities 4,114,457 3,851,614 262,843
31.12.2016 31.12.2015
Equity ratio1 54.5% 53.5%
LTV ratio 34.2% 35.5%
FY2016 – Preliminary Results 16 8 March 2017
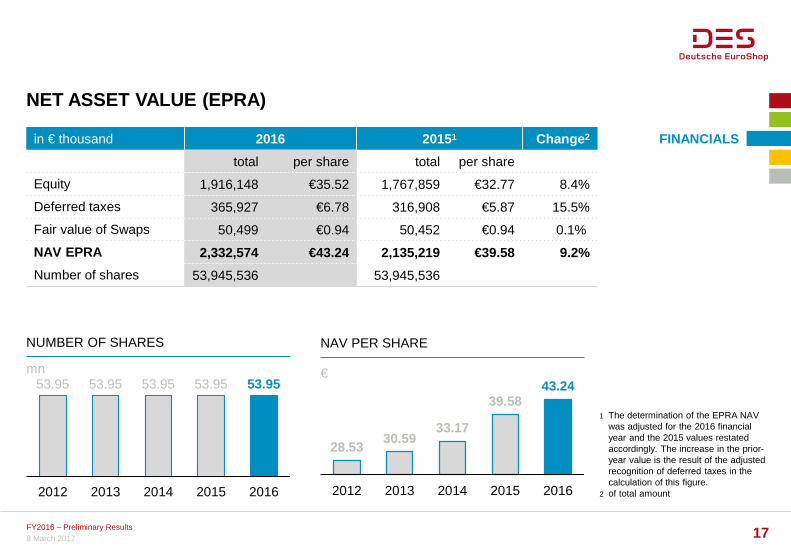
28.53 30.59
33.17
39.58 43.24
2012 2013 2014 2015 2016
NET ASSET VALUE (EPRA)
FINANCIALS
NUMBER OF SHARES
mn
NAV PER SHARE
€ 53.95 53.95 53.95 53.95 53.95
2012 2013 2014 2015 2016
FY2016 – Preliminary Results 17 8 March 2017
in € thousand 2016 20151 Change2
total per share total per share
Equity 1,916,148 €35.52 1,767,859 €32.77 8.4%
Deferred taxes 365,927 €6.78 316,908 €5.87 15.5%
Fair value of Swaps 50,499 €0.94 50,452 €0.94 0.1%
NAV EPRA 2,332,574 €43.24 2,135,219 €39.58 9.2%
Number of shares 53,945,536 53,945,536
1 The determination of the EPRA NAV was adjusted for the 2016 financial year and the 2015 values restated accordingly. The increase in the prior-year value is the result of the adjusted recognition of deferred taxes in the calculation of this figure.
2 of total amount
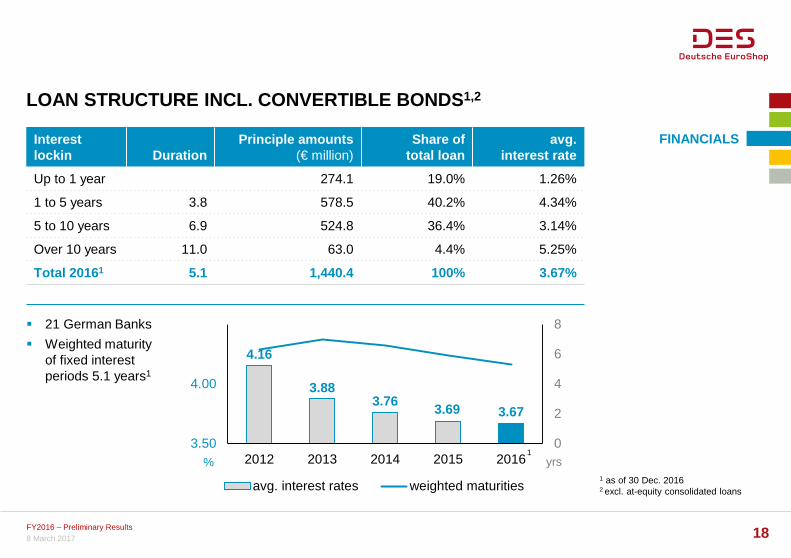
LOAN STRUCTURE INCL. CONVERTIBLE BONDS1,2
1 as of 30 Dec. 2016 2 excl. at-equity consolidated loans
FINANCIALS Interest lockin Duration
Principle amounts (€ million)
Share of total loan
avg. interest rate
Up to 1 year 274.1 19.0% 1.26%
1 to 5 years 3.8 578.5 40.2% 4.34%
5 to 10 years 6.9 524.8 36.4% 3.14%
Over 10 years 11.0 63.0 4.4% 5.25%
Total 20161 5.1 1,440.4 100% 3.67%
4.16
3.88 3.76
3.69 3.67
0
2
4
6
8
3.50
4.00
4.50
2012 2013 2014 2015 2016
avg. interest rates weighted maturities
yrs %
21 German Banks
Weighted maturity of fixed interest periods 5.1 years1
FY2016 – Preliminary Results 18 8 March 2017
1
in € million
End of fixed interest periods respectively
expiring loans Avg. interest
rate DES‘
share
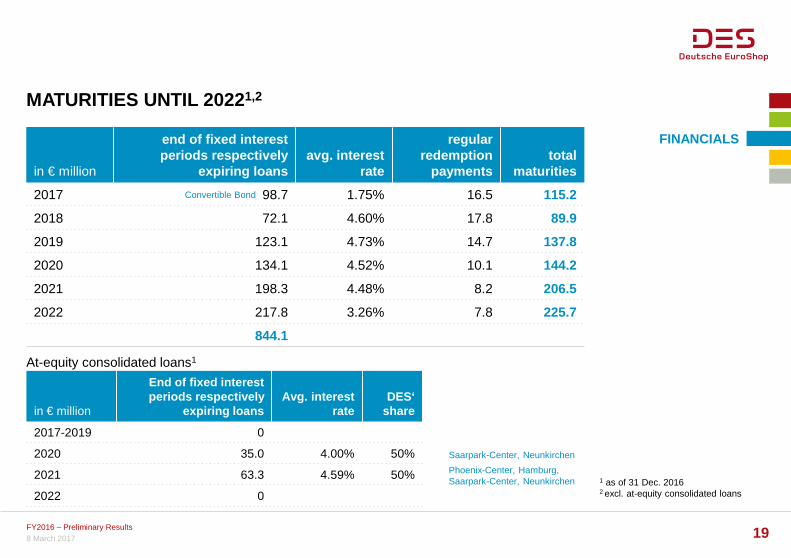
2017-2019 0
2020 35.0 4.00% 50%
2021 63.3 4.59% 50%
2022 0
MATURITIES UNTIL 20221,2
1 as of 31 Dec. 2016 2 excl. at-equity consolidated loans
in € million
end of fixed interest periods respectively
expiring loans avg. interest
rate
regular redemption
payments total
maturities
2017 98.7 1.75% 16.5 115.2
2018 72.1 4.60% 17.8 89.9
2019 123.1 4.73% 14.7 137.8
2020 134.1 4.52% 10.1 144.2
2021 198.3 4.48% 8.2 206.5
2022 217.8 3.26% 7.8 225.7
844.1
FINANCIALS
FY2016 – Preliminary Results 19 8 March 2017
At-equity consolidated loans1
Phoenix-Center, Hamburg, Saarpark-Center, Neunkirchen
Saarpark-Center, Neunkirchen
Convertible Bond
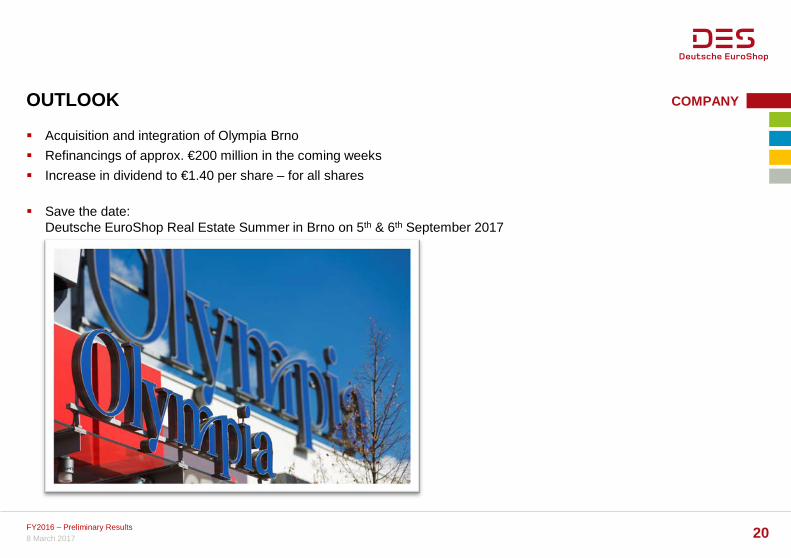
OUTLOOK COMPANY
FY2016 – Preliminary Results 20 8 March 2017
Acquisition and integration of Olympia Brno
Refinancings of approx. €200 million in the coming weeks
Increase in dividend to €1.40 per share – for all shares
Save the date: Deutsche EuroShop Real Estate Summer in Brno on 5th & 6th September 2017
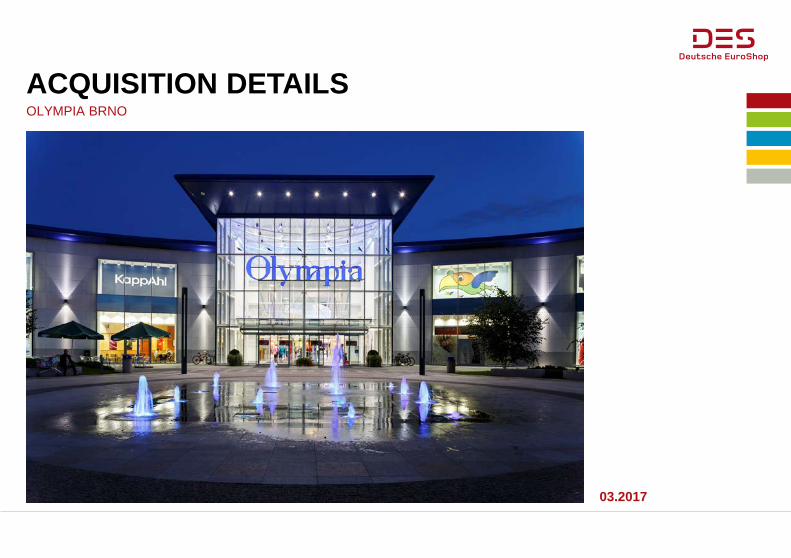
03.2017
ACQUISITION DETAILS OLYMPIA BRNO
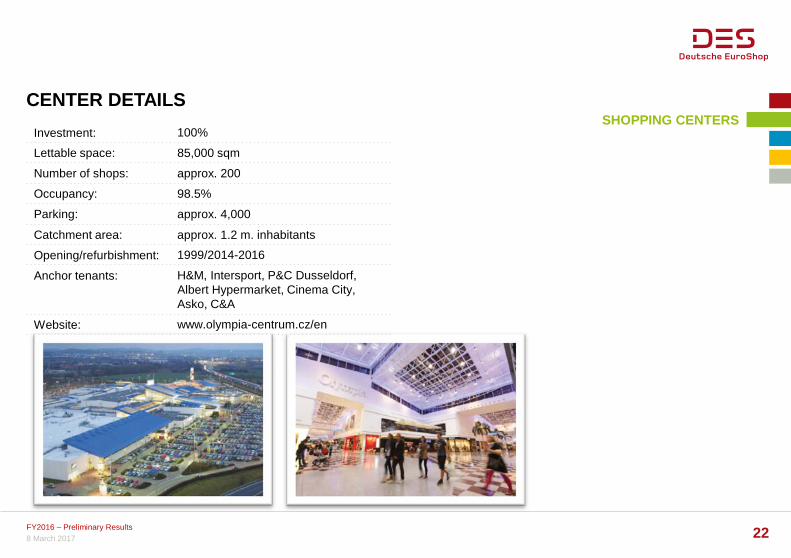
CENTER DETAILS SHOPPING CENTERS
8 March 2017 FY2016 – Preliminary Results 22
Investment: 100%
Lettable space: 85,000 sqm
Number of shops: approx. 200
Occupancy: 98.5%
Parking: approx. 4,000
Catchment area: approx. 1.2 m. inhabitants
Opening/refurbishment: 1999/2014-2016
Anchor tenants: H&M, Intersport, P&C Dusseldorf, Albert Hypermarket, Cinema City, Asko, C&A
Website: www.olympia-centrum.cz/en
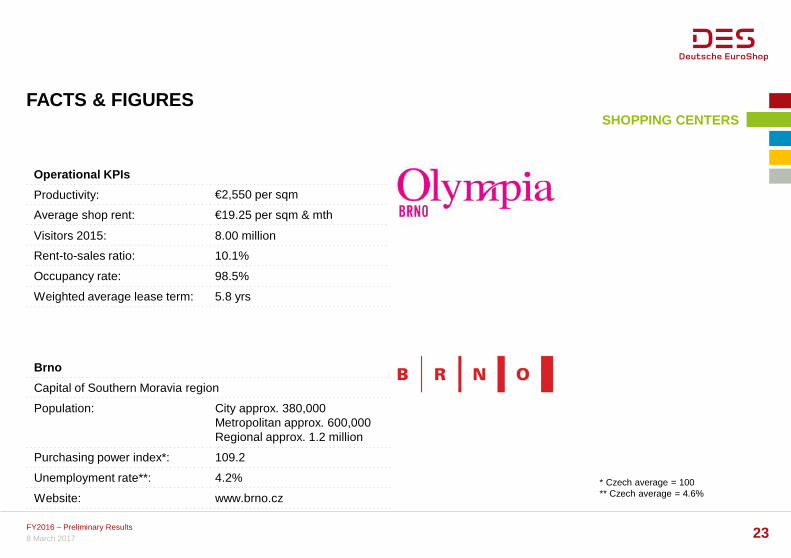
FACTS & FIGURES SHOPPING CENTERS
8 March 2017 FY2016 – Preliminary Results 23
* Czech average = 100 ** Czech average = 4.6%
Operational KPIs
Productivity: €2,550 per sqm
Average shop rent: €19.25 per sqm & mth
Visitors 2015: 8.00 million
Rent-to-sales ratio: 10.1%
Occupancy rate: 98.5%
Weighted average lease term: 5.8 yrs
Brno
Capital of Southern Moravia region
Population: City approx. 380,000 Metropolitan approx. 600,000 Regional approx. 1.2 million
Purchasing power index*: 109.2
Unemployment rate**: 4.2%
Website: www.brno.cz
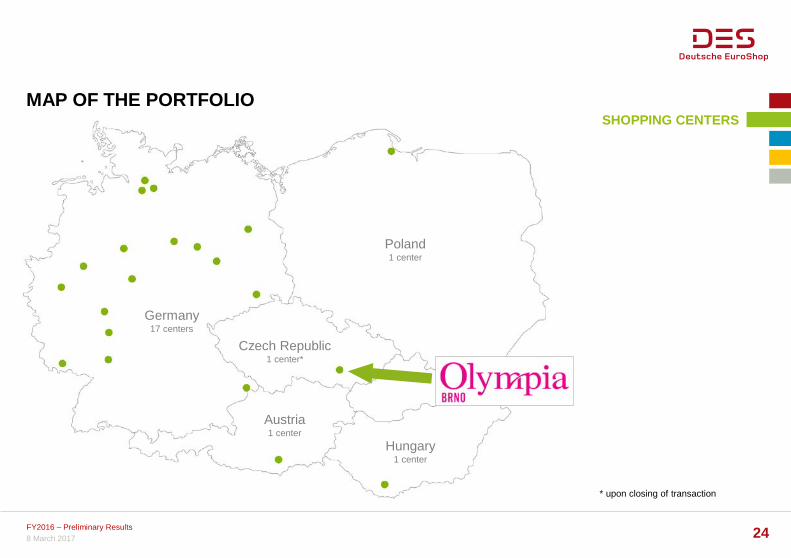
MAP OF THE PORTFOLIO SHOPPING CENTERS
Germany 17 centers
Austria 1 center
Poland 1 center
Hungary 1 center
8 March 2017 FY2016 – Preliminary Results 24
Czech Republic 1 center*
* upon closing of transaction
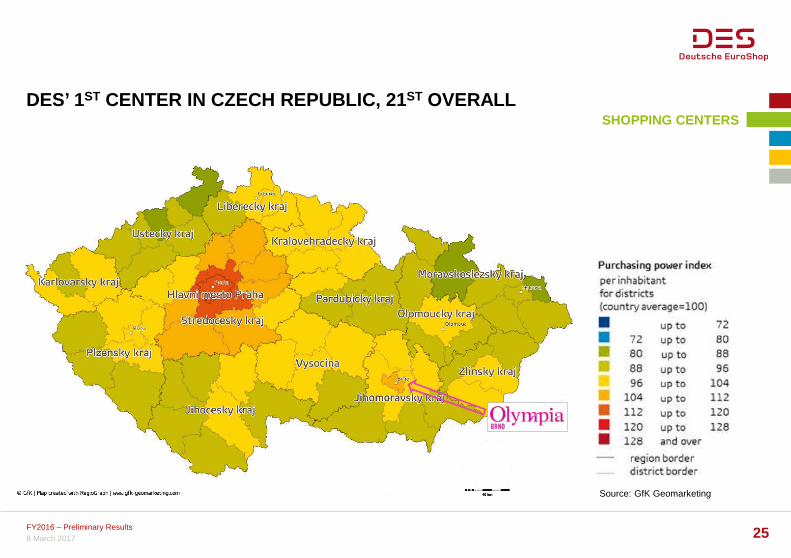
Source: GfK Geomarketing
DES’ 1ST CENTER IN CZECH REPUBLIC, 21ST OVERALL SHOPPING CENTERS
8 March 2017 FY2016 – Preliminary Results 25
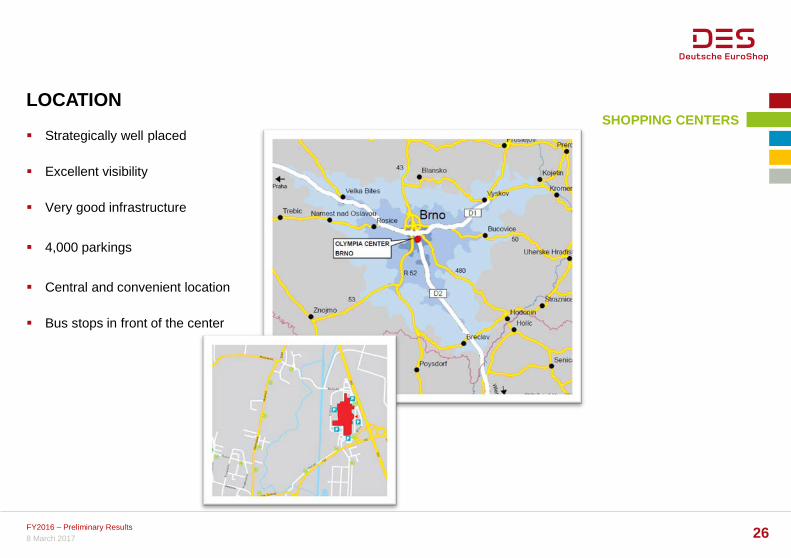
LOCATION SHOPPING CENTERS
8 March 2017 FY2016 – Preliminary Results 26
Strategically well placed
Excellent visibility
Very good infrastructure
4,000 parkings
Central and convenient location
Bus stops in front of the center
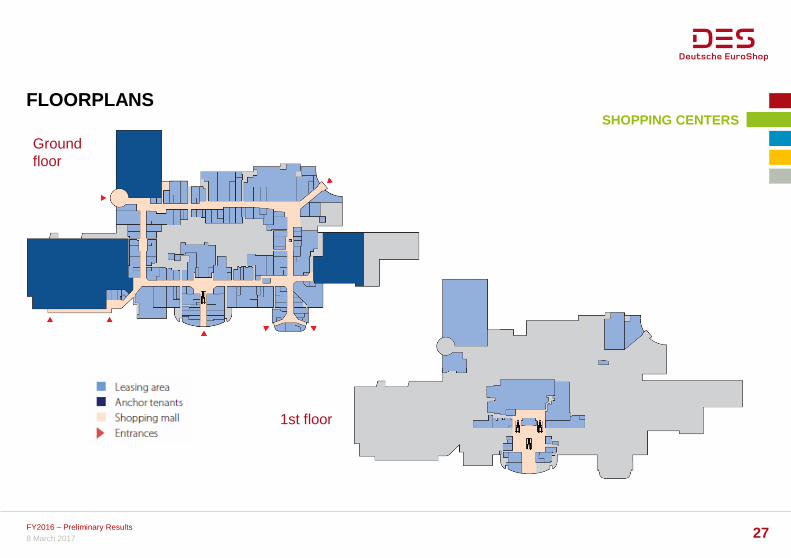
FLOORPLANS SHOPPING CENTERS
8 March 2017 FY2016 – Preliminary Results 27
Ground floor
1st floor
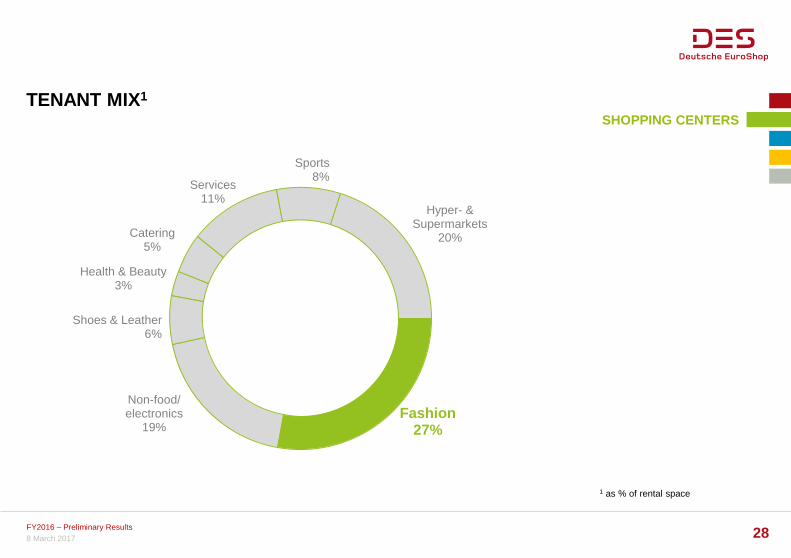
Fashion 27%
Non-food/ electronics
19%
Hyper- & Supermarkets
20%
Health & Beauty 3%
Catering 5%
Services 11%
Shoes & Leather 6%
Sports 8%
TENANT MIX1
1 as % of rental space
SHOPPING CENTERS
8 March 2017 FY2016 – Preliminary Results 28
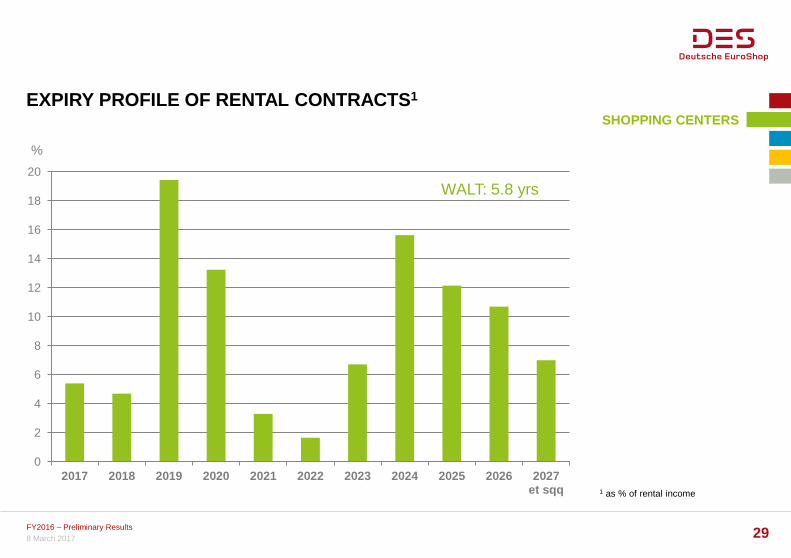
EXPIRY PROFILE OF RENTAL CONTRACTS1
1 as % of rental income
SHOPPING CENTERS
FY2016 – Preliminary Results 29 8 March 2017
0
2
4
6
8
10
12
14
16
18
20
2017 2018 2019 2020 2021 2022 2023 2024 2025 2026 2027et sqq
WALT: 5.8 yrs
%
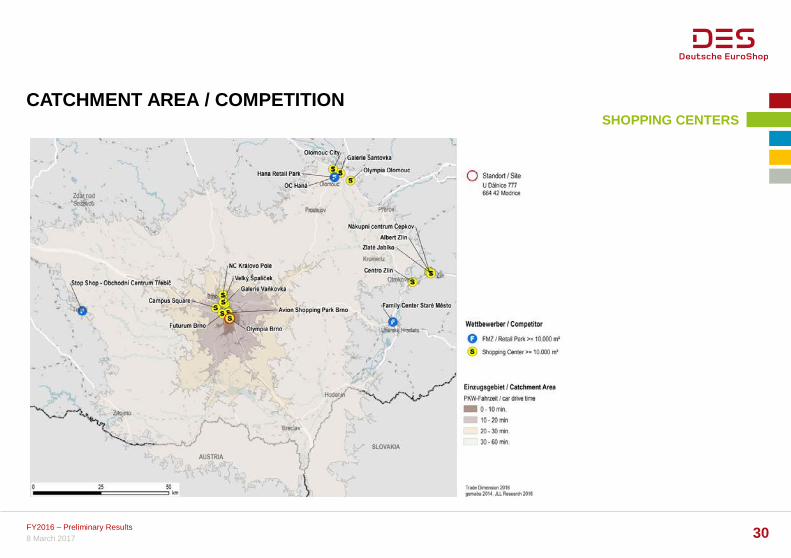
CATCHMENT AREA / COMPETITION SHOPPING CENTERS
8 March 2017 FY2016 – Preliminary Results 30
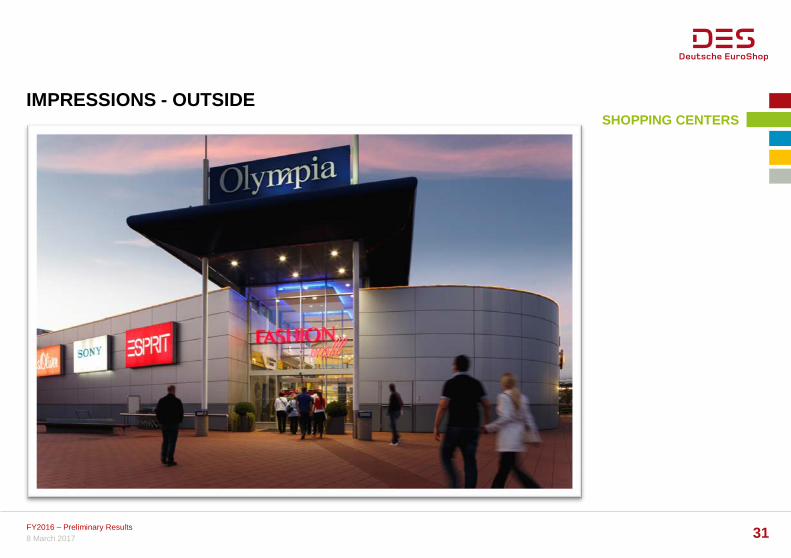
IMPRESSIONS - OUTSIDE SHOPPING CENTERS
8 March 2017 FY2016 – Preliminary Results 31
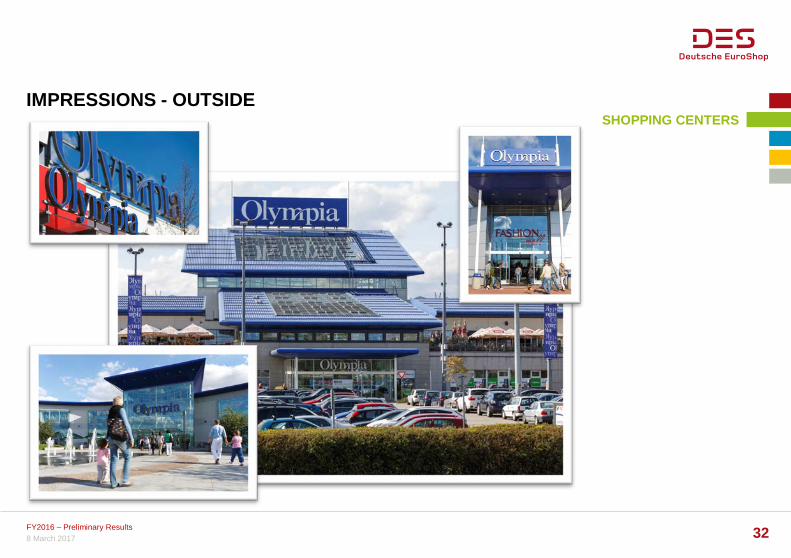
IMPRESSIONS - OUTSIDE SHOPPING CENTERS
8 March 2017 FY2016 – Preliminary Results 32
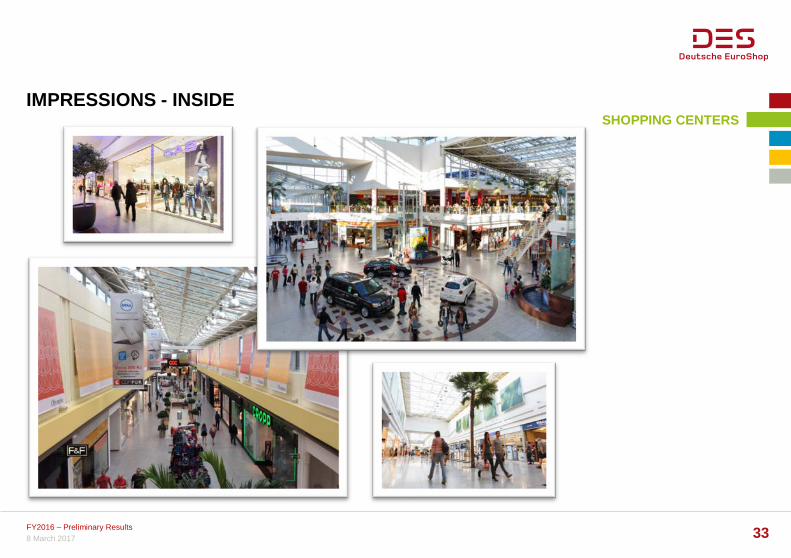
IMPRESSIONS - INSIDE SHOPPING CENTERS
8 March 2017 FY2016 – Preliminary Results 33
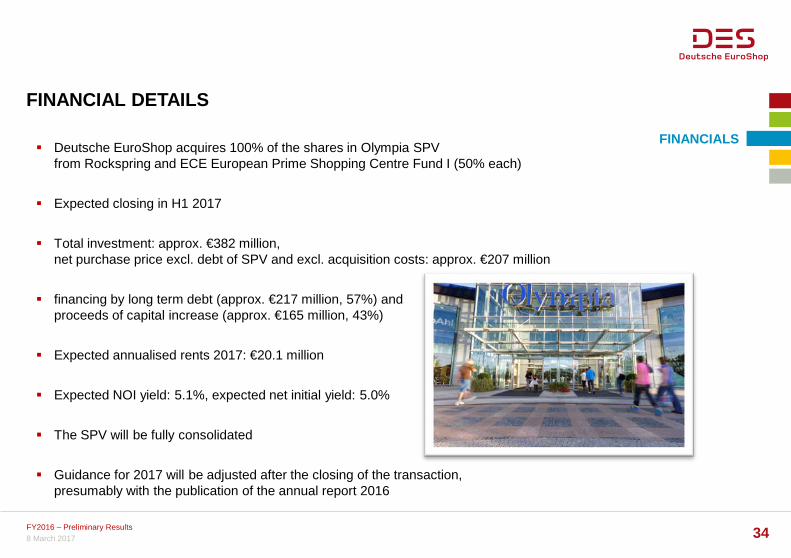
FINANCIAL DETAILS
FINANCIALS
8 March 2017 FY2016 – Preliminary Results 34
Deutsche EuroShop acquires 100% of the shares in Olympia SPV from Rockspring and ECE European Prime Shopping Centre Fund I (50% each)
Expected closing in H1 2017
Total investment: approx. €382 million, net purchase price excl. debt of SPV and excl. acquisition costs: approx. €207 million
financing by long term debt (approx. €217 million, 57%) and proceeds of capital increase (approx. €165 million, 43%)
Expected annualised rents 2017: €20.1 million
Expected NOI yield: 5.1%, expected net initial yield: 5.0%
The SPV will be fully consolidated
Guidance for 2017 will be adjusted after the closing of the transaction, presumably with the publication of the annual report 2016
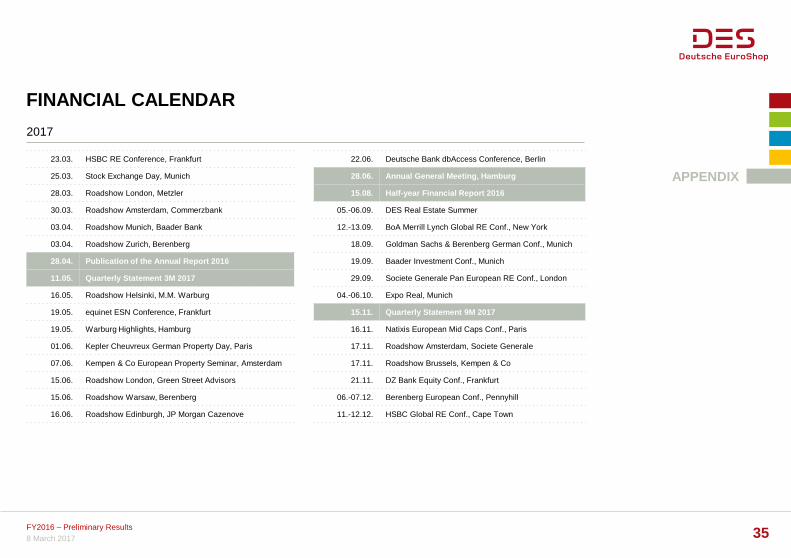
FINANCIAL CALENDAR
APPENDIX
2017
FY2016 – Preliminary Results 35 8 March 2017
23.03. HSBC RE Conference, Frankfurt
25.03. Stock Exchange Day, Munich
28.03. Roadshow London, Metzler
30.03. Roadshow Amsterdam, Commerzbank
03.04. Roadshow Munich, Baader Bank
03.04. Roadshow Zurich, Berenberg
28.04. Publication of the Annual Report 2016
11.05. Quarterly Statement 3M 2017
16.05. Roadshow Helsinki, M.M. Warburg
19.05. equinet ESN Conference, Frankfurt
19.05. Warburg Highlights, Hamburg
01.06. Kepler Cheuvreux German Property Day, Paris
07.06. Kempen & Co European Property Seminar, Amsterdam
15.06. Roadshow London, Green Street Advisors
15.06. Roadshow Warsaw, Berenberg
16.06. Roadshow Edinburgh, JP Morgan Cazenove
22.06. Deutsche Bank dbAccess Conference, Berlin
28.06. Annual General Meeting, Hamburg
15.08. Half-year Financial Report 2016
05.-06.09. DES Real Estate Summer
12.-13.09. BoA Merrill Lynch Global RE Conf., New York
18.09. Goldman Sachs & Berenberg German Conf., Munich
19.09. Baader Investment Conf., Munich
29.09. Societe Generale Pan European RE Conf., London
04.-06.10. Expo Real, Munich
15.11. Quarterly Statement 9M 2017
16.11. Natixis European Mid Caps Conf., Paris
17.11. Roadshow Amsterdam, Societe Generale
17.11. Roadshow Brussels, Kempen & Co
21.11. DZ Bank Equity Conf., Frankfurt
06.-07.12. Berenberg European Conf., Pennyhill
11.-12.12. HSBC Global RE Conf., Cape Town
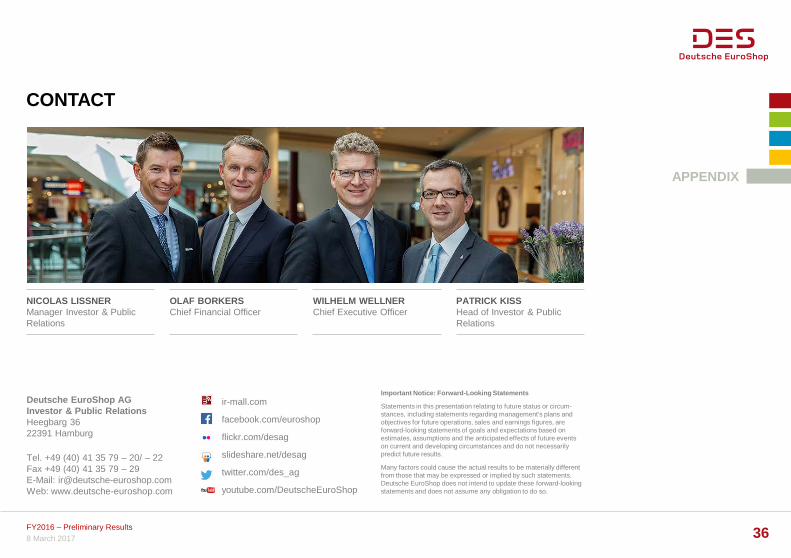
CONTACT
APPENDIX
NICOLAS LISSNER Manager Investor & Public Relations
OLAF BORKERS Chief Financial Officer
WILHELM WELLNER Chief Executive Officer
PATRICK KISS Head of Investor & Public Relations
Deutsche EuroShop AG Investor & Public Relations Heegbarg 36 22391 Hamburg
Tel. +49 (40) 41 35 79 – 20/ – 22 Fax +49 (40) 41 35 79 – 29 E-Mail: [email protected] Web: www.deutsche-euroshop.com
ir-mall.com
facebook.com/euroshop
flickr.com/desag
slideshare.net/desag
twitter.com/des_ag
youtube.com/DeutscheEuroShop
Important Notice: Forward-Looking Statements
Statements in this presentation relating to future status or circum-stances, including statements regarding management’s plans and objectives for future operations, sales and earnings figures, are forward-looking statements of goals and expectations based on estimates, assumptions and the anticipated effects of future events on current and developing circumstances and do not necessarily predict future results.
Many factors could cause the actual results to be materially different from those that may be expressed or implied by such statements. Deutsche EuroShop does not intend to update these forward-looking statements and does not assume any obligation to do so.
8 March 2017 FY2016 – Preliminary Results 36