Embed Size (px)
Citation preview

1
SPROTT – STANSBERRY 2015 NATURAL RESOURCE SYMPOSIUM
July 28 - 31, 2015

2
CAUTIONARY STATEMENT
Forward Looking InformationThis Presentation contains “forward-looking information” and “forward looking statements” within the meaning of applicable Canadian and United States securities legislation. Forward-looking information may include, but is not limited to, the anticipated production and developments in our operations in future periods, information with respect to our planned exploration and development activities, the adequacy of our financial resources, the estimation of mineral reserves and resources including the 2013 Valley of the Kings Mineral Resource estimate, realization of mineral reserve and resource estimates and timing of development of our Brucejack Project, costs and timing of future exploration, results of future exploration and drilling, production and processing estimates, capital and operating cost estimates, timelines and similar statements relating to the economic viability of the Brucejack Project, timing and receipt of approvals, consents and permits under applicable legislation, our executive compensation approach and practice, the composition of our board of directors and committees and adequacy of financial resources. Wherever possible, words such as “plans”, “expects”, “projects”, “assumes”, “budget”, “strategy”, “scheduled”, “estimates”, “forecasts”, “anticipates”, “believes”, “intends”, “targets” and similar expressions or statements that certain actions, events or results “may”, “could”, “would”, “might” or “will” be taken, occur or be achieved, or the negative forms of any of these terms and similar expressions, have been used to identify forward-looking statements and information. Statements concerning mineral reserve and resource estimates may also be deemed to constitute forward-looking information to the extent that they involve estimates of the mineralization that will be encountered if the property is developed. Any statements that express or involve discussions with respect to predictions, expectations, beliefs, plans, projections, objectives, assumptions or future events or performance are not statements of historical fact and may be forward-looking information. Forward-looking information is subject to a variety of known and unknown risks, uncertainties and other factors that could cause actual events or results to differ from those expressed or implied by the forward-looking information, including, without limitation, those risks identified in our Annual Information Form dated March 31, 2014 filed on SEDAR at www.sedar.com and in the United States on Form 40-F through EDGAR at the SEC’s website at www.sec.gov. Forward-looking information is based on the expectations and opinions of our management on the date the statements are made. The assumptions used in the preparation of such statements, although considered reasonable at the time of preparation, may prove to be imprecise. We do not assume any obligation to update forward-looking information, whether as a result of new information, future events or otherwise, other than as required by applicable law. For the reasons set forth above, prospective investors should not place undue reliance on forward-looking information. National Instrument 43-101Technical and scientific information contained herein relating to the Projects is derived from National Instrument 43-101 (“NI 43-101”) compliant technical reports (“Reports”) “Mineral Resources Update Technical Report” dated December 19, 2013 and “Feasibility Study and Technical Report on the BrucejackProject, Stewart, BC” dated June 19, 2014. We have filed the Reports and Update under our profile at www.sedar.com. Technical and scientific information not contained within the Reports for the Projects have been prepared under the supervision of Mr. Kenneth C. McNaughton, P.Eng. and Ian Chang, P.Eng., each of whom is an independent “qualified person” under NI 43-101.This presentation uses the terms “measured resources”, “indicated resources” (together “M&I”) and “inferred resources”. Although these terms are recognized and required by Canadian regulations (under NI 43-101), the United States Securities and Exchange Commission does not recognize them. Mineral resources which are not mineral reserves do not have demonstrated economic viability. The estimate of mineral resources may be materially affected by environmental, permitting, legal, title, taxation, socio-political, marketing, or other relevant issues. There is no guarantee that all or any part of the mineral resource will be converted into mineral reserves.In addition, “inferred resources” have a great amount of uncertainty as to their existence, and economic and legal feasibility. It cannot be assumed that all or any part of an inferred mineral resource will ever be upgraded to a higher category. Under Canadian rules, estimates of inferred mineral resources may not form the basis of feasibility or pre feasibility studies, or economic studies, except for a Preliminary Assessment as defined under NI 43-101. Investors are cautioned not to assume that part or all of an inferred resource exists, or is economically or legally mineable. CurrencyUnless otherwise indicated, all dollar values herein are in Canadian $.

3
High-grade underground gold project
Commercial production target 2017
Located in British Columbia, Canada
V A L U E T H R O U G H G O L D
4
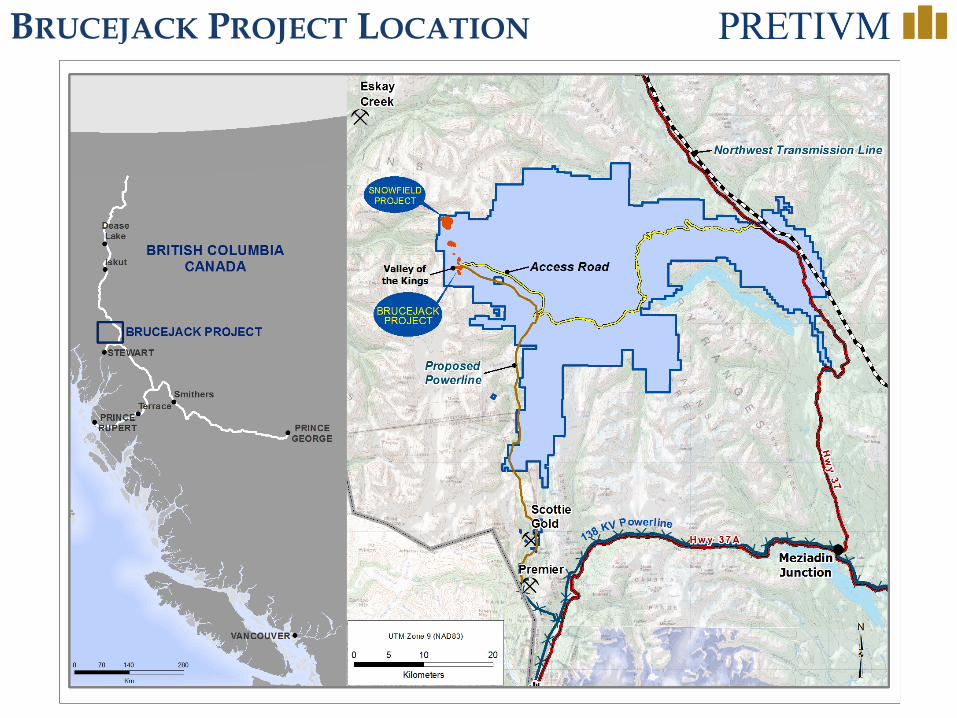
BRUCEJACK PROJECT LOCATION

5
HIGH-GRADE GOLD RESERVES(1,2)
Valley of the Kings
West Zone
Category Tonnes(mil)
Gold(g/t)
Silver(g/t)
ContainedGold
(mil oz)Silver
(mil oz)Proven 1.4 7.2 383 0.3 17.4Probable 1.5 6.5 181 0.3 8.6Total P&P 2.9 6.9 279 0.6 26.0
Valley of the Kings Mineral Reserve Estimate – June 2014 West Zone Mineral Reserve Estimate – June 2014
(1) Source: Feasibility Study and Technical Report Update on the Brucejack Project, dated June 19, 2014(2) Base case metals prices of US$1,100/oz gold and US$17/oz silver
Category Tonnes(mil)
Gold(g/t)
Silver(g/t)
ContainedGold
(mil oz)Silver
(mil oz)Proven 2.1 15.6 12 1.1 0.8Probable 11.5 15.7 10 5.8 3.9Total P&P 13.6 15.7 11 6.9 4.6

6
ROBUST ECONOMICS IN ALL GOLD SCENARIOS
(1) Source: Feasibility Study and Technical Report Update on the Brucejack Project, dated June 19, 2014(2) NPV is discounted to July 2014.
Economic Results by Metal Price (1)
Low Case Base Case High Case
Gold / Silver Price (US$/ounce) $800 / $15 $1,100 / $17 $1,400 / $21
Internal Rate of Return
20.3% (pre-tax)16.5% (post-tax)
34.7% (pre-tax)28.5% (post-tax)
47%(pre-tax)38.7% (post-tax)
Net Cash Flow (US$) $2.02 billion (pre-tax)$1.34 billion (post-tax)
$4.16 billion (pre-tax)$2.72 billion (post-tax)
$6.35 billion (pre-tax)$4.13 billion (post-tax)
Net Present Value (2)
(5.0% discount) (US$)$985 million (pre-tax)$620 million (post-tax)
$2.25 billion (pre-tax)$1.45 billion (post-tax)
$3.54 billion (pre-tax)$2.28 billion (post-tax)
Payback (from start of production period)
4.4 years (pre-tax)4.5 years (post-tax)
2.7 years (pre-tax)2.8 years (post-tax)
2.0 years (pre-tax)2.1 years (post-tax)
Capex(US$million) $746.9 $746.9 $746.9
Exchange Rate (US$:C$) 0.92 0.92 0.92

7
BRUCEJACK PROJECT PRODUCTION (1)
Mine life of 18 years producing an estimated 7.27 millionounces of gold
Average annual production of 504,000 ounces of goldover the first 8 years and 404,000 ounces of gold overmine life
Gold and silver recoveries of 96.7% and 90.0% over mine life
Production rate of 2,700 tonnes per day
(1) Source: Feasibility Study and Technical Report Update on the Brucejack Project, dated June 19, 2014

8
BRUCEJACK CAPITAL & OPERATING COSTS (1,2,3)
(1) Source: Feasibility Study and Technical Report Update on the Brucejack Project, dated June 19, 2014(2) Mine Site Capital Costs Include; mine site, mine site process, mine site utilities, mine site facilities, tailings facilities, mine
site temporary facilities and surface mobile equipment.(3) Mining Operating Costs Include; LOM ore milled; if excluding the ore mined during preproduction, the estimated cost is
C$91.78/t.
Mining $91.34
Processing$19.69
General & Admin$30.87
Surface Services &
Others $21.15Mine
Underground $179.5m
Mine Site $210.8m
Offsite Infrastructure
$89.1m
Indirect Costs
$127.5m
Owner’s Costs $71.0m
Contingency$69.0m
Total Direct Costs $479.4m
Total Indirect Costs $267.5m
Operating Cost Summary C$163.05 / tonne
Capital Cost Summary US$746.9 million

9
LOW ALL-IN SUSTAINING CASH COSTS (1)
(1) Source: Feasibility Study and Technical Report Update on the Brucejack Project, dated June 19, 2014.(2) Net of silver credits at Base Case silver price of $US17/ounce.
All-in Sustaining Cash Costs Per Ounce: US$448
(US$ million)Total Cash Costs (2) $2,814.5Reclamation Cost Accretion $27.5Sustaining Capital Expenditure $320.6
TOTAL: $3,162.6
Brucejack Project All-In Sustaining Cash Costs (Life of Mine)
Gold Sales 7,067,000 ounces

10
VALLEY OF THE KINGS: STOCKWORK
S N
Cleo West Drift 615L West Raise
Domain 20
~0.5 m
11
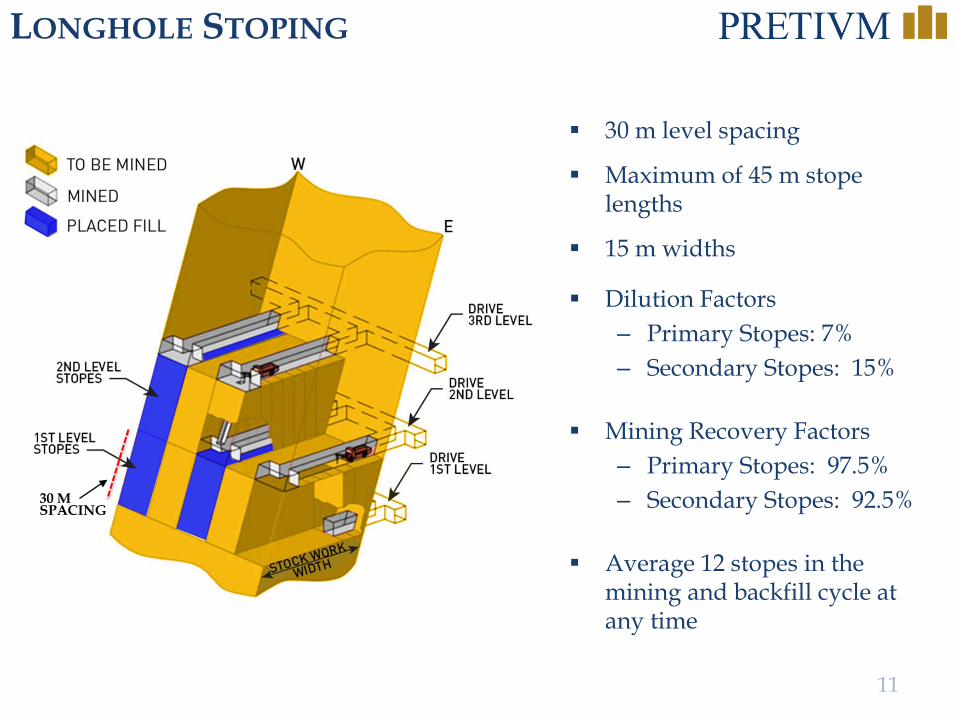
LONGHOLE STOPING
30 m level spacing
Maximum of 45 m stope lengths
15 m widths
Dilution Factors– Primary Stopes: 7%– Secondary Stopes: 15%
Mining Recovery Factors– Primary Stopes: 97.5%– Secondary Stopes: 92.5%
Average 12 stopes in the mining and backfill cycle at any time
30 M SPACING

12
BRUCEJACK MINE:LIFE OF MINE (18 YEAR)
Conveyor Portal
West Zone Portal
Shops
Valley of the Kings1350m level
Valley of the Kings1230m level
Ventilation RaiseVR1
Ventilation RaiseVR3
Ventilation RaiseVR4
Valley of the Kings1500m level
Valley of the Kings990m level
Ventilation RaiseVR5
West Zone990m levelOpen
Open

13
SITE LAYOUT
Portals
MillCamp
Development RockDisposal Laydown &
Fuel Storage
Substation
West ZonePortal
Truck Shop

14
PROJECT FLOW SHEET

15
Gold and silver recoveries of 96.7% and 90.0% over mine life
Gravity (43.3% LOM) and flotation ( 53.4% LOM) concentration
Producing doré and gold/silver concentrate
Bulk sample processing with single stage gravity and flotation concentration yielded gold recoveries averaging 98%
PROCESSING
Bulk sample gravity concentrate at Contact Mill, Montana
Bulk sample flotation concentrate at Contact Mill, Montana

16
PERMITTING PROCESS
Project Decision by
Ministers
BC Environmental Assessment Certificate issued March 26, 2015
Federal review coordinated by Federal Environmental Assessment Agency (CEAA) for relevant areas
Federal Environmental Decision Statement expected Q3 – draft report completed
MA & EMA permits issued by Province expected summer 2015

17
COMMUNITY ENGAGEMENT
Cooperation and Benefits Agreement signed with Nisga’a Nation
Commercial contracting and employment of First Nations has been ongoing since project discovery
The proposed mine will provide approximately 900 jobs during construction and 500 jobs during operations
We will continue to extend both commercial contract and employment opportunities to locals whenever possible

18
NEAREST FISH 20KM AWAY
CASCADE
BRUCEJACK PROJECT
BRUCEJACK LAKE (not fish habitat)

19
SOUND TAILINGS MANAGEMENT PLAN
Approximately half the tailings from mine operations go back underground as paste backfill, with the remaining deposited at the bottom of Brucejack Lake
Brucejack Lake is not a fish habitat

20
KEY MILESTONES TO PRODUCTION
2017201620152014
Updated Feasibility Study
Start Construction
Transmission Line Complete
Start Commercial Production
Underground Infrastructure Complete
Start Process Plant /Mill Building Construction
CommissioningFiled EAC Application & EIS
Received BC EAC
Anticipate Federal Approval from CEAA
Detailed Engineering

21
PRE-CONSTRUCTION ACTIVITIES:DETAILED ENGINEERING - MINE
Engineering Status 35% complete Final long lead equipment recommendations
issued Ready to commence bulk earthworks
Procurement/Contract Status 31 RFQs Issued, Bids for 25 received 330-person camp awarded to Civeo Construction power awarded to Finning Development assay lab awarded to Met Solve
No change to June 2014 Feasibility Study cost estimate at June 30, 2015
22
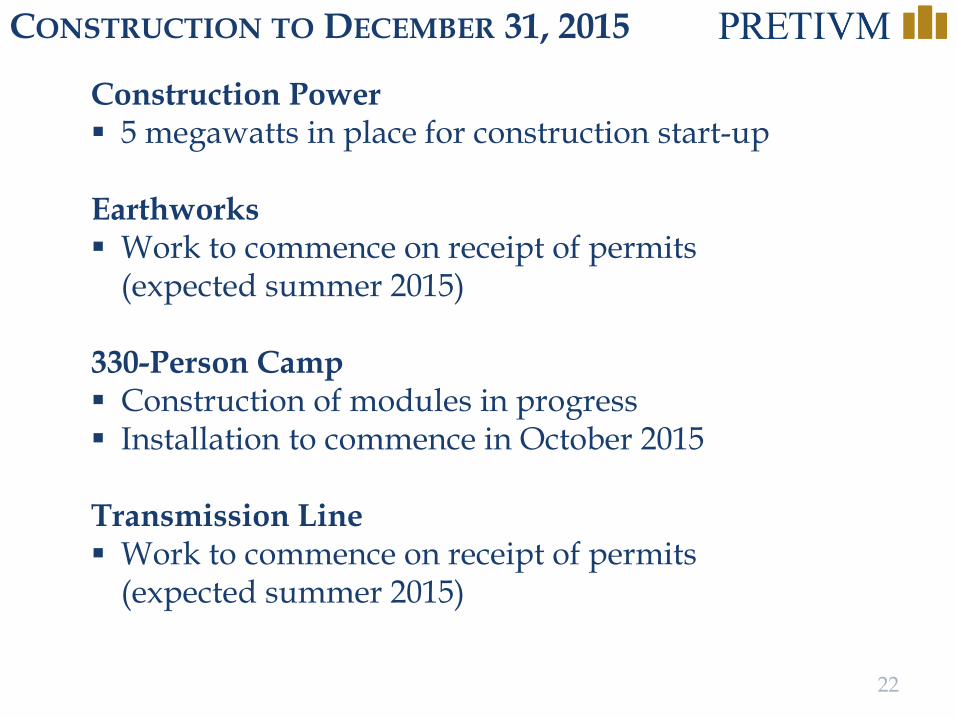
CONSTRUCTION TO DECEMBER 31, 2015
Construction Power 5 megawatts in place for construction start-up
Earthworks Work to commence on receipt of permits
(expected summer 2015)
330-Person Camp Construction of modules in progress Installation to commence in October 2015
Transmission Line Work to commence on receipt of permits
(expected summer 2015)

23
SITE ACTIVITIES

24
SITE ACTIVITIES

25
MINING: YEAR 1
MINING: YEAR 5

26
2015 UNDERGROUND INFILL DRILL PROGRAM: 1320, 1310 AND 1270 DRILL FANS
1320 Level
100m
1260 Level
1310 Drill Bay
1270 Drill Bay
(1) Source: Feasibility Study and Technical Report Update on the Brucejack Project, dated June 19, 2014
Grade Blocks (g/t Au) inIn Years 1-3 Stopes (1)
5-10
10-20
20-60
>60
Probable Reserves
Drill Hole

27
2015 UNDERGROUND EXPLORATION PROGRAM:VIEW WEST OF YEARS 1-3 STOPES
1320 Level
100m
N
1345 Level
1260 Level
S
(1) Source: Feasibility Study and Technical Report Update on the Brucejack Project, dated June 19, 2014
Grade Blocks (g/t Au) inIn Years 1-3 Stopes (1)
5-10
10-20
20-60
>60
Proven & Probable Reserves
Drill Hole

28
2015 UNDERGROUND DRILLING RESULTS:PLAN VIEW
> 20.0
Assay intervals
5.0 - 20.0
1.0 – 5.0
0.5 – 1.0
< 0.5
Key (g/t Au)
1345m Development (2013 Bulk Sample level)
50m
N 1320m Drill Bay

29
EXPLORATION POTENTIAL EAST - WEST
200 m
N Valley of the Kings Access Ramp
Bulk Sample Development
Approximate surface projection of December
2013 Measured & Indicated resources
SU-4980.5m @ 3,874 g/t Au
SU-5261.16m @ 4,195 g/t Au
VU-1360.5m @ 1,100 g/t Au
Brucejack Fault
30
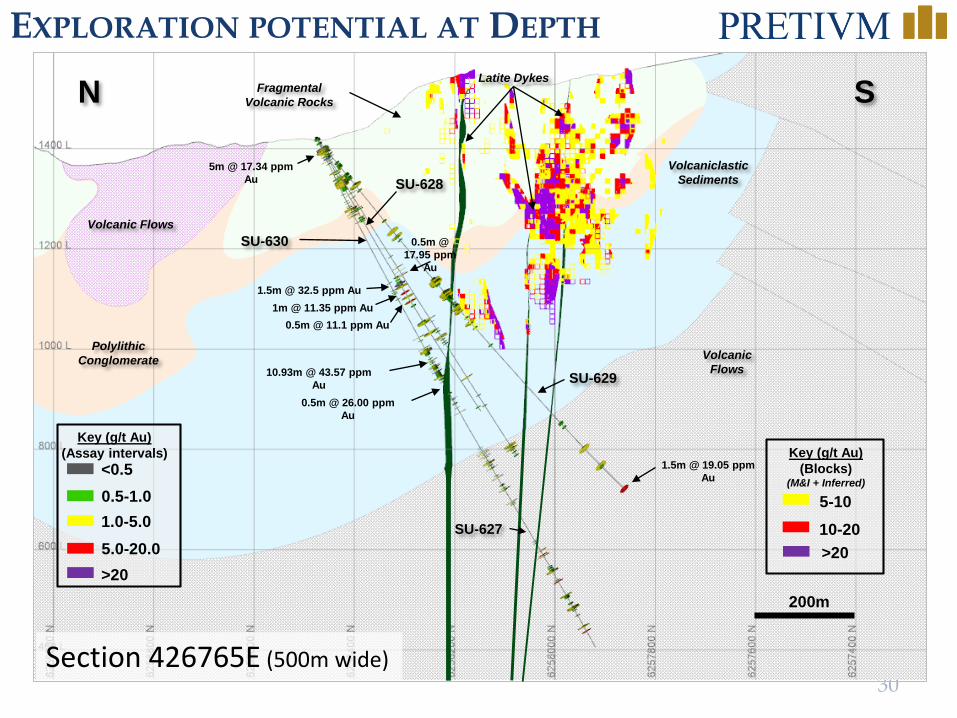
EXPLORATION POTENTIAL AT DEPTH
10.93m @ 43.57 ppm Au
0.5m @ 26.00 ppm Au
N S
200m
<0.50.5-1.01.0-5.0
>205.0-20.0
Key (g/t Au)(Assay intervals)
Fragmental Volcanic Rocks
PolylithicConglomerate Volcanic
Flows
VolcaniclasticSediments
Volcanic Flows
5-1010-20>20
Key (g/t Au)(Blocks)
(M&I + Inferred)
SU-627
Latite Dykes
SU-630
SU-628
SU-629
1.5m @ 19.05 ppm Au
0.5m @ 17.95 ppm
Au
5m @ 17.34 ppm Au
1.5m @ 32.5 ppm Au1m @ 11.35 ppm Au
0.5m @ 11.1 ppm Au
Section 426765E (500m wide)

31
EXPLORATION POTENTIAL:2015 GRASS-ROOTS PROGRAM
Target optimization Airborne EM and Magnetic Survey
Additional approximately 2,300line kilometers
Surface mapping and sampling
Surface drilling 10,000 to 15,000 m targeting porphyry
/epithermal-style mineralization Flow Dome Zone Kitchenview Zone
Additional drill targets results-based
KitchenviewZone
Brucejack Lake
BrucejackLake
Valley of the Kings
West Zone

32
THE NEXT 12 MONTHS: 2015
Received provincial Environmental Assessment Certificate
Detailed engineering and procurement
In-fill underground drill program
Financing structure
Anticipate federal Environmental Assessment Decision Statement
Start construction and underground mine development
Grass-roots exploration drilling

33
HIGH-GRADE GOLD WITH SIZE
Valley of the KingsPretivm
Cerro Negro(Goldcorp)
Pogo Mine(Sumitomo)
Eleonore(Goldcorp)
Red Lake(Goldcorp)
El Penon(Yamana)
Kirkland Lake Mine (Kirkland Lake)
Casa Berardi(Hecla)
Kensington(Coeur)
0
2
4
6
8
10
12
14
16
18
20
0 1 2 3 4 5 6 7
Prov
en +
Pro
babl
e G
old
Gra
de (g
/t)
Proven + Probable Gold Reserves (mm oz)
Data source: Company websites as at April 20, 2015Valley of the Kings reserves based on Feasibility Study and Technical Report Update on the Brucejack Project, dated June 19, 2014

34
Silver Standard,
13%
Institutions, 47%Zijin, 9%
Management, 3%
Retail, 28%
SHAREHOLDING & ANALYST COVERAGE
(1) As of July 14, 2015; ownership calculated on an undiluted basis. (2) As of July 8, 2015. Source: IPREO, SEDI
Top Shareholders(2) (% S/O)
Silver Standard Resources 12.81Zijin Mining 9.61Van Eck Associates 6.82Liberty Metals & Mining 6.25 Aristeia Capital, LLC 4.13Sun Valley Gold, LLC 3.01Pretivm Management 3.00 Mackenzie Financial 2.17Franklin Advisors, Inc. 1.87Royce & Associates 1.73 Sprott Asset Management 1.37Analyst CoverageCanaccord Genuity Joe MazumdarCIBC Jeff KilleenCitibank Alex HackingCormark Securities Richard GrayGMP Securities George AlbinoH.C. Wainwright Heiko F. IhleNumis Phil SwinfenPareto Securities John McClintockRBC Dan RollinsRoth Capital Partners Joseph ReagorSalman Partners Ash GuglaniScotiabank Ovais Habib
Capital Structure(1)
Public Float 116.4Silver Standard Shares 17.1 Total Issued & Outstanding Shares 133.5 Incentive Options 12.2Total Fully Diluted Shares 145.7
Market Cap (at Jul. 22, 2015) C$800 million
Working Capital (at Mar. 31, 2015) C$103 million
(shares in millions)

35
CONTACT:Phone: 604-558-1784Fax: 604-558-4784Toll-free: [email protected]
HEAD OFFICE:Pretium Resources Inc.570 Granville St.Suite 1600Vancouver, BCCanada V6C 3P1
COMMON SHARES:TSX/NYSE:PVGIssued: 133.5 millionFully diluted: 145.7 million52-week hi/low: $9.05/$4.60Market cap: $800 million (at Jul. 22, 2015)
VISIT US AT BOOTH# 38
35

36
APPENDIX: CASH FLOW: FIRST 10 YEARS
Base Case ($1,100/oz Au; $17/oz Ag; C$/US$ 0.92)
High Case ($1,400/oz Au; $21/oz Ag; C$/US$ 0.92)
Year 1 2 3 4 5 6 7 8 9 10Operating Cash Flow($ million) 270.5 341.4 394.5 354.7 390.3 412.9 411.0 408.3 327.4 346.4
Pre-tax Net Cash Flow($ million) 193.7 310.3 366.2 336.9 367.5 392.1 384.4 392.6 308.8 329.1
Post-tax Net Cash Flow ($ million) 188.4 303.5 326.4 234.3 241.7 256.1 248.6 255.5 200.3 213.2
Year 1 2 3 4 5 6 7 8 9 10Operating Cash Flow($ million) 388.6 478.9 545.4 495.6 540.7 570.2 569.1 565.0 460.5 484.1
Pre-tax Net Cash Flow($ million) 311.8 447.7 517.1 477.8 517.9 549.4 542.5 549.2 441.9 466.8
Post-tax Net Cash Flow ($ million) 304.1 421.2 363.3 316.1 338.4 357.2 350.3 356.2 285.9 301.7
(1) Source: Feasibility Study and Technical Report Update on the Brucejack Project, dated June 19, 2014

37
APPENDIX: 2013 RESOURCE ESTIMATE
Valley of the Kings Mineral Resource estimate - December 2013(1),(4)
(Based on a cut-off grade of 5.0 grams of gold-equivalent/tonne(5))
CategoryTonnes
(millions)Gold(g/t)
Silver(g/t)
Contained(3)
Gold(million oz)
Silver(million oz)
Measured 2.0 19.3 14.4 1.2 0.9Indicated 13.4 17.4 14.3 7.5 6.1
M & I 15.3 17.6 14.3 8.7 7.0Inferred(2) 5.9 25.6 20.6 4.9 3.9
(1) Mineral Resources which are not Mineral Reserves do not have demonstrated economic viability. The estimate of Mineral Resources may be materially affected byenvironmental, permitting, legal, marketing, or other relevant issues. The Mineral Resources in this news release were estimated using the Canadian Institute of Mining,Metallurgy and Petroleum (CIM), CIM Standards on Mineral Resources and Reserves, Definitions and Guidelines prepared by the CIM Standing Committee on ReserveDefinitions and adopted by CIM Council.(2) The quantity and grade of reported Inferred resources in this estimation are uncertain in nature and there has been insufficient exploration to define these Inferred Resources asan Indicated or Measured Mineral Resource and it is uncertain if further exploration will result in upgrading them to an Indicated or Measured Mineral Resource category.(3) Contained metal figures and totals may differ due to rounding of figures.(4) The Mineral Resource estimate stated in Table 1 is defined using 10 m by 10 m by 10 m blocks in the in Valley of the Kings.(5) The gold equivalent value is defined as AuEq = Au + Ag/53.(6) See Brucejack Project Mineral Resources Update Technical Report dated December 19, 2013.
The updated Valley of the Kings Resource estimate announced in December(6) added Measured gold Resources and increased gold grade:
38
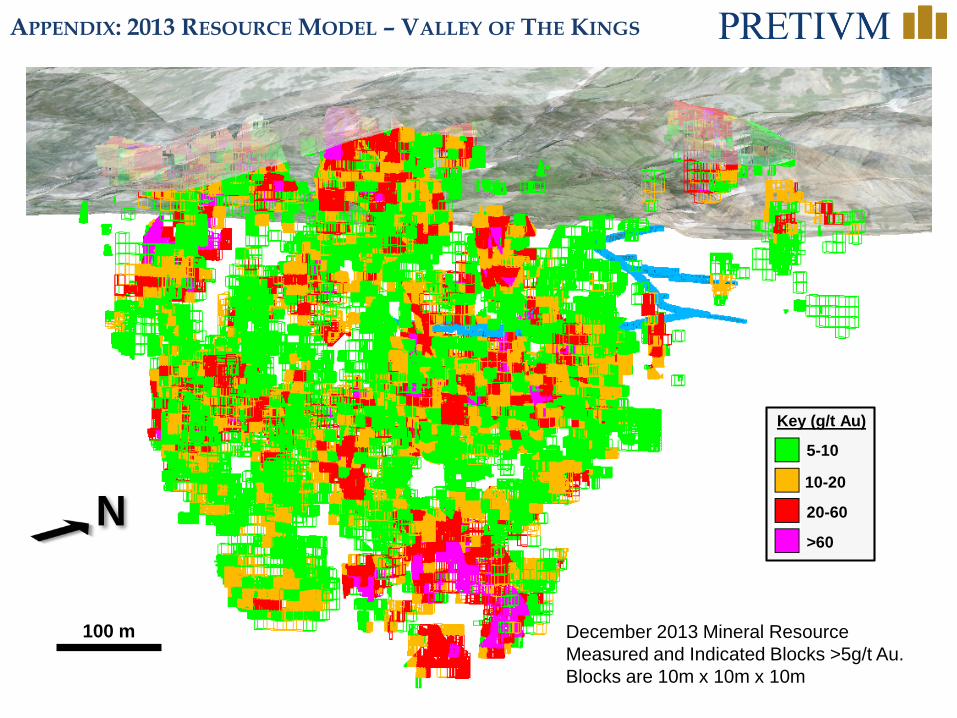
APPENDIX: 2013 RESOURCE MODEL – VALLEY OF THE KINGS
5-10
10-20
20-60
>60
Key (g/t Au)
December 2013 Mineral ResourceMeasured and Indicated Blocks >5g/t Au. Blocks are 10m x 10m x 10m
100 m
N

39
APPENDIX: 2013 UNDERGROUND DRILLING
Fragmental Volcanic Rocks
PolylithicConglomerate
VolcanicSediment
50 m
N
Completed Underground Development
Completed Bulk Sample
Legend
>20
Key (g/t Au)Assay intervals
5.0-20.0
2.5-5.0
Silicified Conglomerate
Volcanic Flows