Embed Size (px)
Citation preview
Q2 FYʹ17 Investor PresentationMarch 2, 2017
2
SAFE HARBOR
Non-GAAP Financial Measures and Other Key Performance MeasuresTo supplement our condensed consolidated financial statements, which are prepared and presented in accordance with GAAP, we use the following non-GAAP financial and other key performance measures: billings, non-GAAP gross margin percentage, non-GAAP net loss, pro forma non-GAAP net loss per share, and free cash flow. In computing these non-GAAP financial measures, we exclude certain items such as stock-based compensation and the related income tax impact, costs associated with our acquisitions (such as amortization of acquired intangible assets, revaluation of contingent consideration, income tax related impact, and other acquisition-rela ted costs), loss on debt extinguishment, and changes in the fair value of our preferred stock warrant liability. Billings is a performance measure which our management believes provides useful information to investors because it represents the amounts under binding purchase orders received by us during a given period that have been billed, and we calculate billings by adding the change in deferred revenue between the start and end of the period to total revenue recognized in the same period. Free cash flow is a performance measure that our management believes provides useful information to management and investors about the amount of cash generated by the business after necessary capital expenditures, and we define free cash flow as net cash (used in) provided by operating activities less purchases of property and equipment. We use these non-GAAP financial and key performance measures for financial and operational decision-making and as a means to evaluate period-to-period comparisons. Our management believes that these non-GAAP financial measures provide meaningful supplemental information regarding our performance and liquidity by excluding certain expenses and expenditures such as stock-based compensation expense that may not be indicative of our ongoing core business operating results. However, these non-GAAP financial and key performance measures have limitations as analytical tools, and you should not consider them in isolation or as substitutes for analysis of our results as reported under GAAP. Billings, non-GAAP gross margin percentage, non-GAAP net loss, pro forma non-GAAP net loss per share, and free cash flow are not substitutes for total revenue, gross profit, net loss, net loss per share, or net cash (used in) provided by operating activities, respectively. In addition, other companies, including companies in our industry, may calculate non-GAAP financial measures and key performance measures differently or may use other measures to evaluate their performance, all of which could reduce the usefulness of our non-GAAP financial measures and key performance measures as tools for comparison. We urge you to review the reconciliation of our non-GAAP financial measures and key performance measures to the most directly comparable GAAP financial measures included below in the tables captioned “Reconciliation of Non-GAAP Financial Measures and Key Performance Measures” and not to rely on any single financial measure to evaluate our business.
Forward Looking StatementsThis presentation contains express and implied forward-looking statements, including but not limited to statements relating to our long-term financial model targets and our plans to achieve those targets. These forward-looking statements are not historical facts, and instead are based on our current expectations, estimates, opinions and beliefs. Consequently, you should not rely on these forward-looking statements. The accuracy of such forward-looking statements depends upon future events, and involves risks, uncertainties and other factors beyond our control that may cause these statements to be inaccurate and cause our actual results, performance or achievements to differ materially and adversely from those anticipated or implied by such statements, including, among others: the rapid evolution of the markets in which we compete; our ability to sustain or manage future growth effectively; factors that could result in the significant fluctuation of our future quarterly operating results, including, among other things, our revenue mix, the timing and magnitude of orders, shipments and acceptance of our solutions in any given quarter, our ability to attract new and retain existing end-customers, changes to the pricing of certain components of our solutions, and fluctuations in demand and competitive pricing pressures for our solutions; delays in or lack of customer or market acceptance of our new product features or technology; the introduction, or acceleration of adoption of, competing solutions, including public cloud infrastructure; and other risks detailed in our Quarterly Report on Form 10-Q for the quarter ended October 31, 2016, filed with the SEC on December 8, 2016. Additional information will also be set forth in our Form 10-Q that will be filed for the quarter ended January 31, 2017, which should be read in conjunction with these financial results. Our SEC filings are available on the Investor Relations section of the company’s website at ir.nutanix.com and on the SEC's website at www.sec.gov. These forward-looking statements speak only as of the date of this presentation and, except as required by law, we assume no obligation to update forward-looking statements to reflect actual results or subsequent events or circumstances.
3
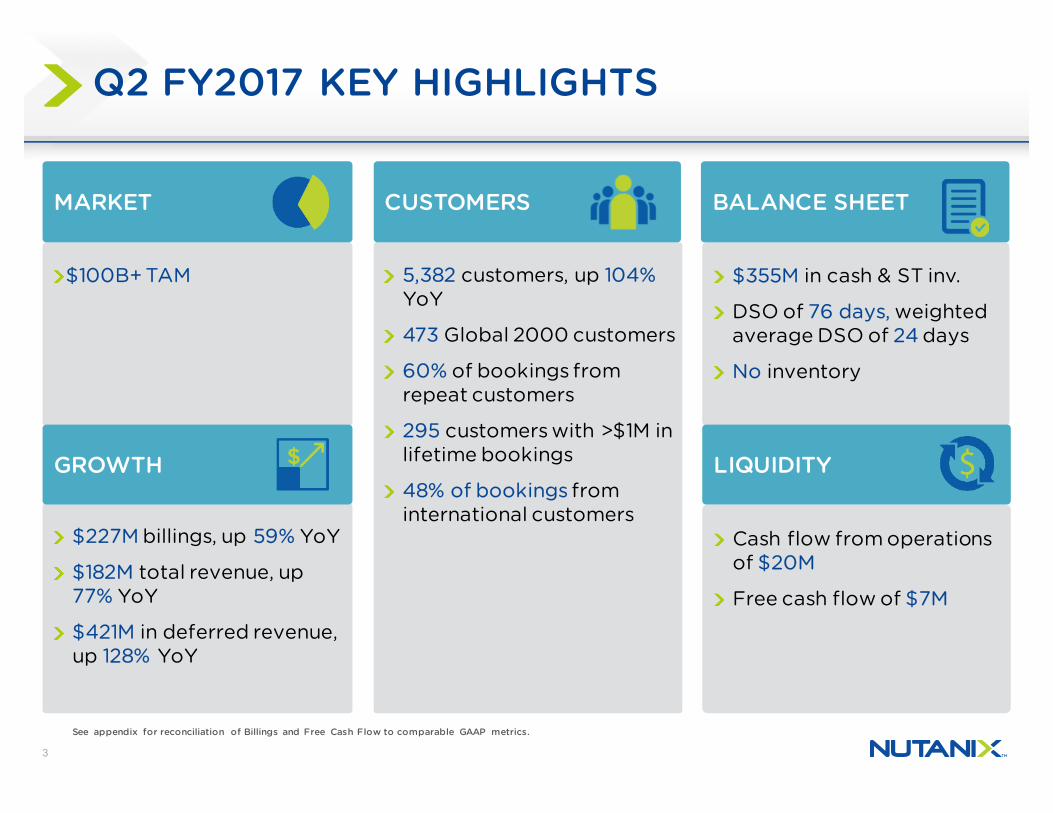
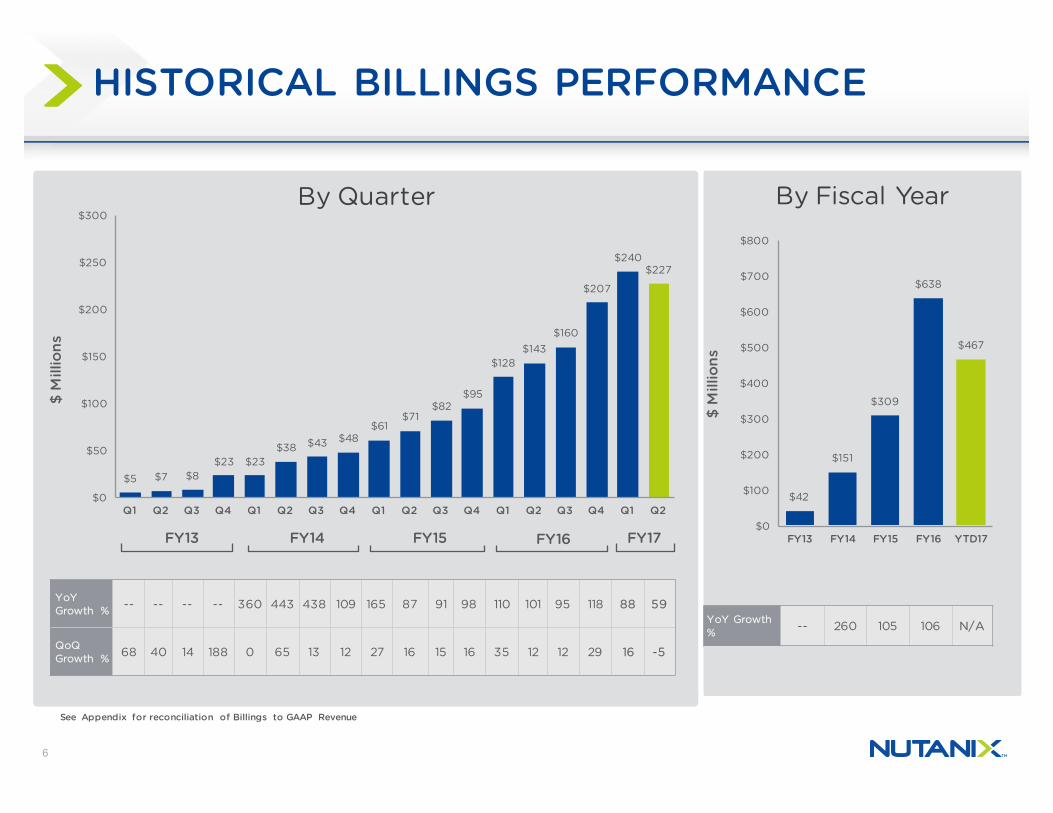
$227M billings, up 59% YoY
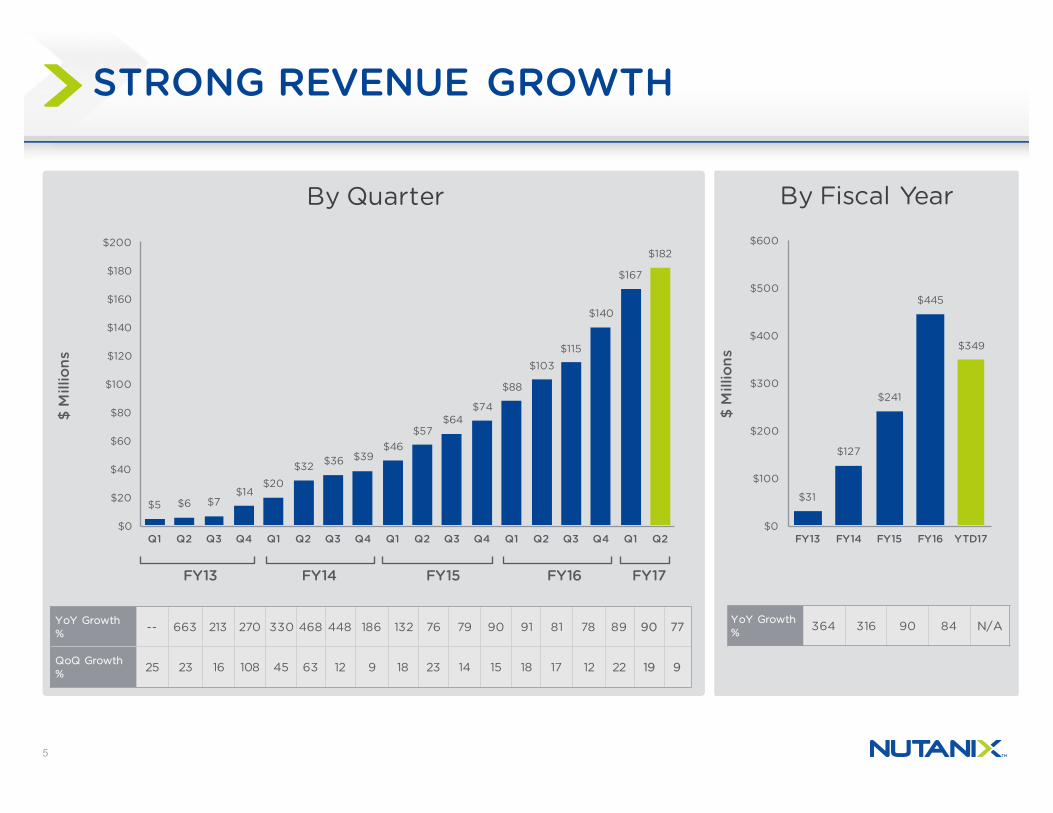
$182M total revenue, up 77% YoY
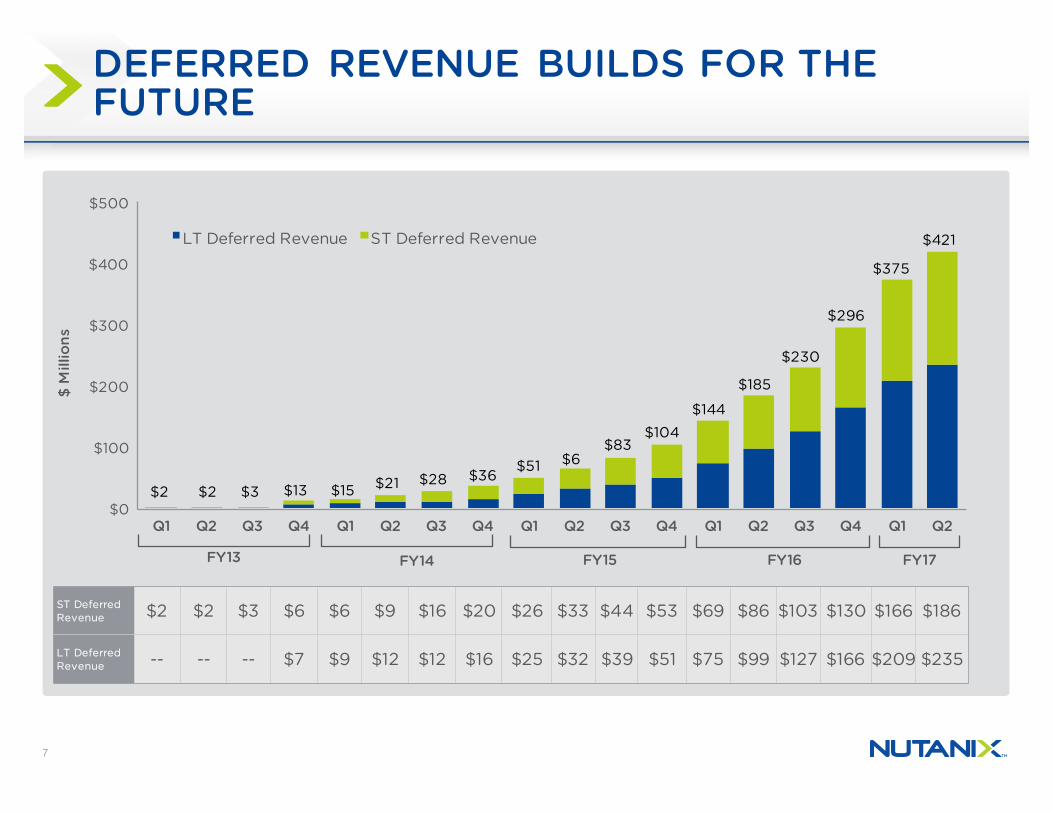
$421M in deferred revenue, up 128% YoY
$100B+ TAM
Q2 FY2017 KEY HIGHLIGHTS
MARKET
5,382 customers, up 104%YoY
473 Global 2000 customers
60% of bookings from repeat customers
295 customers with >$1M in lifetime bookings
48% of bookings from international customers
CUSTOMERS
$355M in cash & ST inv.
DSO of 76 days, weighted average DSO of 24 days
No inventory
BALANCE SHEET
GROWTH
Cash flow from operations of $20M
Free cash flow of $7M
LIQUIDITY
See appendix for reconciliation of Billings and Free Cash Flow to comparable GAAP metrics.
4
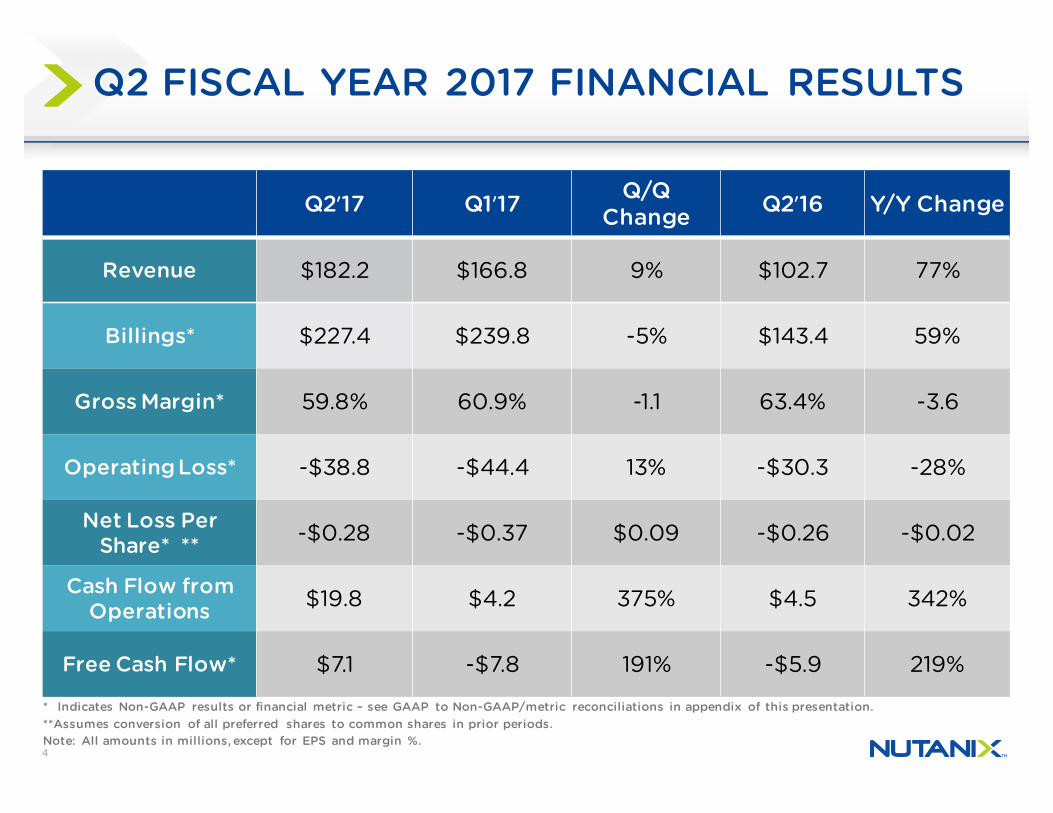
Q2ʹ17 Q1ʹ17 Q/Q Change Q2ʹ16 Y/Y Change
Revenue $182.2 $166.8 9% $102.7 77%
Billings* $227.4 $239.8 -5% $143.4 59%
Gross Margin* 59.8% 60.9% -1.1 63.4% -3.6
Operating Loss* -$38.8 -$44.4 13% -$30.3 -28%
Net Loss Per Share* ** -$0.28 -$0.37 $0.09 -$0.26 -$0.02
Cash Flow from Operations $19.8 $4.2 375% $4.5 342%
Free Cash Flow* $7.1 -$7.8 191% -$5.9 219%
Q2 FISCAL YEAR 2017 FINANCIAL RESULTS
* Indicates Non-GAAP results or financial metric – see GAAP to Non-GAAP/metric reconciliations in appendix of this presentation.**Assumes conversion of all preferred shares to common shares in prior periods.Note: All amounts in millions, except for EPS and margin %.
5
By Quarter By Fiscal Year
STRONG REVENUE GROWTH
$31
$127
$241
$445
$349
$0
$100
$200
$300
$400
$500
$600
FY13 FY14 FY15 FY16 YTD17
$ M
illio
ns
YoY Growth % 364 316 90 84 N/A
$5 $6 $7$14
$20$32 $36 $39
$46$57
$64$74
$88
$103$115
$140
$167
$182
$0
$20
$40
$60
$80
$100
$120
$140
$160
$180
$200
Q1 Q2 Q3 Q4 Q1 Q2 Q3 Q4 Q1 Q2 Q3 Q4 Q1 Q2 Q3 Q4 Q1 Q2
$ M
illio
ns
FY15 FY17FY16FY14FY13
YoY Growth % -- 663 213 270 330 468 448 186 132 76 79 90 91 81 78 89 90 77
QoQ Growth % 25 23 16 108 45 63 12 9 18 23 14 15 18 17 12 22 19 9
6
By Quarter By Fiscal Year
HISTORICAL BILLINGS PERFORMANCE
$42
$151
$309
$638
$467
$0
$100
$200
$300
$400
$500
$600
$700
$800
FY13 FY14 FY15 FY16 YTD17
$ M
illio
ns
YoY Growth % -- 260 105 106 N/A
$5 $7 $8$23 $23
$38 $43 $48$61
$71$82
$95
$128$143
$160
$207
$240$227
$0
$50
$100
$150
$200
$250
$300
Q1 Q2 Q3 Q4 Q1 Q2 Q3 Q4 Q1 Q2 Q3 Q4 Q1 Q2 Q3 Q4 Q1 Q2
$ M
illio
ns
FY15 FY17FY16FY14FY13
YoY Growth % -- -- -- -- 360 443 438 109 165 87 91 98 110 101 95 118 88 59
QoQ Growth % 68 40 14 188 0 65 13 12 27 16 15 16 35 12 12 29 16 -5
See Appendix for reconciliation of Billings to GAAP Revenue
7
$0
$100
$200
$300
$400
$500
Q1 Q2 Q3 Q4 Q1 Q2 Q3 Q4 Q1 Q2 Q3 Q4 Q1 Q2 Q3 Q4 Q1 Q2
$ M
illio
ns
LT Deferred Revenue ST Deferred Revenue
FY15 FY16 FY17
$3 $13
$83$104
$144
$185
$230
$296
$375
FY14FY13
$6$51$36$28$21$15$2$2
$421
DEFERRED REVENUE BUILDS FOR THE FUTURE
ST Deferred Revenue $2 $2 $3 $6 $6 $9 $16 $20 $26 $33 $44 $53 $69 $86 $103 $130 $166 $186
LT DeferredRevenue -- -- -- $7 $9 $12 $12 $16 $25 $32 $39 $51 $75 $99 $127 $166 $209 $235
8
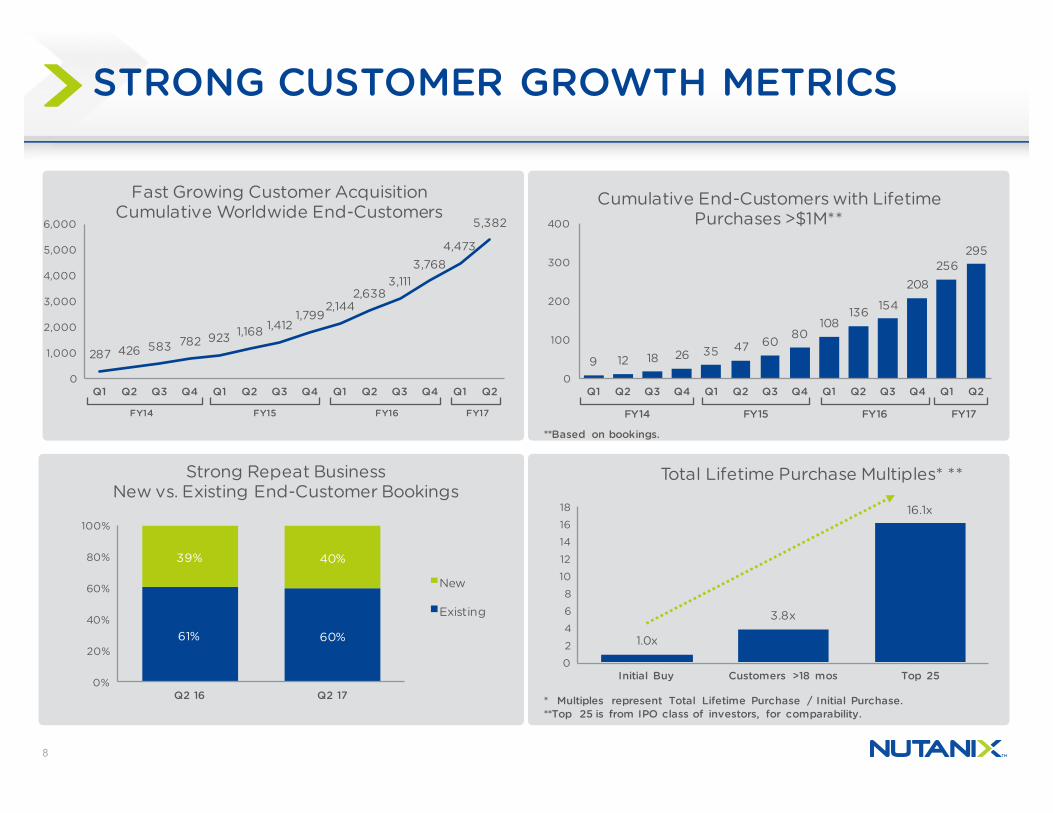
STRONG CUSTOMER GROWTH METRICS
287 426 583 782 923 1,168 1,4121,799
2,1442,638
3,1113,768
4,473
5,382
0
1,000
2,000
3,000
4,000
5,000
6,000
Q1 Q2 Q3 Q4 Q1 Q2 Q3 Q4 Q1 Q2 Q3 Q4 Q1 Q2
Fast Growing Customer AcquisitionCumulative Worldwide End-Customers
FY15 FY16 FY17FY14
1.0x
3.8x
16.1x
0
2
4
6
8
10
12
14
16
18
Initial Buy Customers >18 mos Top 25
Total Lifetime Purchase Multiples* **
* Multiples represent Total Lifetime Purchase / Initial Purchase.**Top 25 is from IPO class of investors, for comparability.
9 12 18 26 35 47 6080
108136 154
208256
295
0
100
200
300
400
Q1 Q2 Q3 Q4 Q1 Q2 Q3 Q4 Q1 Q2 Q3 Q4 Q1 Q2
Cumulative End-Customers with Lifetime Purchases >$1M**
FY15 FY16 FY17FY14
**Based on bookings.
61% 60%
39% 40%
0%
20%
40%
60%
80%
100%
Q2 16 Q2 17
New
Existing
Strong Repeat BusinessNew vs. Existing End-Customer Bookings
9
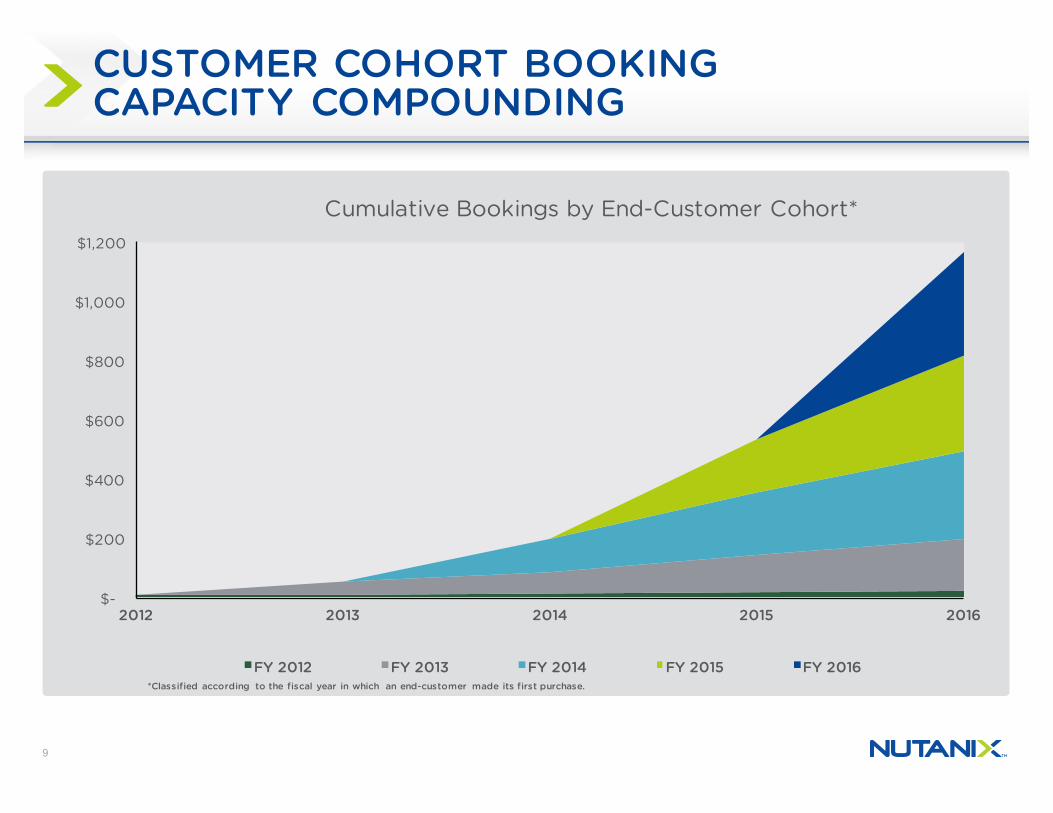
CUSTOMER COHORT BOOKING CAPACITY COMPOUNDING
$-
$200
$400
$600
$800
$1,000
$1,200
2012 2013 2014 2015 2016
Cumulative Bookings by End-Customer Cohort*
FY 2012 FY 2013 FY 2014 FY 2015 FY 2016*Classified according to the fiscal year in which an end-customer made its first purchase.
10
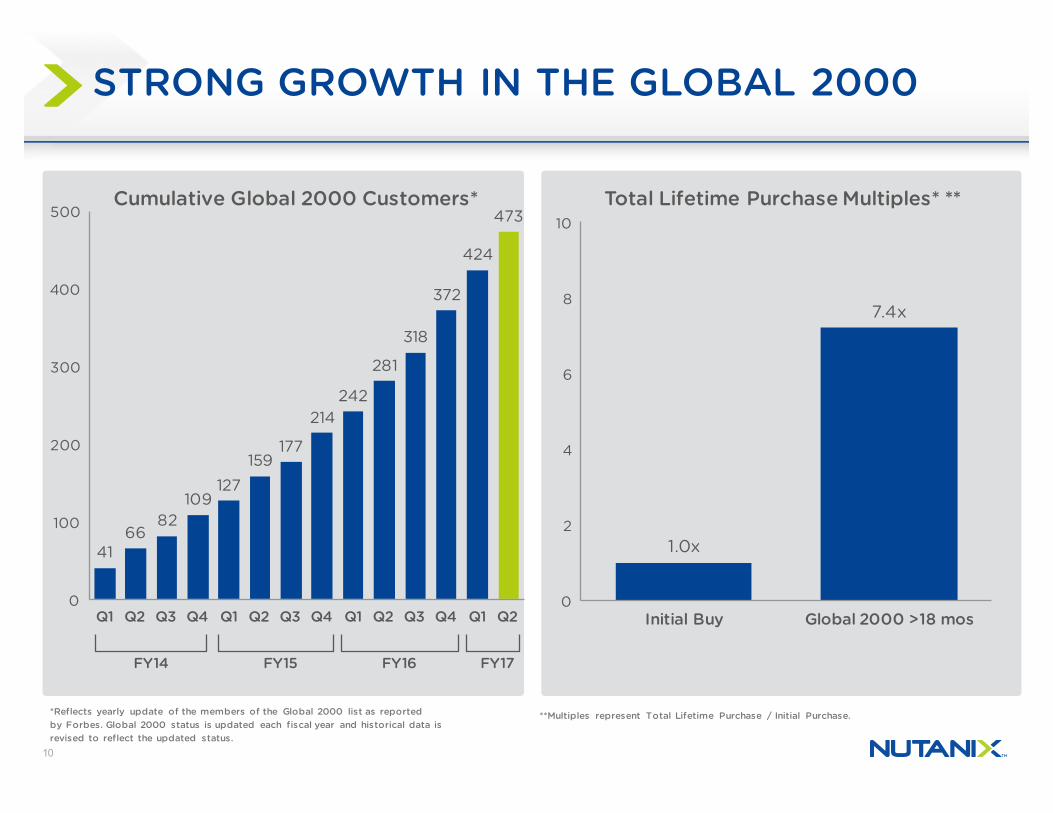
STRONG GROWTH IN THE GLOBAL 2000
4166
82109
127159
177
214242
281
318
372
424
473
0
100
200
300
400
500
Q1 Q2 Q3 Q4 Q1 Q2 Q3 Q4 Q1 Q2 Q3 Q4 Q1 Q2
FY15 FY16 FY17FY14
1.0x
7.4x
0
2
4
6
8
10
Initial Buy Global 2000 >18 mos
Cumulative Global 2000 Customers* Total Lifetime Purchase Multiples* **
*Reflects yearly update of the members of the Global 2000 list as reported by Forbes. Global 2000 status is updated each fiscal year and historical data isrevised to reflect the updated status.
**Multiples represent Total Lifetime Purchase / Initial Purchase.
11
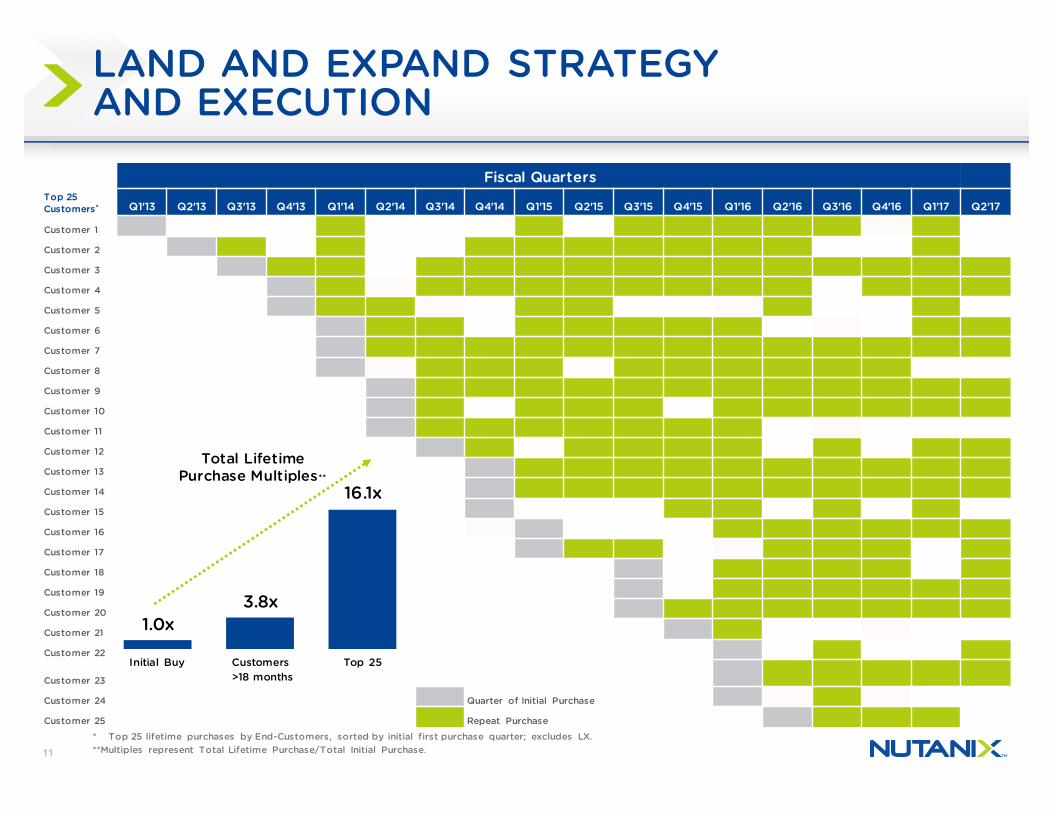
LAND AND EXPAND STRATEGY AND EXECUTION
Top 25 Customers*
Fiscal Quarters
Q1'13 Q2'13 Q3'13 Q4'13 Q1'14 Q2'14 Q3'14 Q4'14 Q1'15 Q2'15 Q3'15 Q4'15 Q1'16 Q2'16 Q3'16 Q4'16 Q1’17 Q2’17
Customer 1
Customer 2
Customer 3
Customer 4
Customer 5
Customer 6
Customer 7
Customer 8
Customer 9
Customer 10
Customer 11
Customer 12
Customer 13
Customer 14
Customer 15
Customer 16
Customer 17
Customer 18
Customer 19
Customer 20
Customer 21
Customer 22
Customer 23
Customer 24 Quarter of Initial Purchase
Customer 25 Repeat Purchase
* Top 25 lifetime purchases by End-Customers, sorted by initial first purchase quarter; excludes LX.**Multiples represent Total Lifetime Purchase/Total Initial Purchase.
1.0x3.8x
16.1x
Initial Buy Customers>18 months
Top 25
Total Lifetime Purchase Multiples**
12
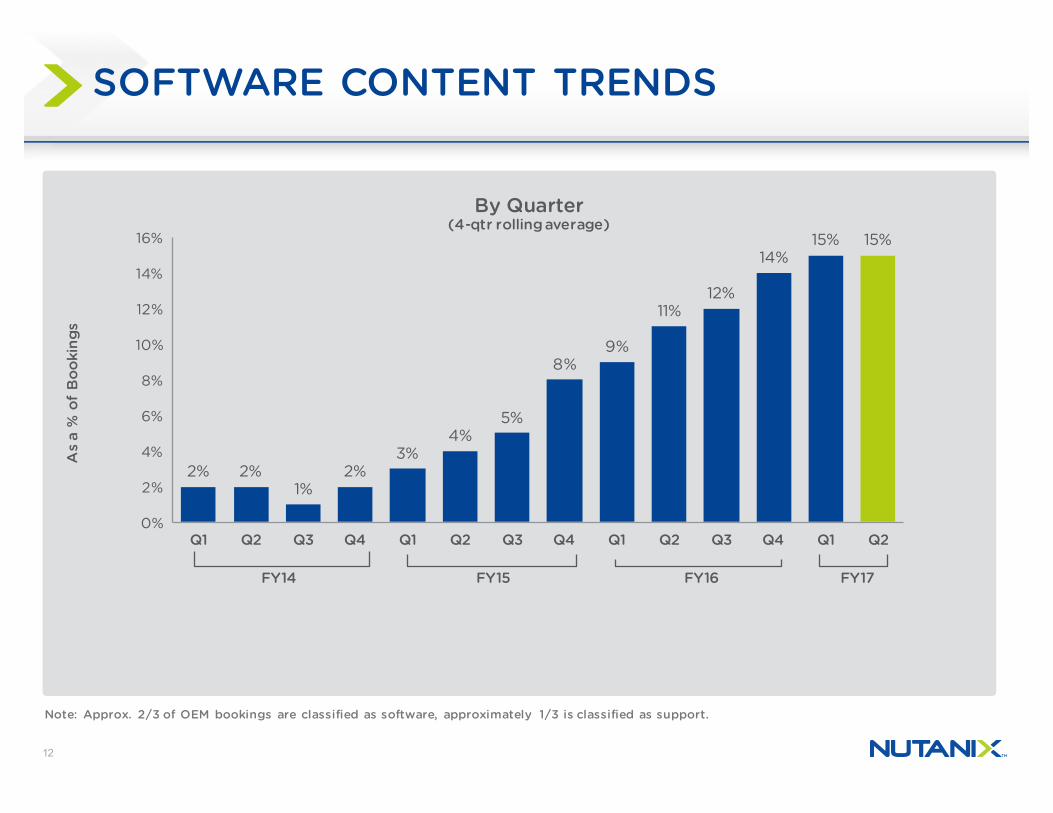
SOFTWARE CONTENT TRENDS
2% 2%1%
2%3%
4%5%
8%9%
11%12%
14%15% 15%
0%
2%
4%
6%
8%
10%
12%
14%
16%
Q1 Q2 Q3 Q4 Q1 Q2 Q3 Q4 Q1 Q2 Q3 Q4 Q1 Q2
As
a %
of
Boo
king
s
By Quarter(4-qtr rolling average)
FY15 FY16 FY17FY14
Note: Approx. 2/3 of OEM bookings are classified as software, approximately 1/3 is classified as support.
13
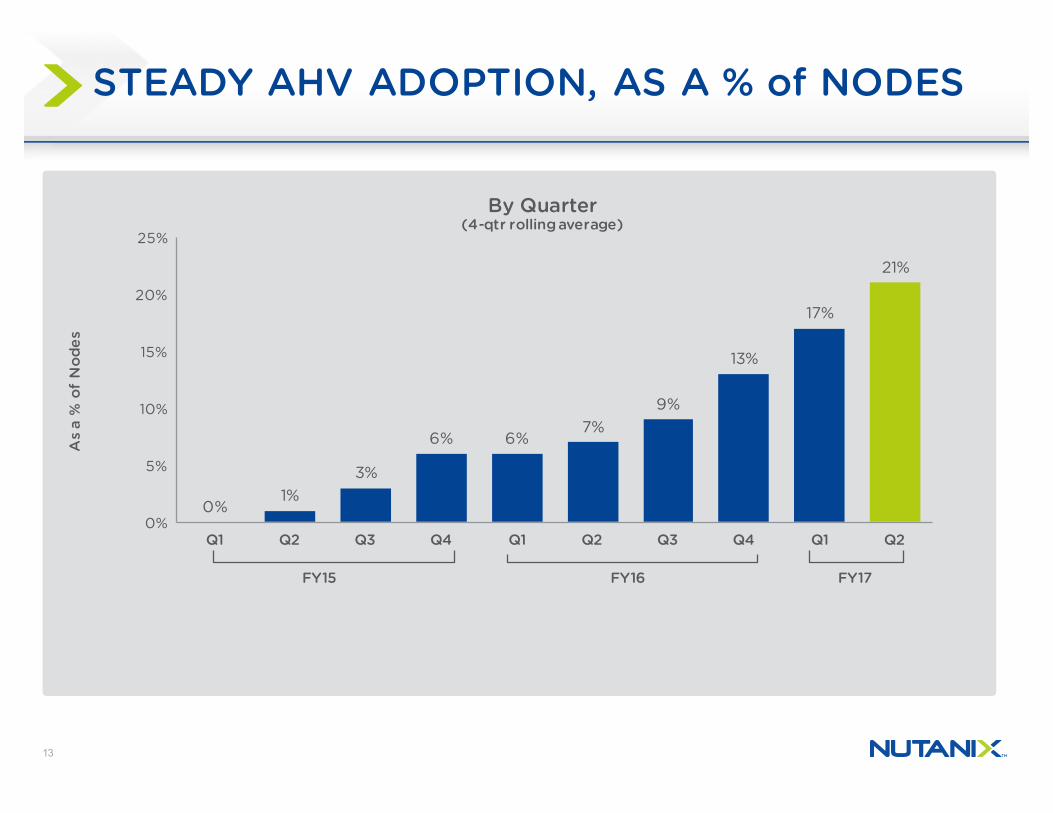
STEADY AHV ADOPTION, AS A % of NODES
0%1%
3%
6% 6%7%
9%
13%
17%
21%
0%
5%
10%
15%
20%
25%
Q1 Q2 Q3 Q4 Q1 Q2 Q3 Q4 Q1 Q2
As
a %
of
Nod
es
By Quarter(4-qtr rolling average)
FY15 FY16 FY17
14
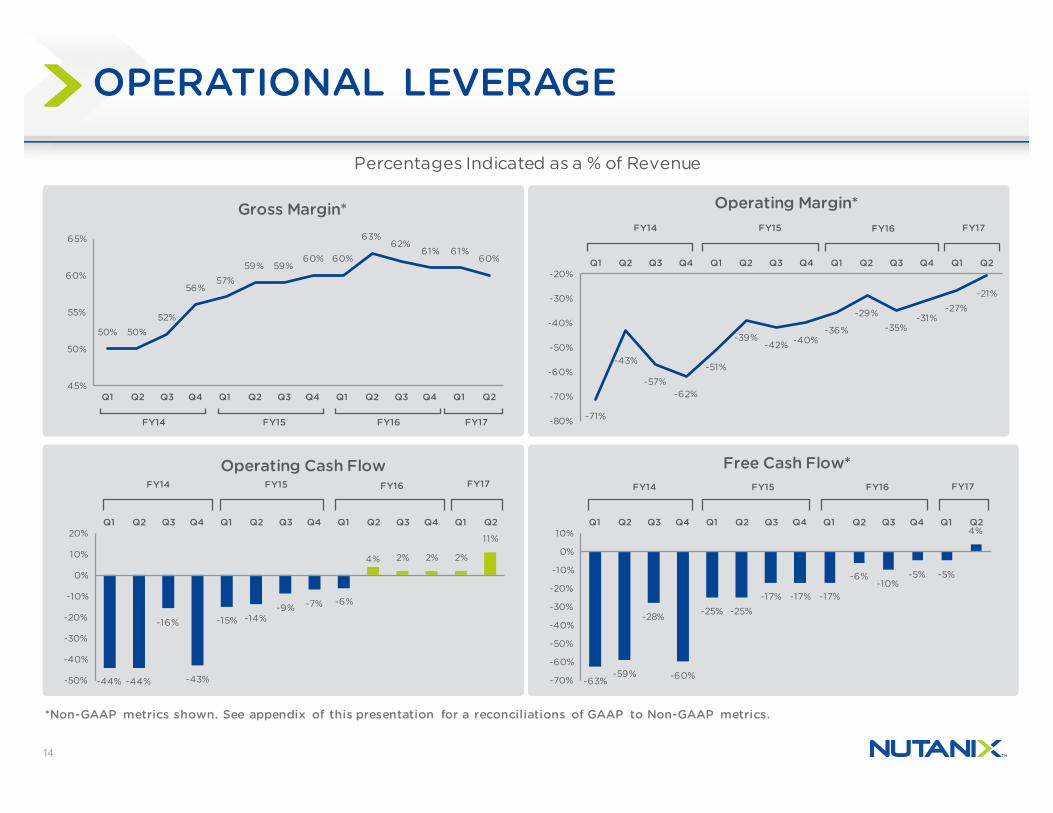
50% 50%52%
56%57%
59% 59%60% 60%
63%62%
61% 61%60%
45%
50%
55%
60%
65%
Q1 Q2 Q3 Q4 Q1 Q2 Q3 Q4 Q1 Q2 Q3 Q4 Q1 Q2
Gross Margin*
FY15 FY16FY14 -71%
-43%
-57%-62%
-51%
-39%-42% -40%
-36%
-29%-35%
-31%-27%
-21%
-80%
-70%
-60%
-50%
-40%
-30%
-20%Q1 Q2 Q3 Q4 Q1 Q2 Q3 Q4 Q1 Q2 Q3 Q4 Q1 Q2
Operating Margin*FY15 FY16 FY17FY14
-44% -44%
-16%
-43%
-15% -14%-9% -7% -6%
4% 2% 2% 2%
11%
-50%
-40%
-30%
-20%
-10%
0%
10%
20%Q1 Q2 Q3 Q4 Q1 Q2 Q3 Q4 Q1 Q2 Q3 Q4 Q1 Q2
Operating Cash FlowFY15 FY16 FY17FY14
OPERATIONAL LEVERAGE
*Non-GAAP metrics shown. See appendix of this presentation for a reconciliations of GAAP to Non-GAAP metrics.
Percentages Indicated as a % of Revenue
-63%-59%
-28%
-60%
-25% -25%-17% -17% -17%
-6%-10%
-5% -5%
4%
-70%
-60%
-50%
-40%
-30%
-20%
-10%
0%
10%Q1 Q2 Q3 Q4 Q1 Q2 Q3 Q4 Q1 Q2 Q3 Q4 Q1 Q2
Free Cash Flow*FY16FY15FY14
FY17
FY17
15
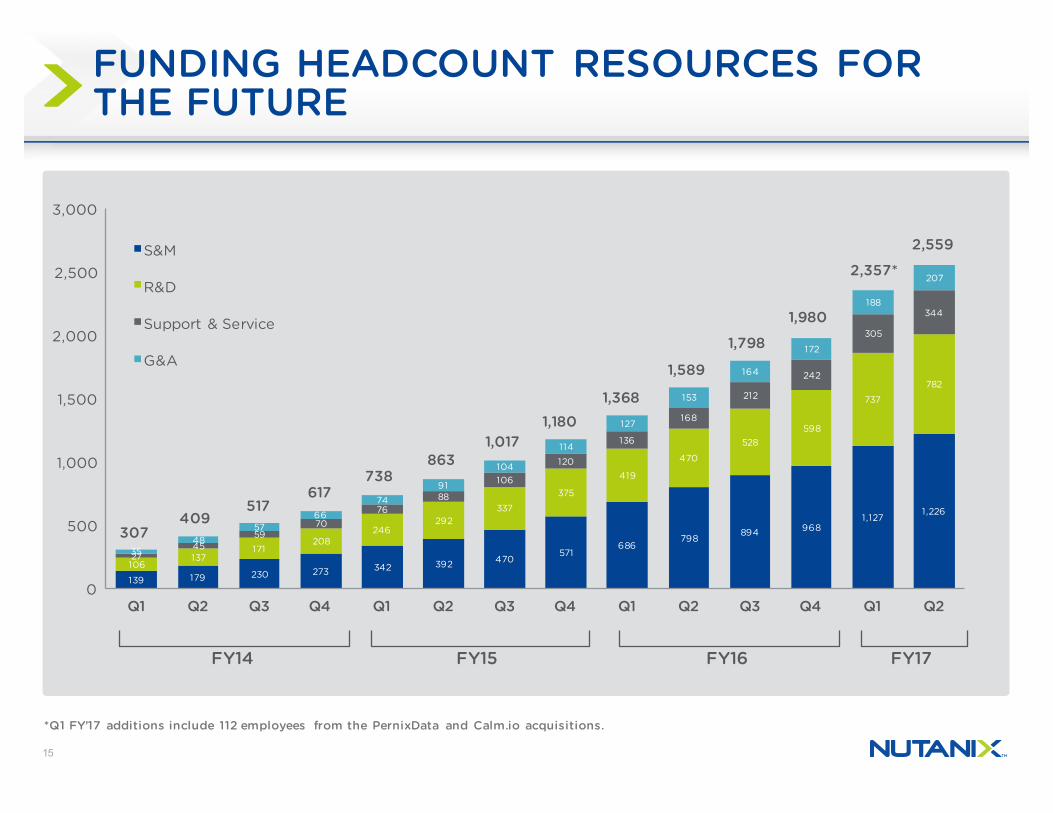
139 179 230 273 342 392 470571
686798
894 9681,127
1,226
106137
171208
246292
337
375
419
470
528598
737
782
2745
5970
7688
106
120
136
168
212
242
305
344
3548
5766
7491
104
114
127
153
164
172
188
207
0
500
1,000
1,500
2,000
2,500
3,000
Q1 Q2 Q3 Q4 Q1 Q2 Q3 Q4 Q1 Q2 Q3 Q4 Q1 Q2
S&M
R&D
Support & Service
G&A
FY16 FY17
738863
1,0171,180
1,368
1,589
1,980
2,357*
FY15
1,798
FY14
617517
409307
2,559
FUNDING HEADCOUNT RESOURCES FOR THE FUTURE
*Q1 FY’17 additions include 112 employees from the PernixData and Calm.io acquisitions.
16
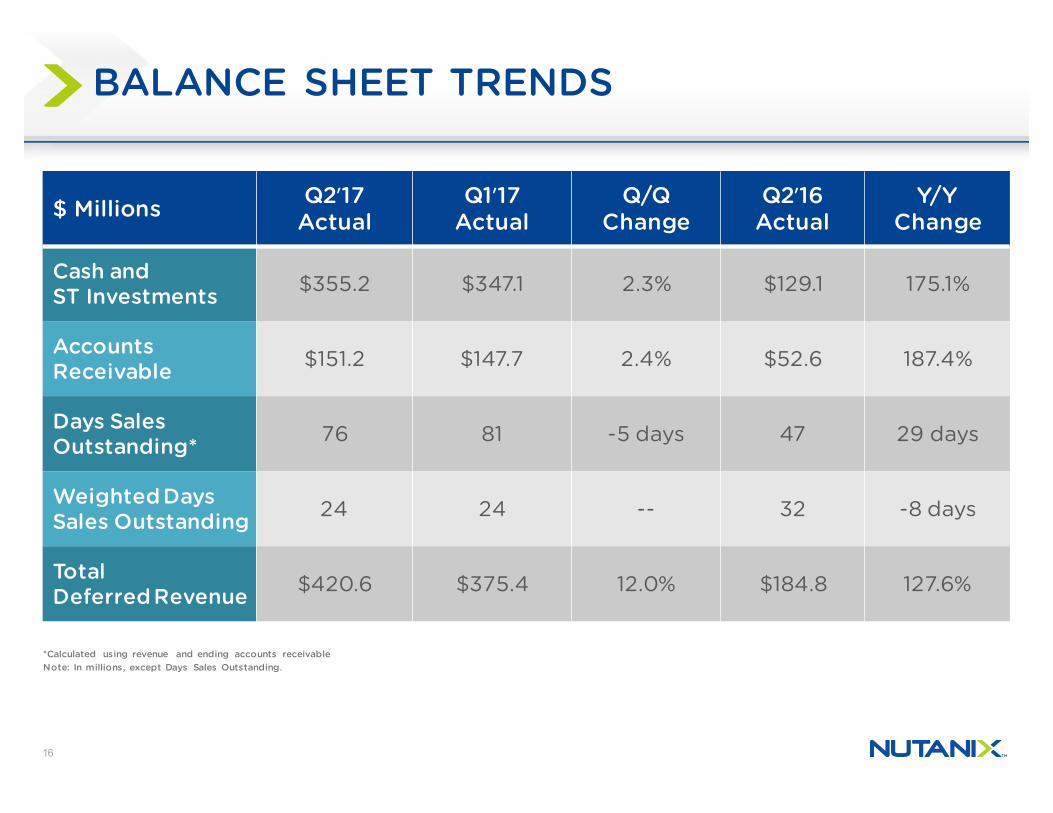
BALANCE SHEET TRENDS
$ Millions Q2ʹ17Actual
Q1ʹ17Actual
Q/QChange
Q2ʹ16Actual
Y/YChange
Cash andST Investments $355.2 $347.1 2.3% $129.1 175.1%
AccountsReceivable $151.2 $147.7 2.4% $52.6 187.4%
Days SalesOutstanding* 76 81 -5 days 47 29 days
Weighted Days Sales Outstanding 24 24 -- 32 -8 days
TotalDeferred Revenue $420.6 $375.4 12.0% $184.8 127.6%
*Calculated using revenue and ending accounts receivableNote: In millions, except Days Sales Outstanding.
17
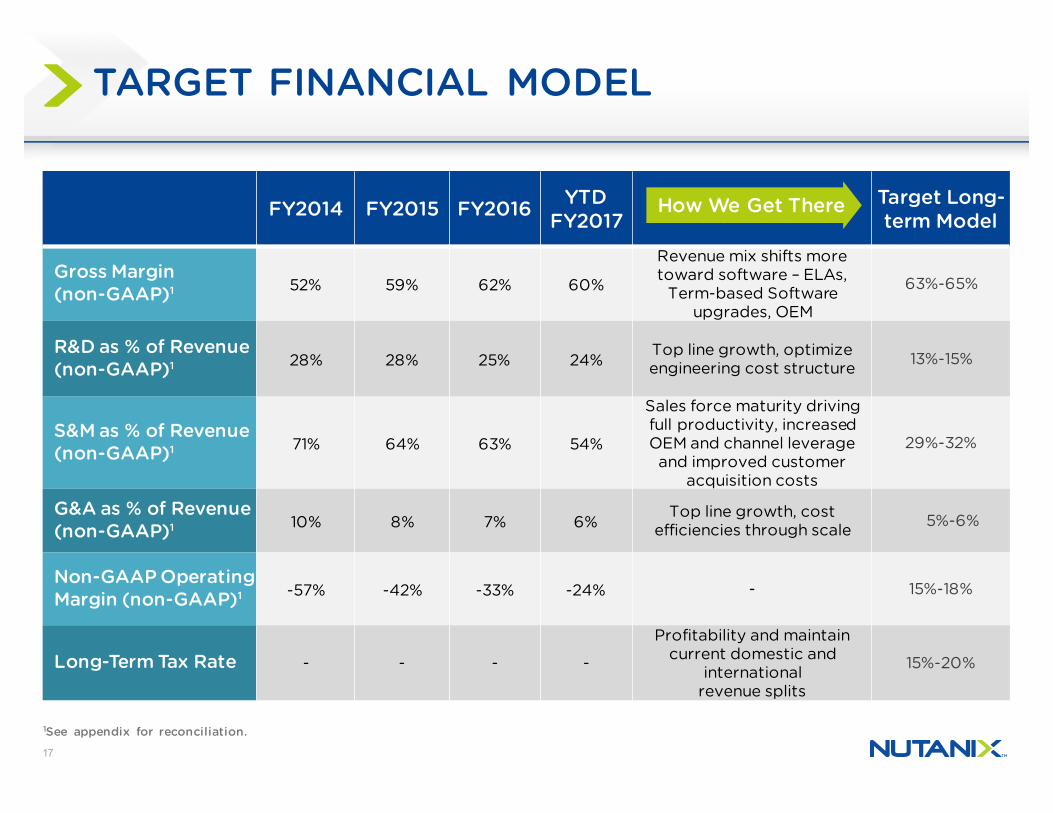
FY2014 FY2015 FY2016 YTDFY2017
Target Long-term Model
Gross Margin (non-GAAP)¹ 52% 59% 62% 60%
Revenue mix shifts more toward software – ELAs,
Term-based Software upgrades, OEM
63%-65%
R&D as % of Revenue (non-GAAP)¹ 28% 28% 25% 24%
Top line growth, optimize engineering cost structure 13%-15%
S&M as % of Revenue (non-GAAP)¹ 71% 64% 63% 54%
Sales force maturity driving full productivity, increased OEM and channel leverage and improved customer
acquisition costs
29%-32%
G&A as % of Revenue (non-GAAP)¹ 10% 8% 7% 6%
Top line growth, cost efficiencies through scale 5%-6%
Non-GAAP Operating Margin (non-GAAP)¹ -57% -42% -33% -24% - 15%-18%
Long-Term Tax Rate - - - -
Profitability and maintain current domestic and
international revenue splits
15%-20%
TARGET FINANCIAL MODEL
How We Get There
1See appendix for reconciliation.

18
GAAP to NON-GAAP RECONCILIATIONS

20
RECONCILATION OF NON-GAAP FINANCIAL MEASURES AND KEY PERFORMANCE MEASURES--2014
Q1 Q2 Q3 Q4 TotalBillingsRevenue $ 19.8 $ 32.2 $ 36.0 $ 39.1 $ 127.1 Change in deferred revenue 3.0 5.4 6.8 8.8 24.0
Total billings $ 22.8 $ 37.6 $ 42.8 $ 47.9 $ 151.1 Reconciliation of GAAP to Non-GAAPGross profit - GAAP $ 9.9 $ 16.0 $ 18.6 $ 21.7 $ 66.2 Gross margin - GAAP 50 % 50 % 52 % 55 % 52 %Stock-based compensation expense - - 0.1 0.2 0.3 Amortization of intangibles - - - - -
Gross profit - Non-GAAP $ 9.9 $ 16.0 $ 18.7 $ 21.9 $ 66.5 Gross margin - Non-GAAP 50 % 50 % 52 % 56 % 52 %Sales and marketing - GAAP $ 16.0 $ 20.5 $ 25.6 $ 30.9 $ 93.0 Stock-based compensation expense (0.3) (0.4) (0.6) (0.9) (2.2)Amortization of intangibles - - - - -
Sales and marketing - Non-GAAP $ 15.7 $ 20.1 $ 25.0 $ 30.0 $ 90.8 Research and development - GAAP $ 6.4 $ 7.7 $ 10.9 $ 13.0 $ 38.0 Stock-based compensation expense (0.4) (0.4) (0.6) (0.8) (2.2)
Research and development - Non-GAAP $ 6.0 $ 7.3 $ 10.3 $ 12.2 $ 35.8 General and administrative - GAAP $ 2.4 $ 2.6 $ 4.1 $ 4.4 $ 13.5 Stock-based compensation expense (0.1) (0.2) (0.3) (0.6) (1.2)Change in fair value of contingent consideration - - - - -Acquisition related costs - - - - -
General and administrative - Non-GAAP $ 2.3 $ 2.4 $ 3.8 $ 3.8 $ 12.3 Operating expenses - GAAP $ 24.8 $ 30.8 $ 40.6 $ 48.3 $ 144.5 Stock-based compensation expense (0.8) (1.0) (1.5) (2.3) (5.6)Change in fair value of contingent consideration - - - - -Acquisition related costs - - - - -Amortization of intangibles - - - - -
Operating expenses - Non-GAAP $ 24.0 $ 29.8 $ 39.1 $ 46.0 $ 138.9 Loss from operations - GAAP $ (14.9) $ (14.8) $ (22.0) $ (26.6) $ (78.3)Operating Margin - GAAP (75)% (46)% (61)% (68)% (62)%Stock-based compensation expense 0.8 1.0 1.6 2.5 5.9 Change in fair value of contingent consideration - - - - -Acquisition related costs - - - - -Amortization of intangibles - - - - -
Loss from operations - Non-GAAP $ (14.1) $ (13.8) $ (20.4) $ (24.1) $ (72.4)Operating Margin - Non-GAAP (71)% (43)% (57)% (62)% (57)%Net loss - GAAP $ (15.3) $ (15.8) $ (23.5) $ (29.4) $ (84.0)Stock-based compensation expense 0.8 1.0 1.6 2.5 5.9 Change in fair value of contingent consideration - - - - -Acquisition related costs - - - - -Amortization of intangibles - - - - -Loss on debt extinguishment - - - - -Warrant MtM 0.2 0.4 1.3 2.4 4.3 Income tax-related adjustments - - - - -
Net loss - Non-GAAP $ (14.3) $ (14.4) $ (20.6) $ (24.5) $ (73.8)Net cash (used in) provided by operating activities $ (8.8) $ (14.3) $ (5.8) $ (16.9) $ (45.7)Purchases of PPE (3.7) (4.7) (4.2) (6.4) (19.0)
Free cash flow $ (12.4) $ (19.0) $ (10.0) $ (23.3) $ (64.7)(63)% (59)% (28)% (60)% (51)%
21
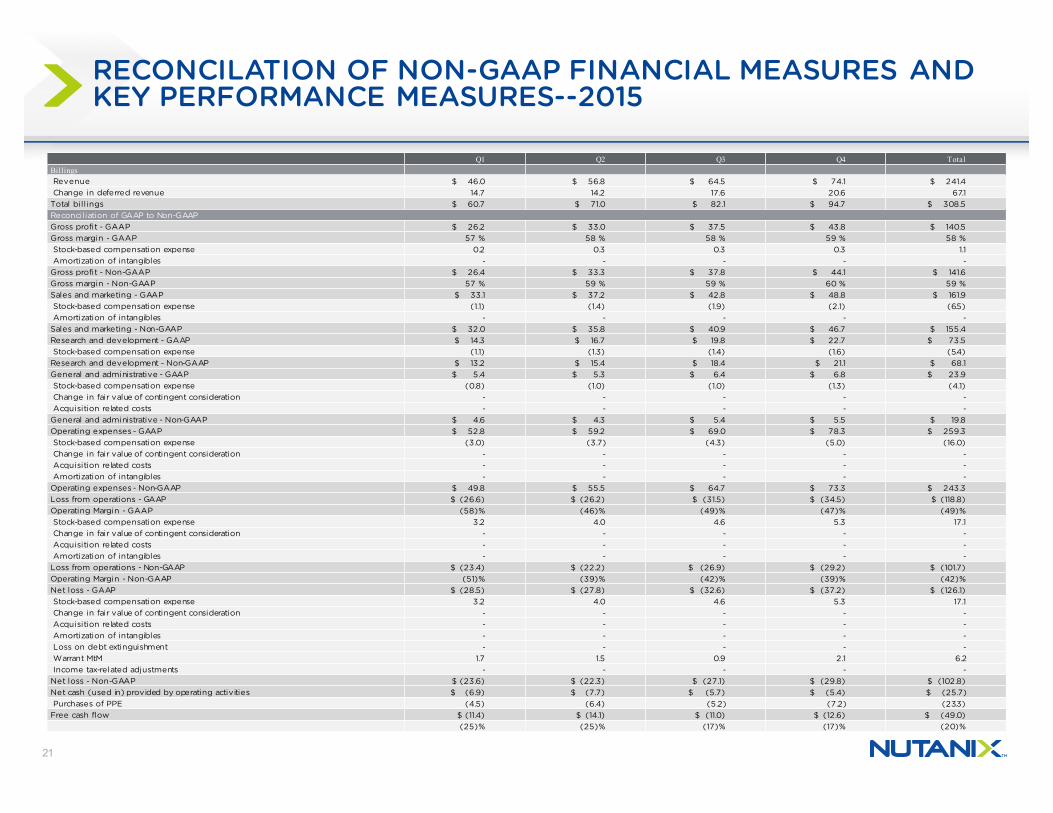
RECONCILATION OF NON-GAAP FINANCIAL MEASURES AND KEY PERFORMANCE MEASURES--2015
Q1 Q2 Q3 Q4 TotalBillingsRevenue $ 46.0 $ 56.8 $ 64.5 $ 74.1 $ 241.4 Change in deferred revenue 14.7 14.2 17.6 20.6 67.1
Total billings $ 60.7 $ 71.0 $ 82.1 $ 94.7 $ 308.5 Reconciliation of GAAP to Non-GAAPGross profit - GAAP $ 26.2 $ 33.0 $ 37.5 $ 43.8 $ 140.5 Gross margin - GAAP 57 % 58 % 58 % 59 % 58 %Stock-based compensation expense 0.2 0.3 0.3 0.3 1.1 Amortization of intangibles - - - - -
Gross profit - Non-GAAP $ 26.4 $ 33.3 $ 37.8 $ 44.1 $ 141.6 Gross margin - Non-GAAP 57 % 59 % 59 % 60 % 59 %Sales and marketing - GAAP $ 33.1 $ 37.2 $ 42.8 $ 48.8 $ 161.9 Stock-based compensation expense (1.1) (1.4) (1.9) (2.1) (6.5)Amortization of intangibles - - - - -
Sales and marketing - Non-GAAP $ 32.0 $ 35.8 $ 40.9 $ 46.7 $ 155.4 Research and development - GAAP $ 14.3 $ 16.7 $ 19.8 $ 22.7 $ 73.5 Stock-based compensation expense (1.1) (1.3) (1.4) (1.6) (5.4)
Research and development - Non-GAAP $ 13.2 $ 15.4 $ 18.4 $ 21.1 $ 68.1 General and administrative - GAAP $ 5.4 $ 5.3 $ 6.4 $ 6.8 $ 23.9 Stock-based compensation expense (0.8) (1.0) (1.0) (1.3) (4.1)Change in fair value of contingent consideration - - - - -Acquisition related costs - - - - -
General and administrative - Non-GAAP $ 4.6 $ 4.3 $ 5.4 $ 5.5 $ 19.8 Operating expenses - GAAP $ 52.8 $ 59.2 $ 69.0 $ 78.3 $ 259.3 Stock-based compensation expense (3.0) (3.7) (4.3) (5.0) (16.0)Change in fair value of contingent consideration - - - - -Acquisition related costs - - - - -Amortization of intangibles - - - - -
Operating expenses - Non-GAAP $ 49.8 $ 55.5 $ 64.7 $ 73.3 $ 243.3 Loss from operations - GAAP $ (26.6) $ (26.2) $ (31.5) $ (34.5) $ (118.8)Operating Margin - GAAP (58)% (46)% (49)% (47)% (49)%Stock-based compensation expense 3.2 4.0 4.6 5.3 17.1 Change in fair value of contingent consideration - - - - -Acquisition related costs - - - - -Amortization of intangibles - - - - -
Loss from operations - Non-GAAP $ (23.4) $ (22.2) $ (26.9) $ (29.2) $ (101.7)Operating Margin - Non-GAAP (51)% (39)% (42)% (39)% (42)%Net loss - GAAP $ (28.5) $ (27.8) $ (32.6) $ (37.2) $ (126.1)Stock-based compensation expense 3.2 4.0 4.6 5.3 17.1 Change in fair value of contingent consideration - - - - -Acquisition related costs - - - - -Amortization of intangibles - - - - -Loss on debt extinguishment - - - - -Warrant MtM 1.7 1.5 0.9 2.1 6.2 Income tax-related adjustments - - - - -
Net loss - Non-GAAP $ (23.6) $ (22.3) $ (27.1) $ (29.8) $ (102.8)Net cash (used in) provided by operating activities $ (6.9) $ (7.7) $ (5.7) $ (5.4) $ (25.7)Purchases of PPE (4.5) (6.4) (5.2) (7.2) (23.3)
Free cash flow $ (11.4) $ (14.1) $ (11.0) $ (12.6) $ (49.0)(25)% (25)% (17)% (17)% (20)%
22
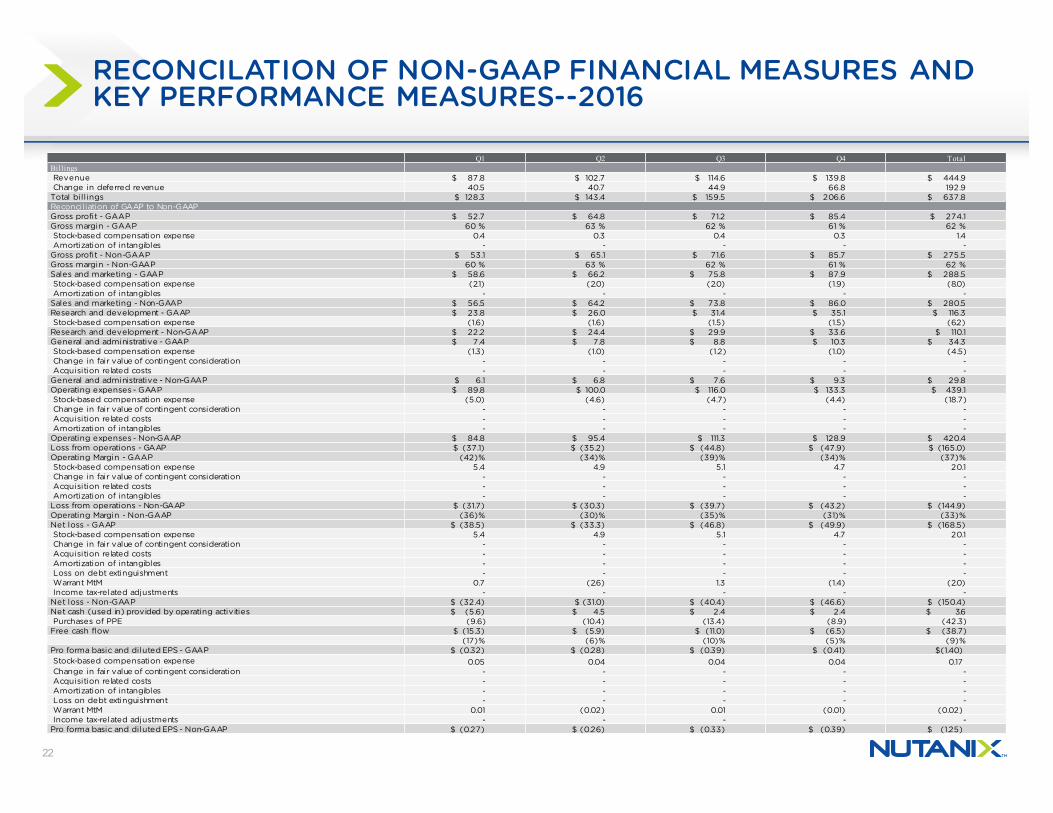
RECONCILATION OF NON-GAAP FINANCIAL MEASURES AND KEY PERFORMANCE MEASURES--2016
Q1 Q2 Q3 Q4 TotalBillingsRevenue $ 87.8 $ 102.7 $ 114.6 $ 139.8 $ 444.9 Change in deferred revenue 40.5 40.7 44.9 66.8 192.9
Total billings $ 128.3 $ 143.4 $ 159.5 $ 206.6 $ 637.8 Reconciliation of GAAP to Non-GAAPGross profit - GAAP $ 52.7 $ 64.8 $ 71.2 $ 85.4 $ 274.1 Gross margin - GAAP 60 % 63 % 62 % 61 % 62 %Stock-based compensation expense 0.4 0.3 0.4 0.3 1.4 Amortization of intangibles - - - - -
Gross profit - Non-GAAP $ 53.1 $ 65.1 $ 71.6 $ 85.7 $ 275.5 Gross margin - Non-GAAP 60 % 63 % 62 % 61 % 62 %Sales and marketing - GAAP $ 58.6 $ 66.2 $ 75.8 $ 87.9 $ 288.5 Stock-based compensation expense (2.1) (2.0) (2.0) (1.9) (8.0)Amortization of intangibles - - - - -
Sales and marketing - Non-GAAP $ 56.5 $ 64.2 $ 73.8 $ 86.0 $ 280.5 Research and development - GAAP $ 23.8 $ 26.0 $ 31.4 $ 35.1 $ 116.3 Stock-based compensation expense (1.6) (1.6) (1.5) (1.5) (6.2)
Research and development - Non-GAAP $ 22.2 $ 24.4 $ 29.9 $ 33.6 $ 110.1 General and administrative - GAAP $ 7.4 $ 7.8 $ 8.8 $ 10.3 $ 34.3 Stock-based compensation expense (1.3) (1.0) (1.2) (1.0) (4.5)Change in fair value of contingent consideration - - - - -Acquisition related costs - - - - -
General and administrative - Non-GAAP $ 6.1 $ 6.8 $ 7.6 $ 9.3 $ 29.8 Operating expenses - GAAP $ 89.8 $ 100.0 $ 116.0 $ 133.3 $ 439.1 Stock-based compensation expense (5.0) (4.6) (4.7) (4.4) (18.7)Change in fair value of contingent consideration - - - - -Acquisition related costs - - - - -Amortization of intangibles - - - - -
Operating expenses - Non-GAAP $ 84.8 $ 95.4 $ 111.3 $ 128.9 $ 420.4 Loss from operations - GAAP $ (37.1) $ (35.2) $ (44.8) $ (47.9) $ (165.0)Operating Margin - GAAP (42)% (34)% (39)% (34)% (37)%Stock-based compensation expense 5.4 4.9 5.1 4.7 20.1 Change in fair value of contingent consideration - - - - -Acquisition related costs - - - - -Amortization of intangibles - - - - -
Loss from operations - Non-GAAP $ (31.7) $ (30.3) $ (39.7) $ (43.2) $ (144.9)Operating Margin - Non-GAAP (36)% (30)% (35)% (31)% (33)%Net loss - GAAP $ (38.5) $ (33.3) $ (46.8) $ (49.9) $ (168.5)Stock-based compensation expense 5.4 4.9 5.1 4.7 20.1 Change in fair value of contingent consideration - - - - -Acquisition related costs - - - - -Amortization of intangibles - - - - -Loss on debt extinguishment - - - - -Warrant MtM 0.7 (2.6) 1.3 (1.4) (2.0)Income tax-related adjustments - - - - -
Net loss - Non-GAAP $ (32.4) $ (31.0) $ (40.4) $ (46.6) $ (150.4)Net cash (used in) provided by operating activities $ (5.6) $ 4.5 $ 2.4 $ 2.4 $ 3.6 Purchases of PPE (9.6) (10.4) (13.4) (8.9) (42.3)
Free cash flow $ (15.3) $ (5.9) $ (11.0) $ (6.5) $ (38.7)(17)% (6)% (10)% (5)% (9)%
Pro forma basic and diluted EPS - GAAP $ (0.32) $ (0.28) $ (0.39) $ (0.41) $(1.40)Stock-based compensation expense 0.05 0.04 0.04 0.04 0.17Change in fair value of contingent consideration - - - - -Acquisition related costs - - - - -Amortization of intangibles - - - - -Loss on debt extinguishment - - - - -Warrant MtM 0.01 (0.02) 0.01 (0.01) (0.02)Income tax-related adjustments - - - - -
Pro forma basic and diluted EPS - Non-GAAP $ (0.27) $ (0.26) $ (0.33) $ (0.39) $ (1.25)
23
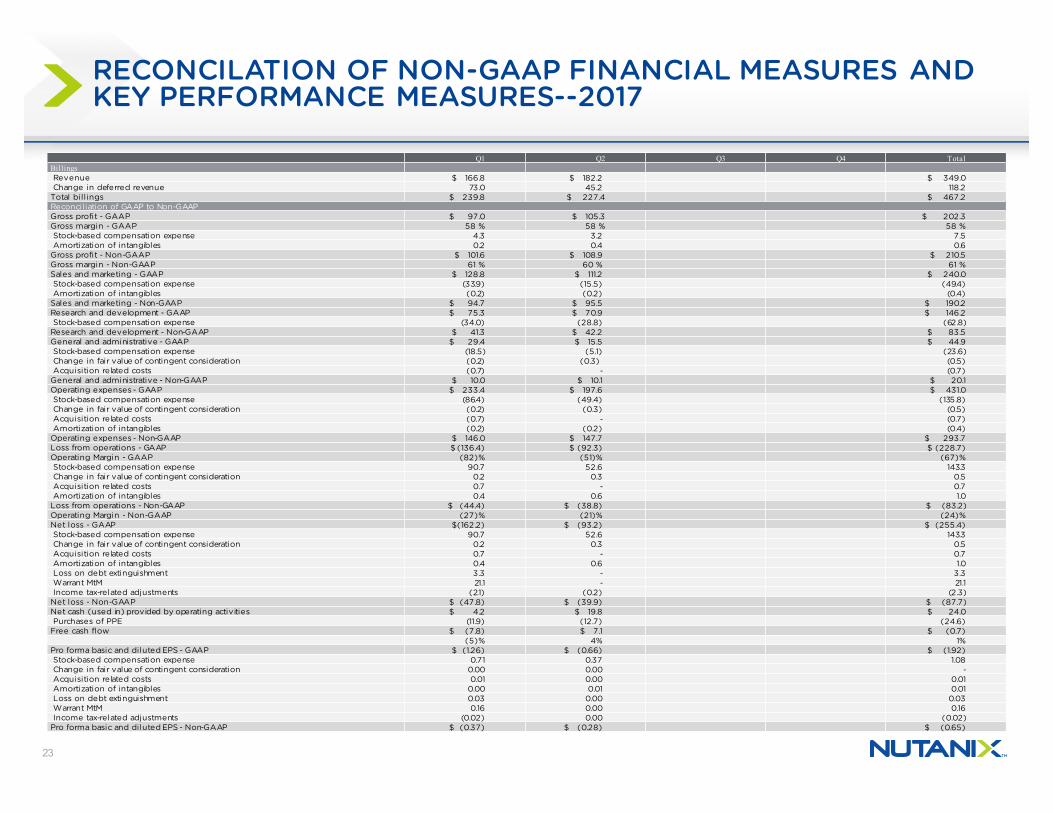
RECONCILATION OF NON-GAAP FINANCIAL MEASURES AND KEY PERFORMANCE MEASURES--2017
Q1 Q2 Q3 Q4 TotalBillingsRevenue $ 166.8 $ 182.2 $ 349.0 Change in deferred revenue 73.0 45.2 118.2
Total billings $ 239.8 $ 227.4 $ 467.2 Reconciliation of GAAP to Non-GAAPGross profit - GAAP $ 97.0 $ 105.3 $ 202.3 Gross margin - GAAP 58 % 58 % 58 %Stock-based compensation expense 4.3 3.2 7.5 Amortization of intangibles 0.2 0.4 0.6
Gross profit - Non-GAAP $ 101.6 $ 108.9 $ 210.5 Gross margin - Non-GAAP 61 % 60 % 61 %Sales and marketing - GAAP $ 128.8 $ 111.2 $ 240.0 Stock-based compensation expense (33.9) (15.5) (49.4)Amortization of intangibles (0.2) (0.2) (0.4)
Sales and marketing - Non-GAAP $ 94.7 $ 95.5 $ 190.2 Research and development - GAAP $ 75.3 $ 70.9 $ 146.2 Stock-based compensation expense (34.0) (28.8) (62.8)
Research and development - Non-GAAP $ 41.3 $ 42.2 $ 83.5 General and administrative - GAAP $ 29.4 $ 15.5 $ 44.9 Stock-based compensation expense (18.5) (5.1) (23.6)Change in fair value of contingent consideration (0.2) (0.3) (0.5)Acquisition related costs (0.7) - (0.7)
General and administrative - Non-GAAP $ 10.0 $ 10.1 $ 20.1 Operating expenses - GAAP $ 233.4 $ 197.6 $ 431.0 Stock-based compensation expense (86.4) (49.4) (135.8)Change in fair value of contingent consideration (0.2) (0.3) (0.5)Acquisition related costs (0.7) - (0.7)Amortization of intangibles (0.2) (0.2) (0.4)
Operating expenses - Non-GAAP $ 146.0 $ 147.7 $ 293.7 Loss from operations - GAAP $ (136.4) $ (92.3) $ (228.7)Operating Margin - GAAP (82)% (51)% (67)%Stock-based compensation expense 90.7 52.6 143.3 Change in fair value of contingent consideration 0.2 0.3 0.5 Acquisition related costs 0.7 - 0.7 Amortization of intangibles 0.4 0.6 1.0
Loss from operations - Non-GAAP $ (44.4) $ (38.8) $ (83.2)Operating Margin - Non-GAAP (27)% (21)% (24)%Net loss - GAAP $(162.2) $ (93.2) $ (255.4)Stock-based compensation expense 90.7 52.6 143.3 Change in fair value of contingent consideration 0.2 0.3 0.5 Acquisition related costs 0.7 - 0.7 Amortization of intangibles 0.4 0.6 1.0 Loss on debt extinguishment 3.3 - 3.3 Warrant MtM 21.1 - 21.1 Income tax-related adjustments (2.1) (0.2) (2.3)
Net loss - Non-GAAP $ (47.8) $ (39.9) $ (87.7)Net cash (used in) provided by operating activities $ 4.2 $ 19.8 $ 24.0 Purchases of PPE (11.9) (12.7) (24.6)
Free cash flow $ (7.8) $ 7.1 $ (0.7) (5)% 4% 1%
Pro forma basic and diluted EPS - GAAP $ (1.26) $ (0.66) $ (1.92)Stock-based compensation expense 0.71 0.37 1.08Change in fair value of contingent consideration 0.00 0.00 -Acquisition related costs 0.01 0.00 0.01 Amortization of intangibles 0.00 0.01 0.01 Loss on debt extinguishment 0.03 0.00 0.03 Warrant MtM 0.16 0.00 0.16 Income tax-related adjustments (0.02) 0.00 (0.02)
Pro forma basic and diluted EPS - Non-GAAP $ (0.37) $ (0.28) $ (0.65)
24 © 2017 Nutanix, Inc. All rights reserved. Nutanix and the Nutanix logo are trademarks of Nutanix, Inc., registered in the United States and other countries.


![FY17 2nd Quarter Financial Results [IFRS] · 2. FY17 2nd Quarter Financial Results [IFRS] 1. FY17 Q1-Q2 (Highlights) 4. Reference. 3. FY17 Outlook . 2.Status of Progress on the Mid-Term](https://img.pdfslide.net/doc/110x75/5f1e629b38af5e5e6a417bd6/fy17-2nd-quarter-financial-results-ifrs-2-fy17-2nd-quarter-financial-results.jpg)