Embed Size (px)
Citation preview

1. All Rights Reserved.21 October 2015© 3M
2015 Third Quarter Business Review
October 22, 2015
(unaudited)

2. All Rights Reserved.21 October 2015© 3M
2016 outlook meeting
December 15, 2015
Conference call, 8 a.m. CST/9 a.m. EST
Investor day
March 29, 2016
Location: 3M headquarters, St. Paul, MN
2016 earnings conference calls
January 26
April 26
July 26
October 25
Upcoming Investor Events
3. All Rights Reserved.21 October 2015© 3M
Forward Looking StatementThis presentation contains forward-looking information about 3M's financial results and estimates and business prospects thatinvolve substantial risks and uncertainties. You can identify these statements by the use of words such as "anticipate,""estimate,” "expect," “aim," "project," "intend," "plan," "believe," "will," “should," “could," "target," "forecast" and other wordsand terms of similar meaning in connection with any discussion of future operating or financial performance or business plansor prospects. Among the factors that could cause actual results to differ materially are the following: (1) worldwide economicand capital markets conditions and other factors beyond 3M's control, including natural and other disasters affecting theoperations of 3M or its customers and suppliers; (2) 3M's credit ratings and its cost of capital; (3) competitive conditions andcustomer preferences; (4) foreign currency exchange rates and fluctuations in those rates; (5) the timing and marketacceptance of new product offerings; (6) the availability and cost of purchased components, compounds, raw materials andenergy (including oil and natural gas and their derivatives) due to shortages, increased demand or supply interruptions(including those caused by natural and other disasters and other events); (7) the impact of acquisitions, strategic alliances,divestitures, and other unusual events resulting from portfolio management actions and other evolving business strategies, andpossible organizational restructuring; (8) generating fewer productivity improvements than estimated; (9) unanticipatedproblems or delays with the phased implementation of a global enterprise resource planning (ERP) system, or security breachesand other disruptions to 3M's information technology infrastructure; and (10) legal proceedings, including significantdevelopments that could occur in the legal and regulatory proceedings described in 3M's Annual Report on Form 10-K for theyear ended December 31, 2014, and its subsequent quarterly reports on Form 10-Q (the “Reports”). Changes in suchassumptions or factors could produce significantly different results. A further description of these factors is located in theReports under “Cautionary Note Concerning Factors That May Affect Future Results” and “Risk Factors” in Part I, Items 1 and1A (Annual Report) and in Part I, Item 2 and Part II, Item 1A (Quarterly Report). The information contained in this presentation isas of the date indicated. 3M assumes no obligation to update any forward-looking statements contained in this presentation asa result of new information or future events or developments.

4. All Rights Reserved.21 October 2015© 3M
GAAP EPS of $2.05, up 3.5% year-on-year
Sales of $7.7 billion, down 5.2% in dollar terms
Organic local currency +1.2%
Positive growth across all geographic areas
Acquisitions, net of divestitures, increased sales by 1.0%
FX reduced sales by 7.4%
Operating margins of 24.3%, up 90 basis points year-on-year
All business groups over 22%
Returned $2.2 billion to shareholders via dividends and gross share repurchases
Q3 2015 Highlights
Refer to 3M’s October 22, 2015 press release for full details.

5. All Rights Reserved.21 October 2015© 3M
Investing in R&D and cap-ex to drive organic growth
Portfolio actions
Acquisitions (closed in Q3): Capital Safety; Polypore’s Separations Media business
Divestitures (closing in Q4): Library Systems; License plate converting business in France
Announced intent to pursue strategic alternatives for Health Information Systems business
Restructuring actions
Expected reduction of 1,500 positions globally
Lowers 2016 pre-tax operating costs by approximately $130 million
Fourth-quarter pre-tax charge of approximately $100 million, or $0.13 per share
Positioning 3M for the Future

6. All Rights Reserved.21 October 2015© 3M
Organic local currency:
U.S. +1.5%
Asia Pacific +0.4%
China/Hong Kong -2%
Japan +1%
EMEA +1.5%
West Europe flat
Latin America/Canada +2.3%
Mexico +13%, Brazil -2%
FX reduced sales by 7.4%
Euro -15%, Yen -14%, Real -37%
($M) US APAC EMEA LAC
Organic volume +1.2% +0.4% -0.6% -2.7%
Price +0.3% 0.0% +2.1% +5.0%
Organic local currency +1.5% +0.4% +1.5% +2.3%
Acq/div +1.5% +0.4% +0.8% +1.0%
FX ----- -6.9% -14.4% -21.1%
Total growth +3.0% -6.1% -12.1% -17.8%
Q3 2015 Sales Recap
-5.2%
-7.4%
1.0%
1.2%
1.1%
0.1%
Total
FX
Acquisition/divestiture
Organic local currency
Price
Organic volume
Worldwide Sales Change Due To:

7. All Rights Reserved.21 October 2015© 3M
Q3 15
Pension/OPEB
Strategic investments
Acquisitions*
FX
Productivity/other
Price/raw materials
Organic volume
Q3 14
Operating margin of 24.3%, up 0.9 percentage points
+0.2%
+1.7%
+0.2%
0.0%
($M)Q3
2014Q3
2015 Change
Sales $8,137 $7,712 -5.2%
Gross profit $3,932 $3,835 -2.5%
% to sales 48.3% 49.7% +1.4 pts
SG&A $1,597 $1,530 -4.2%
% to sales 19.6% 19.8% +0.2 pts
R&D & related $434 $429 -1.0%
% to sales 5.3% 5.6% +0.3 pts
Operating income $1,901 $1,876 -1.3%
% to sales 23.4% 24.3% +0.9 pts
Net income $1,303 $1,296 -0.5%
Earnings per share $1.98 $2.05 +3.5%
23.4%
-0.6%
-0.1%
-0.5%
24.3%
Refer to 3M’s October 22, 2015 press release for full details.
Q3 2015 P&L
*Includes impact from Ivera Medical, Capital Safety and Polypore’s Separations Media business.

8. All Rights Reserved.21 October 2015© 3M
$1.98
$2.05
Q3 2014 Q3 2015
+3.5% Q3 2014 $1.98
Organic growth, margin expansion
+$0.11 Includes -$0.04 headwind from
pension/OPEB expense
Acquisitions -$0.04 Includes impact from Capital Safety
and Polypore Separations Media business
FX -$0.10 Pre-tax earnings impact of ~$95M
Tax rate +$0.02 Q3 2015 29.6% vs. Q3 2014 30.3%
Shares outstanding +$0.08 Average diluted shares down 4%
Q3 2015 $2.05
Q3 2015 GAAP EPS

9. All Rights Reserved.21 October 2015© 3M
($M)Q3
2014Q3
2015 ChangeQ3 YTD
2014Q3 YTD
2015 Change
Operating cash flow $1,711 $1,664 ($47) $4,443 $4,082 ($361)
Capital expenditures ($369) ($354) $15 ($1,003) ($1,015) ($12) Expecting FY 2015 of $1.4B to $1.5B
Free cash flow $1,342 $1,310 ($32) $3,440 $3,067 ($373)
Free cash flow conversion 103% 101% -2 pts 91% 81% -10 pts Expecting FY 2015 of 95% to 100%
Dividends $550 $635 $85 $1,672 $1,933 $261
Gross share repurchase $1,239 $1,523 $284 $4,373 $4,104 ($269) Expecting FY 2015 of $5B to $5.5B
Total cash to shareholders $1,789 $2,158 $369 $6,045 $6,037 ($8)
Refer to 3M’s October 22, 2015 press release for full details.
Q3 2015 Cash Flow

10. All Rights Reserved.21 October 2015© 3M
Organic local currency growth:
By business: growth led by automotive OEM, 3M purification, abrasives and industrial adhesives and tapes; advanced materials declined
By area: sales grew in Latin America/Canada, Asia Pacific and EMEA; sales declined in the U.S.
Closed acquisition of Polypore’s Separations Media business, which adds “ultra” filtration capabilities to 3M’s existing core filtration platform
($M)Q3
2014Q3
2015%
Growth
Sales $2,772 $2,575 -7.1%
Organic local currency +0.2%
Acquisition/divestiture +0.7%
FX -8.0%
Operating income $616 $580 -5.8%
Operating marginEx-acquisition
22.2%22.2%
22.5%23.1%*
+0.3 pts+0.9 pts
Industrial
*Excludes impact of Polypore’s Separations Media business which closed August 26, 2015.

11. All Rights Reserved.21 October 2015© 3M
Organic local currency growth:
By business: sales grew in roofing granules, commercial solutions and personal safety; traffic safety and security declined
By area: sales increased in Asia Pacific, EMEA and the U.S.; sales declined in Latin America/Canada
Closed acquisition of Capital Safety, a leading global provider of fall protection equipment
Safety & Graphics
($M)Q3
2014Q3
2015%
Growth
Sales $1,448 $1,417 -2.2%
Organic local currency +2.9%
Acquisition/divestiture +4.2%
FX -9.3%
Operating income $340 $324 -4.8%
Operating marginEx-acquisition
23.5%23.5%
22.9%24.8%*
-0.6 pts+1.3 pts
*Excludes impact of Capital Safety acquisition which closed August 3, 2015.

12. All Rights Reserved.21 October 2015© 3M
Health Care
($M)Q3
2014Q3
2015%
Growth
Sales $1,390 $1,346 -3.2%
Organic local currency +3.7%
Acquisition/divestiture +0.9%
FX -7.8%
Operating income $432 $432 +0.1%
Operating margin 31.0% 32.1% +1.1 pts
Organic local currency growth:
By business: sales grew in health information systems, food safety, critical and chronic care, oral care and infection prevention; drug delivery systems declined year-on-year
By area: sales grew in all areas led by Latin America/Canada, Asia Pacific and the U.S.
Food safety business announced next generation of 3M™ Molecular Detection Assays for detecting foodborne pathogens
Ivera Medical integration on track; business exceeding sales and profit objectives

13. All Rights Reserved.21 October 2015© 3M
Electronics & Energy
($M)Q3
2014Q3
2015%
Growth
Sales $1,500 $1,378 -8.1%
Organic local currency -2.8%
Acquisition/divestiture -0.7%
FX -4.6%
Operating income $338 $342 +1.4%
Operating margin 22.5% 24.9% +2.4 pts
Organic local currency growth:
By business: electronic-related sales declined 3% (sales grew in electronics materials solutions and declined in display materials and systems); energy-related sales declined 2% (growth in telecom was offset by declines in electrical markets and renewable energy)
By area: sales grew in EMEA; sales declined in the U.S., Latin America/Canada and Asia Pacific
3M ACCR overhead conductor business grew double-digits with project installations in the U.S. and U.K.
14. All Rights Reserved.21 October 2015© 3M
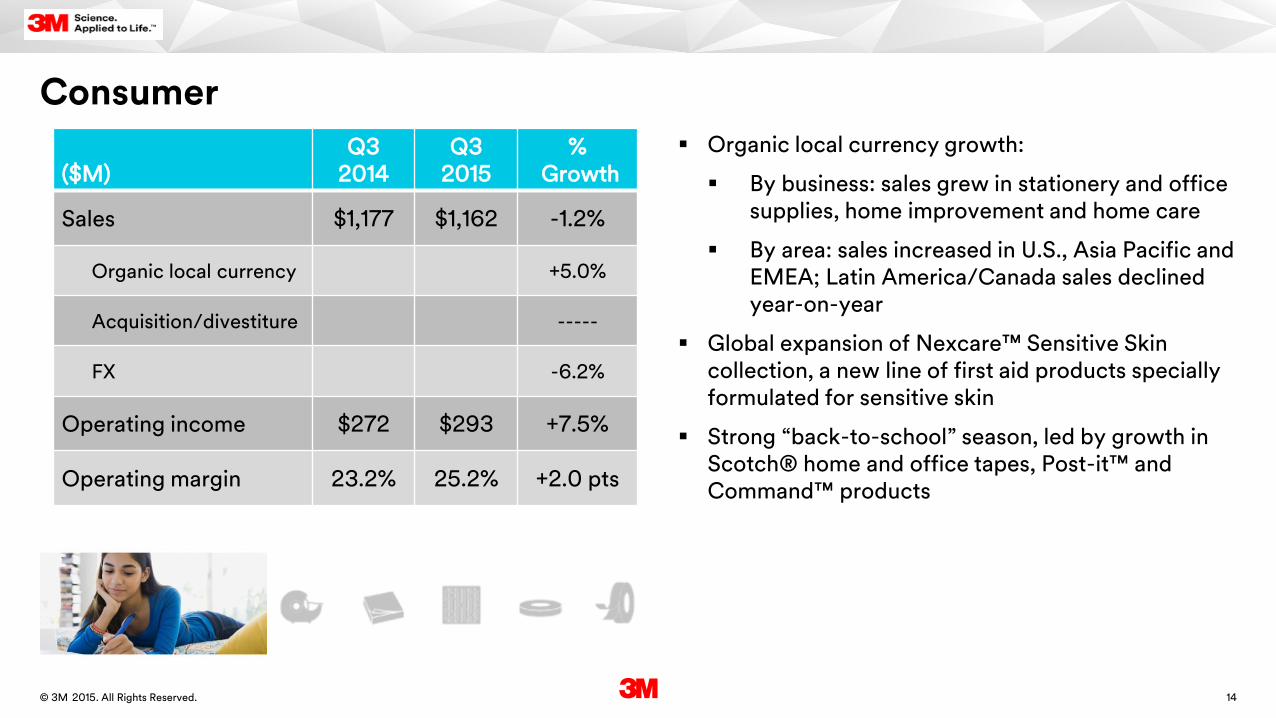
Consumer
($M)Q3
2014Q3
2015%
Growth
Sales $1,177 $1,162 -1.2%
Organic local currency +5.0%
Acquisition/divestiture -----
FX -6.2%
Operating income $272 $293 +7.5%
Operating margin 23.2% 25.2% +2.0 pts
Organic local currency growth:
By business: sales grew in stationery and office supplies, home improvement and home care
By area: sales increased in U.S., Asia Pacific and EMEA; Latin America/Canada sales declined year-on-year
Global expansion of Nexcare™ Sensitive Skin collection, a new line of first aid products specially formulated for sensitive skin
Strong “back-to-school” season, led by growth in Scotch® home and office tapes, Post-it™ and Command™ products

15. All Rights Reserved.21 October 2015© 3M
Updating 2015 Planning Estimates
Q2 Earnings Call7/23/15
Today10/22/15
Sales growth:
Organic local currency
FX
M&A
+2.5% to +4%
-6% to -7%
NA
+1.5% to +2%
-7%
+0.5%
EPS:
GAAP
Excluding restructuring
$7.73 to $7.93*
NA
$7.60 to $7.65
$7.73 to $7.78
Tax Rate 28.5% to 29.5% 28.5% to 29.5%
Free cash flow conversion 90% to 100% 95% to 100%
*3M adjusted its GAAP earnings expectations on August 26, 2015 to include impact from Capital Safety and Polypore’s Separations Media business acquisitions.

16. All Rights Reserved.21 October 2015© 3M
Q & A

17. All Rights Reserved.21 October 2015© 3M
s
Appendix

18. All Rights Reserved.21 October 2015© 3M
Business Segment Information
Net Sales Operating Income Net Sales Operating Income
Business Groups Q3 2014 Q3 2015 Q3 2014 Q3 2015 YTD 2014 YTD 2015 YTD 2014 YTD 2015
Industrial $2,772 $2,575 $616 $580 $8,363 $7,867 $1,851 $1,787
Safety & Graphics $1,448 $1,417 $340 $324 $4,365 $4,221 $1,011 $1,023
Health Care $1,390 $1,346 $432 $432 $4,180 $4,039 $1,293 $1,280
Electronics & Energy $1,500 $1,378 $338 $342 $4,233 $4,010 $858 $902
Consumer $1,177 $1,162 $272 $293 $3,395 $3,321 $741 $792
Corporate and Unallocated $3 $2 ($63) ($58) $5 $0 ($184) ($232)
Elimination of Dual Credit ($153) ($168) ($34) ($37) ($439) ($482) ($97) ($106)
Total $8,137 $7,712 $1,901 $1,876 $24,102 $22,976 $5,473 $5,446