Embed Size (px)
Citation preview

Q3 2015 results presentation
2015-10-21
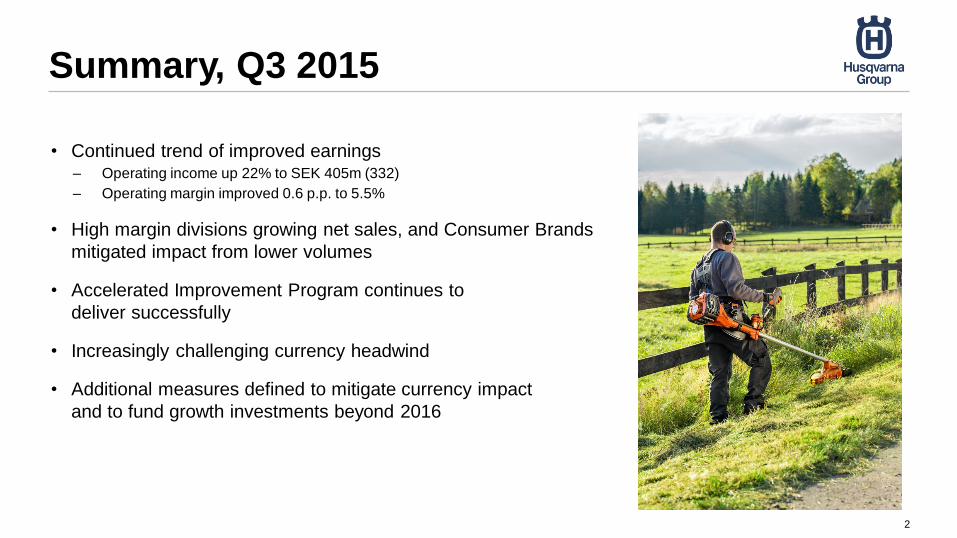
Summary, Q3 2015
• Continued trend of improved earnings– Operating income up 22% to SEK 405m (332)
– Operating margin improved 0.6 p.p. to 5.5%
• High margin divisions growing net sales, and Consumer Brands
mitigated impact from lower volumes
• Accelerated Improvement Program continues to
deliver successfully
• Increasingly challenging currency headwind
• Additional measures defined to mitigate currency impact
and to fund growth investments beyond 2016
2

Financial highlights Q3 2015, Group
• Unchanged sales (currency adjusted)– Higher in all divisions, except for Consumer Brands
• EBIT rose by 22% to SEK 405m (332)– Favorable mix driven by growth in watering
– Direct material cost reductions
– Adverse impact from lower production volumes
– Unfavorable EBIT currency impact of approx. SEK -60m
• Operating margin improved 0.6 p.p. to 5.5%
3
SEKm
Q3
2015
Q3
2014
As
reported Adjusted1
Jan-Sep
2015
Jan-Sep
2014
As
reported Adjusted1 LTM2
FY
2014
Net sales 7,307 6,785 8 0 30,498 27,515 11 -2 35,821 32,838
Gross margin, % 28.4 29.0 - - 29.1 28.9 - - 28.7 28.5
EBIT 405 332 22 26 3,192 2,613 22 12 2,160 1,581
Excl. impairment 405 332 22 26 3,192 2,613 22 12 2,927 2,348
EBIT margin, % 5.5 4.9 - - 10.5 9.5 - - 6.0 4.8
Excl. impairment, % 5.5 4.9 - - 10.5 9.5 - - 8.2 7.2
1 Adjusted for currency translation effects. 2 Last tw elve months rolling
% change, Q3 % change, 9M

Husqvarna Division Q3 2015
• Sales increased 3% (currency adjusted)– Increase driven mainly by snow-blowers in
North America
• EBIT and margin declined– Unfavorable mix
– Lower production volumes
– Adverse FX impact approx. SEK -30m
• Year-to-date positive EBIT and margin
development
4
SEKm
Q3
2015
Q3
2014
As
reported Adjusted1
Jan-Sep
2015
Jan-Sep
2014
As
reported Adjusted1 LTM2
FY
2014
Net sales 3,519 3,264 8 3 14,588 12,660 15 5 17,377 15,449
EBIT 321 432 -26 -24 2,219 1,917 16 10 2,310 2,008
EBIT margin, % 9.1 13.2 - - 15.2 15.1 - - 13.3 13.0
1 Adjusted for currency translation effects. 2 Last tw elve months rolling
% change, Q3 % change, 9M

Gardena Division Q3 2015
5
• Favorable weather in Central/Southern Europe
• Sales increased 19% (currency adjusted)
related to strong growth in watering
• Favorable scale impact and mix driven by the
growth in watering
• EBIT and margin rose substantially
SEKm
Q3
2015
Q3
2014
As
reported Adjusted1
Jan-Sep
2015
Jan-Sep
2014
As
reported Adjusted1 LTM2
FY
2014
Net sales 1,060 879 21 19 4,174 3,743 12 8 4,643 4,212
EBIT 113 -7 n/a n/a 714 569 25 21 528 383
EBIT margin, % 10.7 -0.8 - - 17.1 15.2 - - 11.4 9.1
1 Adjusted for currency translation effects. 2 Last tw elve months rolling
% change, Q3 % change, 9M
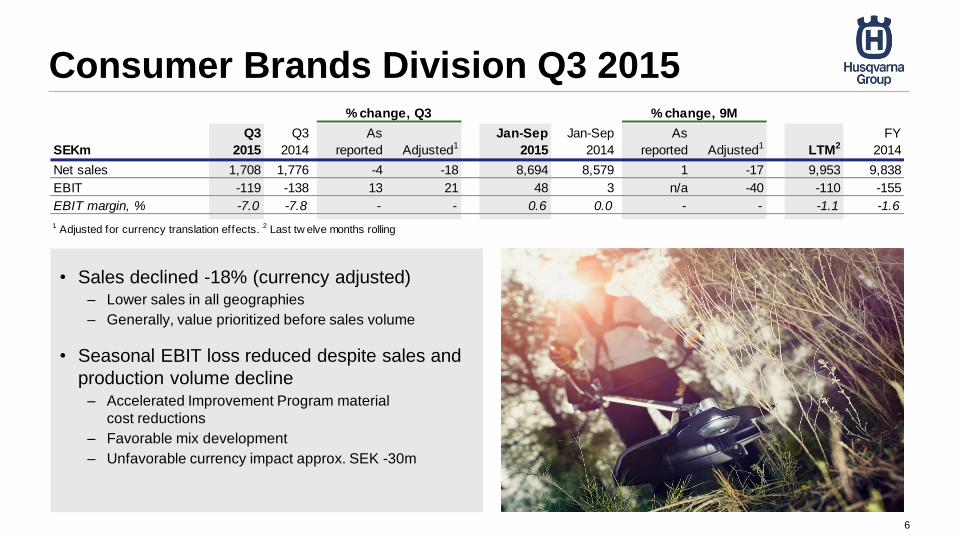
Consumer Brands Division Q3 2015
6
SEKm
Q3
2015
Q3
2014
As
reported Adjusted1
Jan-Sep
2015
Jan-Sep
2014
As
reported Adjusted1 LTM2
FY
2014
Net sales 1,708 1,776 -4 -18 8,694 8,579 1 -17 9,953 9,838
EBIT -119 -138 13 21 48 3 n/a -40 -110 -155
EBIT margin, % -7.0 -7.8 - - 0.6 0.0 - - -1.1 -1.6
1 Adjusted for currency translation effects. 2 Last tw elve months rolling
% change, Q3 % change, 9M
• Sales declined -18% (currency adjusted)– Lower sales in all geographies
– Generally, value prioritized before sales volume
• Seasonal EBIT loss reduced despite sales and
production volume decline– Accelerated Improvement Program material
cost reductions
– Favorable mix development
– Unfavorable currency impact approx. SEK -30m

Construction Division Q3 2015
7
• Sales increased 7% (currency adjusted)– Strong development in North America
– Slightly up, but mixed, in Europe
– Increase in rest of the world driven by Brazil and
Australia
• EBIT and margin increased– Sales volume impact
– Increased costs for sales and service resources
– Favorable currency impact
SEKm
Q3
2015
Q3
2014
As
reported Adjusted1
Jan-Sep
2015
Jan-Sep
2014
As
reported Adjusted1 LTM2
FY
2014
Net sales 1,020 866 18 7 3,042 2,533 20 6 3,848 3,339
EBIT 144 107 35 19 378 305 24 8 427 354
EBIT margin, % 14.1 12.4 - - 12.4 12.1 - - 11.1 10.6
1 Adjusted for currency translation effects. 2 Last tw elve months rolling
% change, Q3 % change, 9M

4%
5%
6%
7%
8%
9%
10%
0
500
1 000
1 500
2 000
2 500
3 000
3 500
Q32013
Q42013
Q12014
Q22014
Q32014
Q42014
Q12015
Q22015
Q32015
EBIT rolling 12 months (SEKm)
EBIT margin rolling 12 months (%) as reported
EBIT margin rolling 12 months (%) FX adjusted*
SEKm
9.5%*
EBIT almost doubled since AIP launch
• The Accelerated Improvement Program; launched Q3
2013, activities ending in 2015 and full financial impact
realized 2016
• The program is delivering above expectations
– Purchasing, value engineering and SKU complexity reduction
– Selective growth in profit pool areas
• However, the Group faces ~1,3 p.p. margin headwind due
to changes in exchange rates since 2013
– So far, unfavorable FX translation impact on net sales
– In 2016 currency hedges will no longer offset unfavorable
transaction impact on EBIT
• Additional activities to secure cost reductions beyond the
AIP in 2016 and 2017
8* FX adjusted only for translation effect on sales.
8.2%

Main initiatives
• Continued direct material cost-out
• Indirect material costs, logistics costs
• Rightsizing of footprint
• SG&A efficiency
• Working capital improvements –Cash Conversion Cycle
Why?
• Mitigate FX headwind and support margin target
• Fund investments for future profitable growth
Further efficiency measures 2016-17
AIP
9

Gross profit development
10
0
500
1 000
1 500
2 000
2 500
3 000
3 500
4 000
4 500
Q1 Q2 Q3 Q4
Gross profit per quarter SEKm, Group
2013 2014 2015

Consolidated income statement
11
SEKm
Q3
2015
Q3
2014
Jan-Sep
2015
Jan-Sep
2014
FY
2014
Net sales 7,307 6,785 30,498 27,515 32,838
Cost of goods sold -5,232 -4,819 -21,630 -19,567 -23,488
Gross income 2,075 1,966 8,868 7,948 9,350
Gross margin, % 28.4 29.0 29.1 28.9 28.5
Selling expense -1,333 -1,306 -4,518 -4,344 -5,626
Administrative expense -350 -328 -1,171 -1,004 -1,392
Other operating income/expense 13 0 13 13 16
Impairment of goodwill - - - - -767
Operating income1 405 332 3,192 2,613 1,581
Operating margin, % 5.5 4.9 10.5 9.5 4.8
Financial items, net -83 -70 -277 -276 -325
Income after financial items 322 262 2,915 2,337 1,256
Margin, % 4.4 3.9 9.6 8.5 3.8
Income tax -126 -63 -788 -551 -432
Income for the period 196 199 2,127 1,786 824
Basic earnings per share, SEK 0.34 0.35 3.70 3.11 1.43
Diluted earnings per share, SEK 0.34 0.35 3.69 3.11 1.43
1Of which depreciation, amortization
and impairment-285 -238 -823 -707 -1,734

Consolidated balance sheet
12
SEKm
30 Sep
2015
30 Sep
2014
31 Dec
2014
Non-current assets 16,157 15,404 15,748
Inventories 7,188 6,577 7,709
Trade receivables 4,105 3,970 2,898
Other current assets 660 560 716
Liquid funds 2,231 2,316 2,105
Total assets 30,341 28,827 29,176
Total equity 13,229 12,816 12,088
Interest-bearing liabilities incl. dividend payable 7,151 7,167 7,504
Pension liabilities 1,746 1,599 1,835
Provisions 2,736 2,369 2,550
Trade payables 2,659 2,533 3,154
Other current liabilities 2,820 2,343 2,045
Total equity and liabilities 30,341 28,827 29,176

Operating cash flow
13
-3,000
-2,000
-1,000
0
1,000
2,000
3,000
Q1 Q2 Q3 Q4
SEKm
2015
2014
2013

0.00
0.30
0.60
0.90
1.20
1.50
1.80
2.10
2.40
0
2,000
4,000
6,000
8,000
10,000
12,000
14,000
201
0 Q
3
201
0 Q
4
201
1 Q
1
201
1 Q
2
201
1 Q
3
201
1 Q
4
201
2 Q
1
201
2 Q
2
201
2 Q
3
201
2 Q
4
201
3 Q
1
201
3 Q
2
201
3 Q
3
201
3 Q
4
201
4 Q
1
201
4 Q
2
201
4 Q
3
201
4 Q
4
201
5 Q
1
201
5 Q
2
201
5 Q
3
Net Debt / EquitySEKm
Net debt
Equity
Net debt / equity
Net debt and equity
14
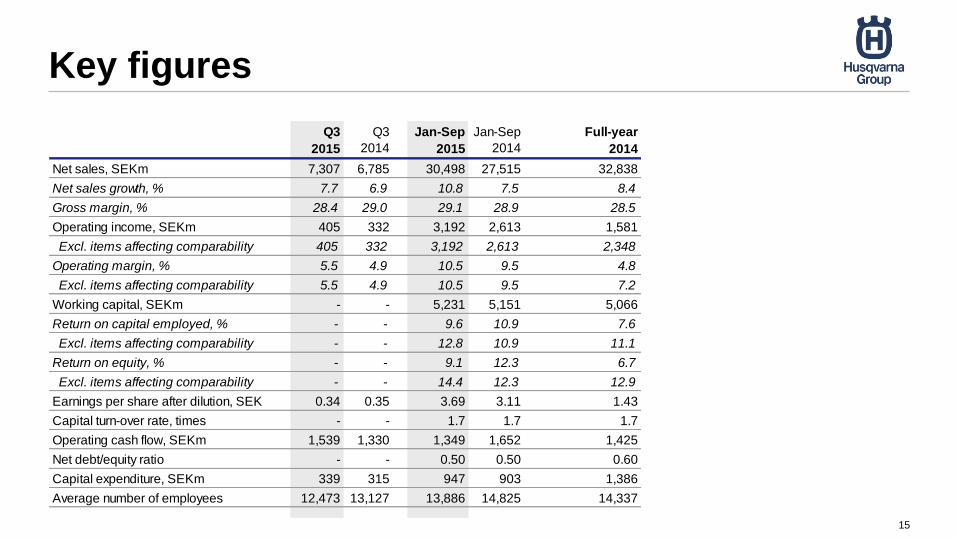
Key figures
15
Q3
2015
Q3
2014
Jan-Sep
2015
Jan-Sep
2014
Full-year
2014
Net sales, SEKm 7,307 6,785 30,498 27,515 32,838
Net sales growth, % 7.7 6.9 10.8 7.5 8.4
Gross margin, % 28.4 29.0 29.1 28.9 28.5
Operating income, SEKm 405 332 3,192 2,613 1,581
Excl. items affecting comparability 405 332 3,192 2,613 2,348
Operating margin, % 5.5 4.9 10.5 9.5 4.8
Excl. items affecting comparability 5.5 4.9 10.5 9.5 7.2
Working capital, SEKm - - 5,231 5,151 5,066
Return on capital employed, % - - 9.6 10.9 7.6
Excl. items affecting comparability - - 12.8 10.9 11.1
Return on equity, % - - 9.1 12.3 6.7
Excl. items affecting comparability - - 14.4 12.3 12.9
Earnings per share after dilution, SEK 0.34 0.35 3.69 3.11 1.43
Capital turn-over rate, times - - 1.7 1.7 1.7
Operating cash flow, SEKm 1,539 1,330 1,349 1,652 1,425
Net debt/equity ratio - - 0.50 0.50 0.60
Capital expenditure, SEKm 339 315 947 903 1,386
Average number of employees 12,473 13,127 13,886 14,825 14,337

Summary, Q3 2015
• Continued trend of improved earnings– Operating income up 22% to SEK 405m (332)
– Operating margin improved 0.6 p.p. to 5.5%
• High margin divisions growing net sales, and Consumer Brands
mitigated impact from lower volumes
• Accelerated Improvement Program continues to
deliver successfully
• Increasingly challenging currency headwind
• Additional measures defined to mitigate currency impact
and to fund growth investments beyond 2016
16
• Q4 2015: Increasing adverse impact from currency and lower production
rates will make it difficult for AIP to balance vs. last year result.
• In addition, SEK ~150m of restructuring cost as announced on October 7
www.husqvarnagroup.com


![Announces Q3 results [Result]](https://img.pdfslide.net/doc/110x75/577ca58e1a28abea748b9591/announces-q3-results-result.jpg)