Embed Size (px)
Citation preview

© 2016 Nimble Storage | Confidential: Do Not Distribute
Q3 FY2017
Earnings Results
Suresh Vasudevan, Chief Executive Officer
Anup Singh, Chief Financial Officer
November 22, 2016
© 2016 Nimble Storage | Confidential: Do Not Distribute2
Safe Harbor
This presentation and the accompanying oral presentation contain “forward-looking” statements that are based on our management’s beliefs and assumptions and on information
currently available to management. We intend for such forward-looking statements to be covered by the safe harbor provisions for forward-looking statements contained in the U.S.
Private Securities Litigation Reform Act of 1995. Forward-looking statements include all statements other than statements of historical fact contained in this presentation, including
information concerning our financial outlook, business plans and objectives, potential growth opportunities, competitive position, industry environment and potential market
opportunities.
Forward-looking statements are subject to known and unknown risks, uncertainties, assumptions and other factors including, but not limited to, those related to our future financial
performance, market acceptance of our solutions, our ability to increase sales of our solutions, including to attract and retain customers and to selling additional solutions to our existing
customers, our ability to develop new solutions and bring them to market in a timely manner, pricing pressure (as a result of competition or otherwise), our ability to maintain, protect
and enhance our brand and intellectual property, global economic conditions and our ability to continue to expand our business and manage our growth. Moreover, we operate in very
competitive and rapidly changing environments, and new risks may emerge from time to time. It is not possible for our management to predict all risks, nor can we assess the impact
of all factors on our business or the extent to which any factor, or combination of factors, may cause actual results to differ materially from those contained in any forward-looking
statements we may make. Further information on these and other factors that could affect our financial results are included in our filings we make with the Securities and Exchange
Commission, and may cause our actual results, performance or achievements to differ materially and adversely from those anticipated or implied by our forward-looking statements.
You should not rely upon forward-looking statements as predictions of future events. Although our management believes that the expectations reflected in our forward-looking
statements are reasonable, we cannot guarantee that the future results, levels of activity, performance or events and circumstances described in the forward-looking statements will be
achieved or occur. Moreover, neither we, nor any other person, assume responsibility for the accuracy and completeness of the forward-looking statements. We undertake no
obligation to publicly update any forward-looking statements for any reason after the date of this presentation to conform these statements to actual results or to changes in our
expectations, except as required by law.
In addition to GAAP financial information, this presentation includes certain non-GAAP financial measures. The non-GAAP measures have limitations and you should not consider
them in isolation or as a substitute for our GAAP financial information. There are limitations to the use of non-GAAP measures. For example, bookings and free cash flow are not
substitutes for revenues or cash provided by operations. In addition, non-GAAP operating expenses exclude the impact of stock-based compensation expense, which is a recurring
expense for us. See the Appendix for a reconciliation of these non-GAAP financial measures to their nearest GAAP equivalent.
© 2016 Nimble Storage | Confidential: Do Not Distribute3
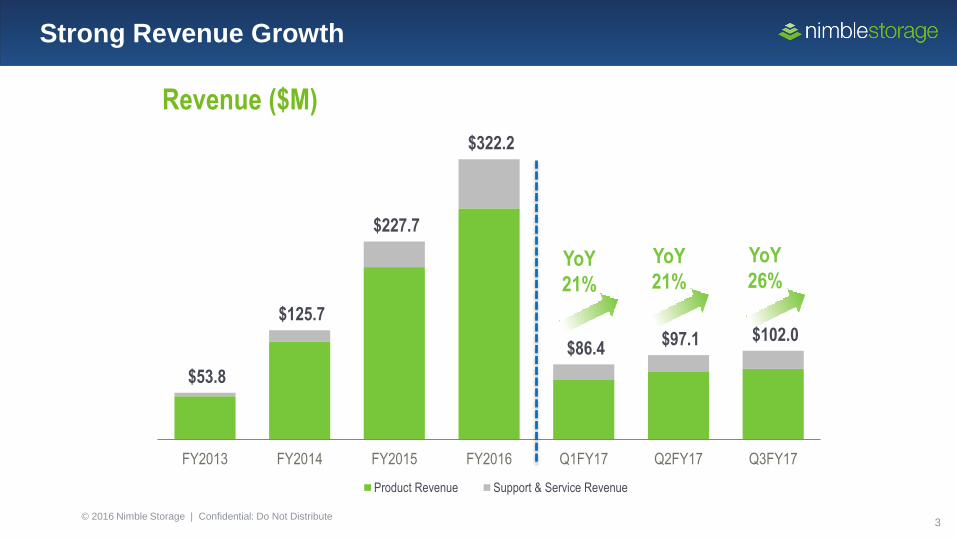
$53.8
$125.7
$227.7
$322.2
$86.4 $97.1 $102.0
FY2013 FY2014 FY2015 FY2016 Q1FY17 Q2FY17 Q3FY17
Product Revenue Support & Service Revenue
Revenue ($M)
YoY
21%
Strong Revenue Growth
YoY
21%
YoY
26%
© 2016 Nimble Storage | Confidential: Do Not Distribute4
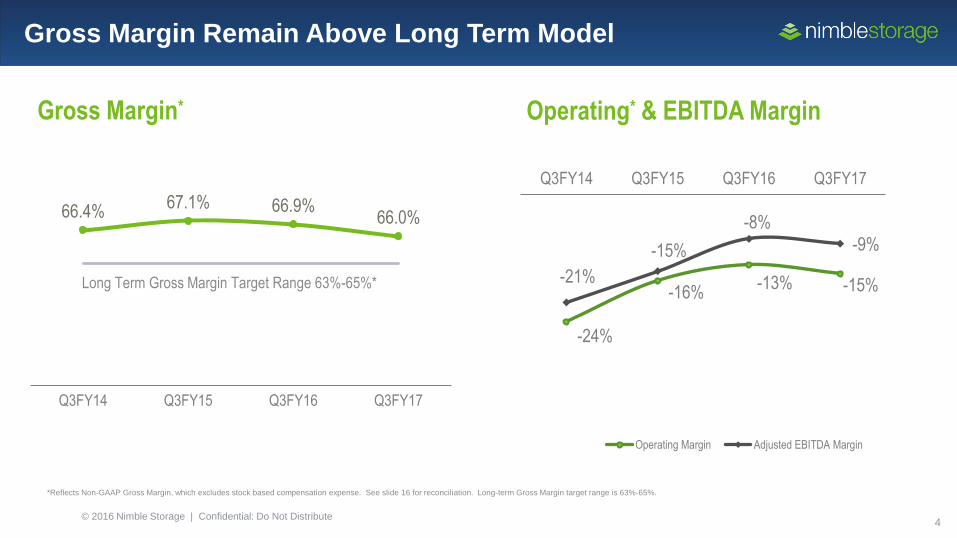
Gross Margin Remain Above Long Term Model
Gross Margin*
*Reflects Non-GAAP Gross Margin, which excludes stock based compensation expense. See slide 16 for reconciliation. Long-term Gross Margin target range is 63%-65%.
Operating* & EBITDA Margin
-24%
-16%-13% -15%-21%
-15%
-8%
-9%
Q3FY14 Q3FY15 Q3FY16 Q3FY17
Operating Margin Adjusted EBITDA Margin
66.4%67.1% 66.9%
66.0%
Q3FY14 Q3FY15 Q3FY16 Q3FY17
Long Term Gross Margin Target Range 63%-65%*
© 2016 Nimble Storage | Confidential: Do Not Distribute5
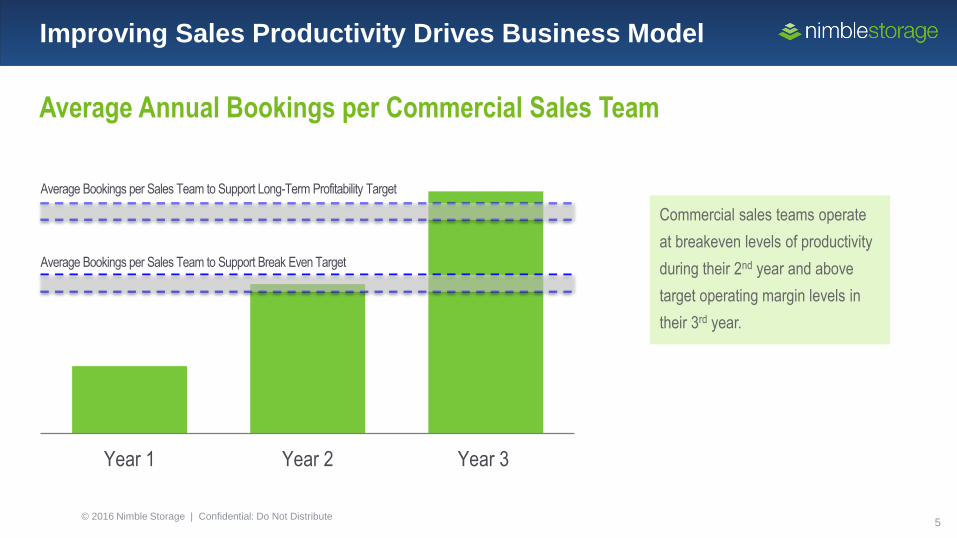
Average Annual Bookings per Commercial Sales Team
Year 1 Year 2 Year 3
Average Bookings per Sales Team to Support Break Even Target
Average Bookings per Sales Team to Support Long-Term Profitability Target
Commercial sales teams operate
at breakeven levels of productivity
during their 2nd year and above
target operating margin levels in
their 3rd year.
Improving Sales Productivity Drives Business Model
© 2016 Nimble Storage | Confidential: Do Not Distribute6
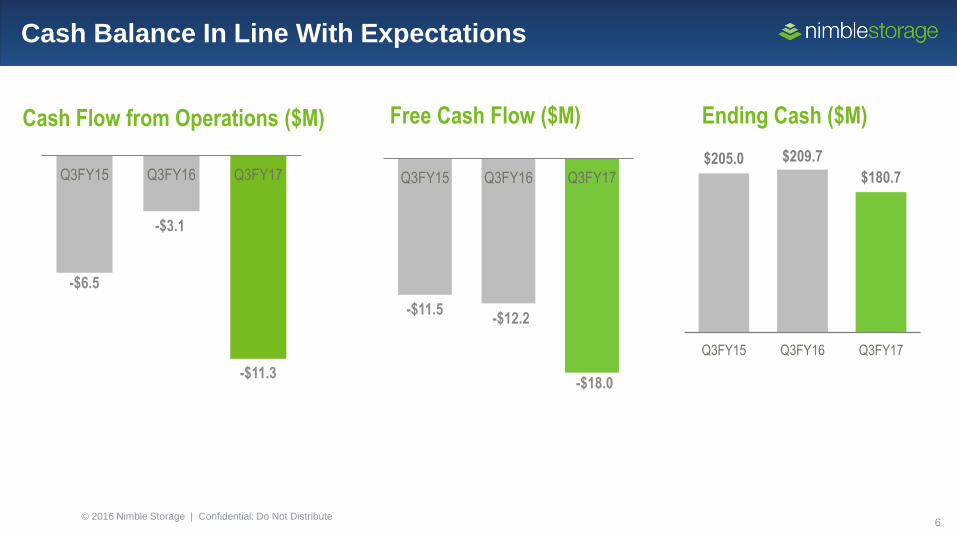
Cash Balance In Line With Expectations
Cash Flow from Operations ($M) Free Cash Flow ($M)
$205.0 $209.7
$180.7
Q3FY15 Q3FY16 Q3FY17
Ending Cash ($M)
-$6.5
-$3.1
-$11.3
Q3FY15 Q3FY16 Q3FY17
-$11.5-$12.2
-$18.0
Q3FY15 Q3FY16 Q3FY17
© 2016 Nimble Storage | Confidential: Do Not Distribute7
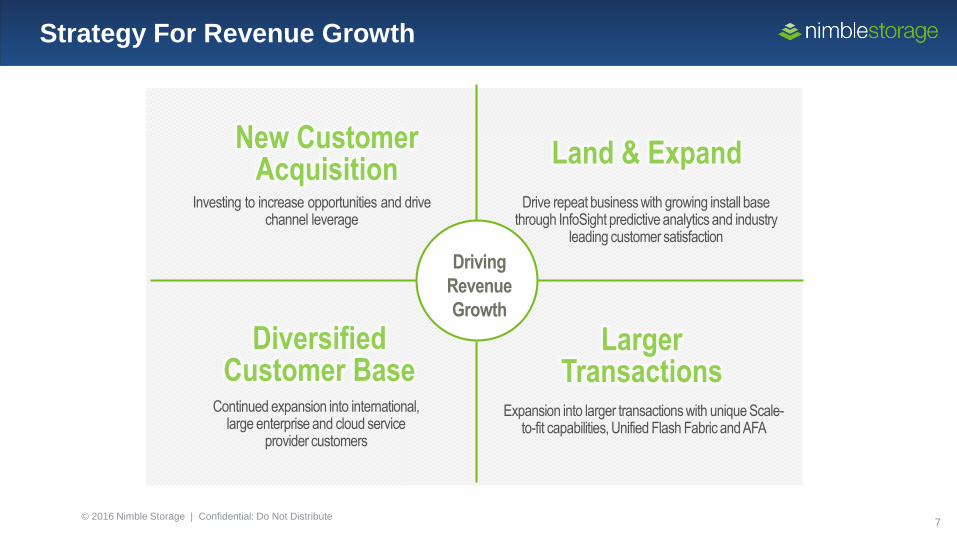
Strategy For Revenue Growth
Diversified Customer Base
Continued expansion into international, large enterprise and cloud service
provider customers
New Customer Acquisition
Investing to increase opportunities and drive channel leverage
Larger Transactions
Expansion into larger transactions with unique Scale-to-fit capabilities, Unified Flash Fabric and AFA
Land & Expand
Drive repeat business with growing install base through InfoSight predictive analytics and industry
leading customer satisfaction
Driving
Revenue
Growth
© 2016 Nimble Storage | Confidential: Do Not Distribute8
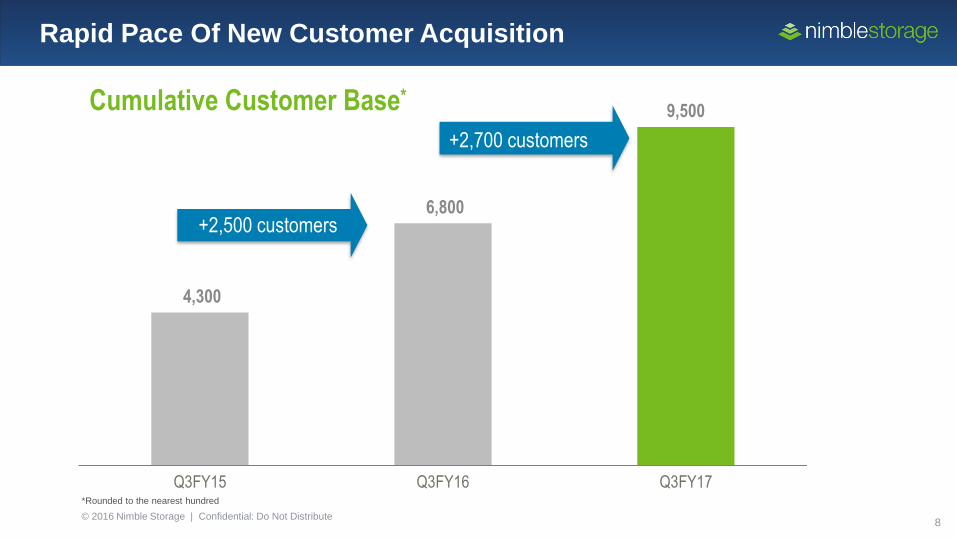
Rapid Pace Of New Customer Acquisition
Cumulative Customer Base*
4,300
6,800
9,500
Q3FY15 Q3FY16 Q3FY17*Rounded to the nearest hundred
+2,500 customers
+2,700 customers
© 2016 Nimble Storage | Confidential: Do Not Distribute9
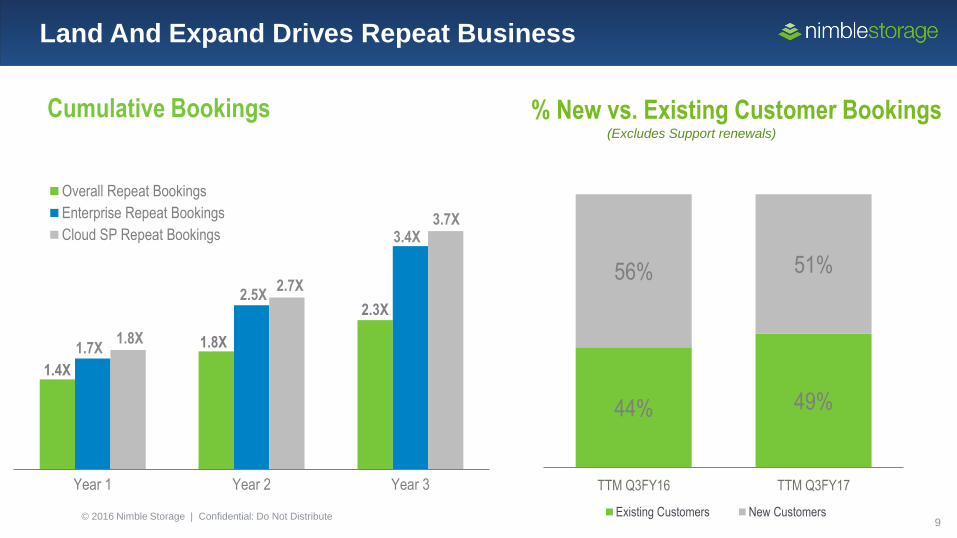
Land And Expand Drives Repeat Business
Cumulative Bookings
44% 49%
56% 51%
TTM Q3FY16 TTM Q3FY17
Existing Customers New Customers
% New vs. Existing Customer Bookings
1.4X
1.8X
2.3X
1.7X
2.5X
3.4X
1.8X
2.7X
3.7X
Year 1 Year 2 Year 3
Overall Repeat Bookings
Enterprise Repeat Bookings
Cloud SP Repeat Bookings
(Excludes Support renewals)
© 2016 Nimble Storage | Confidential: Do Not Distribute10
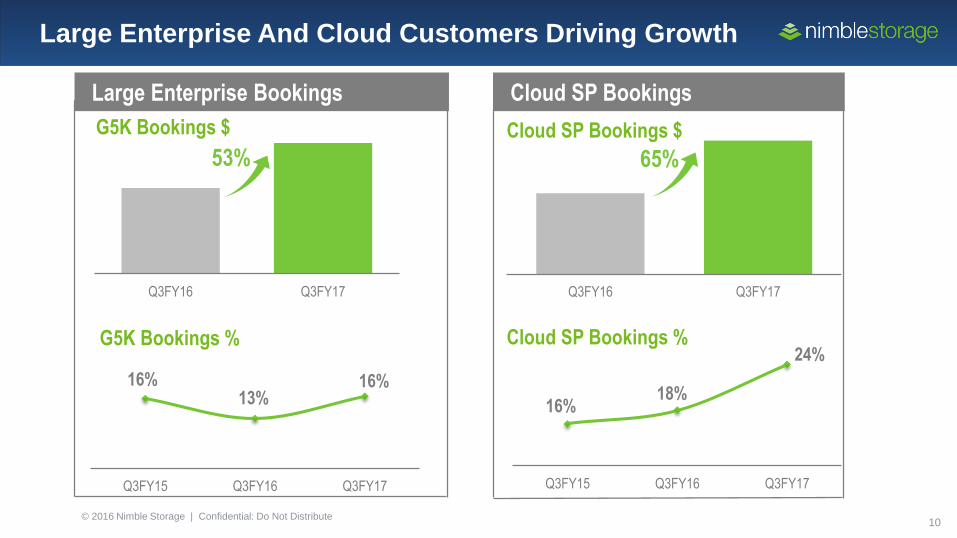
Large Enterprise And Cloud Customers Driving Growth
Large Enterprise Bookings
G5K Bookings $
Cloud SP Bookings
Cloud SP Bookings $
G5K Bookings %
53%
Q3FY16 Q3FY17
16%13%
16%
Q3FY15 Q3FY16 Q3FY17
65%
Q3FY16 Q3FY17
Cloud SP Bookings %
16%18%
24%
Q3FY15 Q3FY16 Q3FY17
© 2016 Nimble Storage | Confidential: Do Not Distribute11
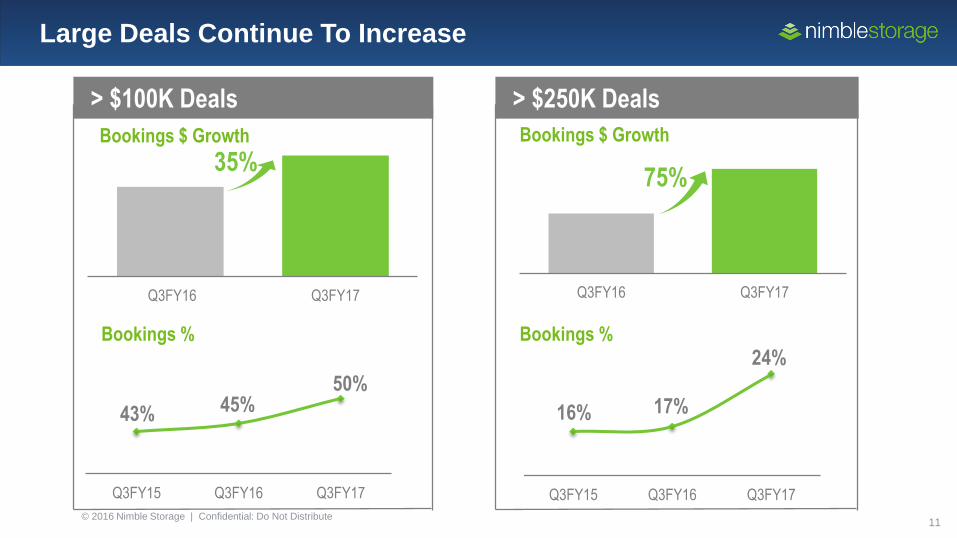
Large Deals Continue To Increase
Bookings %
Bookings $ Growth
35%
Q3FY16 Q3FY17
> $100K Deals
Bookings $ Growth
> $250K Deals
75%
Q3FY16 Q3FY17
43% 45%50%
Q3FY15 Q3FY16 Q3FY17
Bookings %
16% 17%
24%
Q3FY15 Q3FY16 Q3FY17
© 2016 Nimble Storage | Confidential: Do Not Distribute12
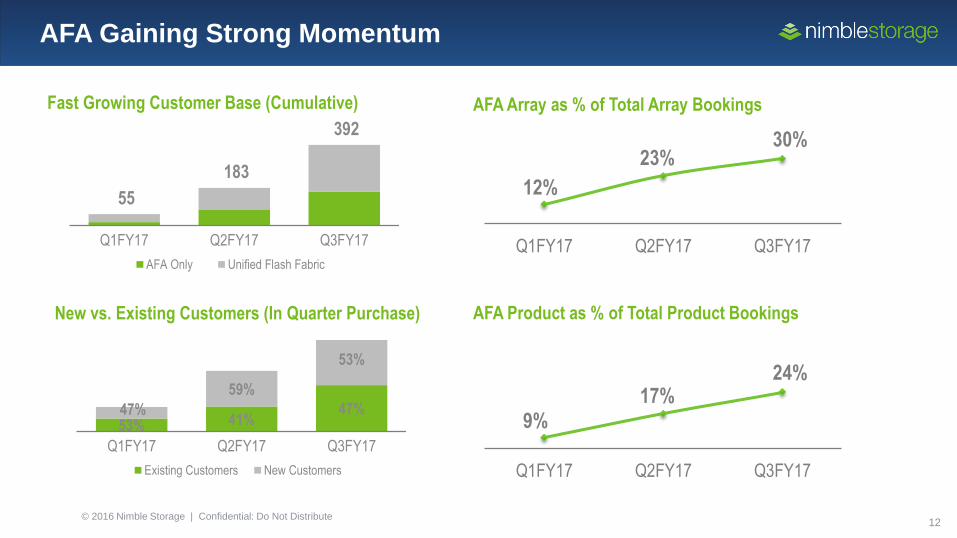
AFA Gaining Strong Momentum
AFA Product as % of Total Product Bookings
9%
17%24%
Q1FY17 Q2FY17 Q3FY17
Fast Growing Customer Base (Cumulative)
55
183
392
Q1FY17 Q2FY17 Q3FY17
AFA Only Unified Flash Fabric
AFA Array as % of Total Array Bookings
12%
23%30%
Q1FY17 Q2FY17 Q3FY17
New vs. Existing Customers (In Quarter Purchase)
53% 41%47%47%
59%
53%
Q1FY17 Q2FY17 Q3FY17
Existing Customers New Customers
© 2016 Nimble Storage | Confidential: Do Not Distribute13
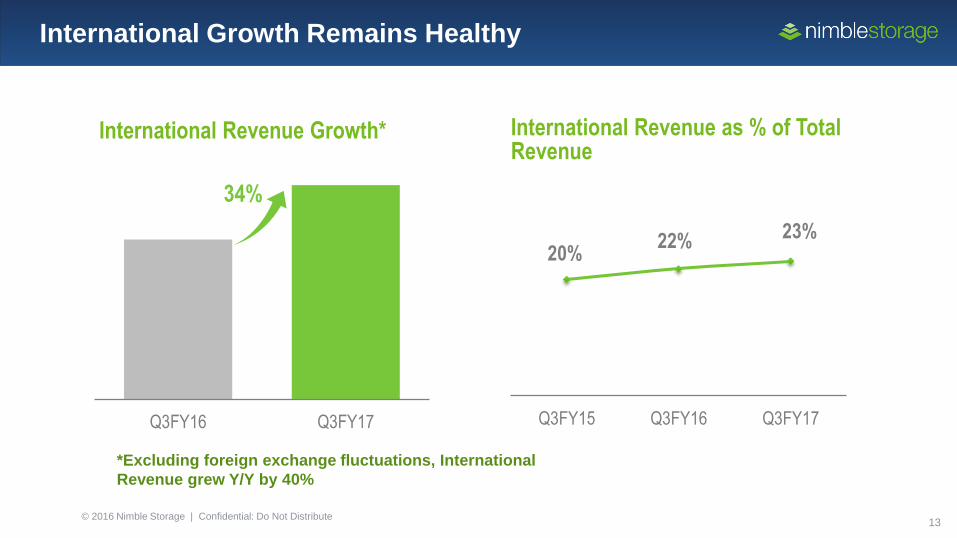
International Growth Remains Healthy
International Revenue as % of Total Revenue
20%22% 23%
Q3FY15 Q3FY16 Q3FY17
International Revenue Growth*
34%
Q3FY16 Q3FY17
*Excluding foreign exchange fluctuations, International
Revenue grew Y/Y by 40%
© 2016 Nimble Storage | Confidential: Do Not Distribute14
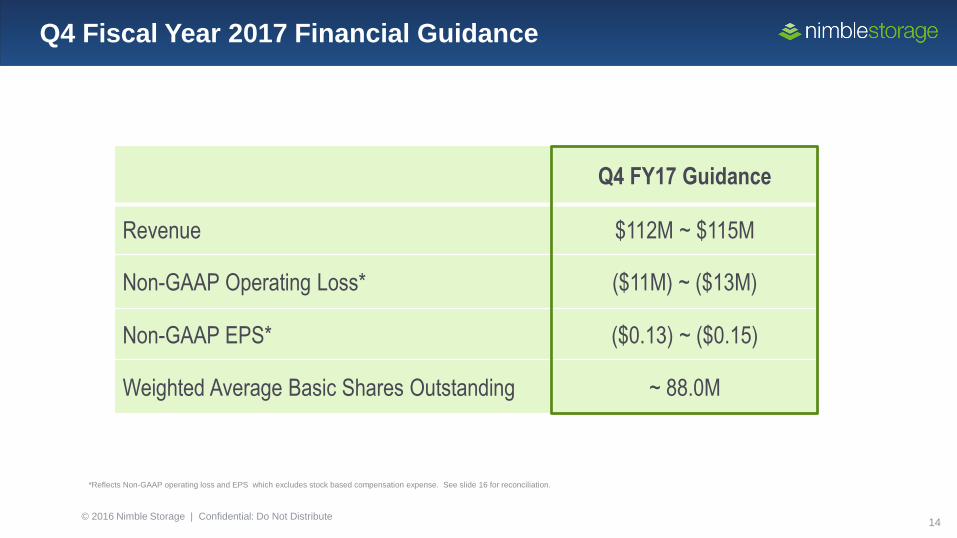
Q4 Fiscal Year 2017 Financial Guidance
Q4 FY17 Guidance
Revenue $112M ~ $115M
Non-GAAP Operating Loss* ($11M) ~ ($13M)
Non-GAAP EPS* ($0.13) ~ ($0.15)
Weighted Average Basic Shares Outstanding ~ 88.0M
*Reflects Non-GAAP operating loss and EPS which excludes stock based compensation expense. See slide 16 for reconciliation.
© 2016 Nimble Storage | Confidential: Do Not Distribute15
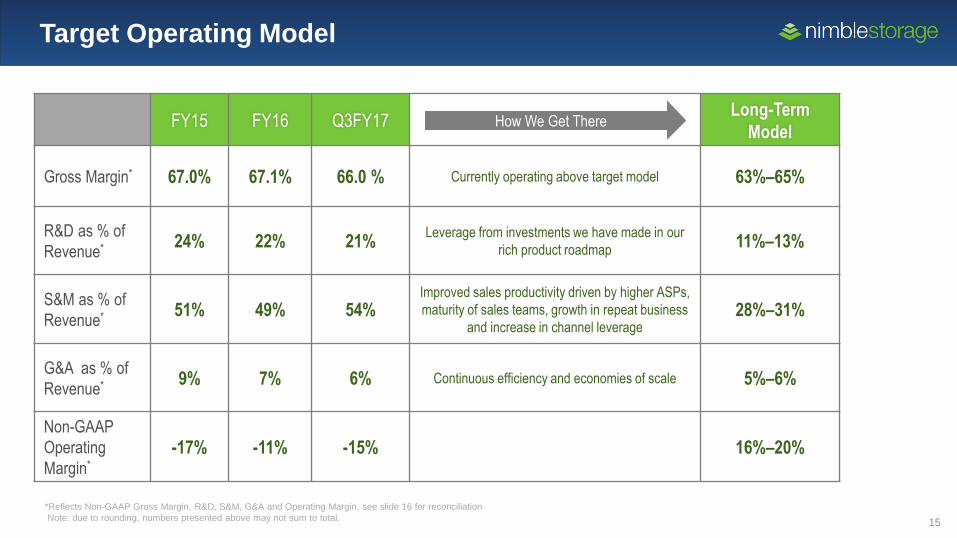
Target Operating Model
*Reflects Non-GAAP Gross Margin, R&D, S&M, G&A and Operating Margin, see slide 16 for reconciliation
Note: due to rounding, numbers presented above may not sum to total.
FY15 FY16 Q3FY17Long-Term
Model
Gross Margin* 67.0% 67.1% 66.0 % Currently operating above target model 63%–65%
R&D as % of
Revenue* 24% 22% 21%Leverage from investments we have made in our
rich product roadmap11%–13%
S&M as % of
Revenue* 51% 49% 54%Improved sales productivity driven by higher ASPs,
maturity of sales teams, growth in repeat business
and increase in channel leverage28%–31%
G&A as % of
Revenue* 9% 7% 6% Continuous efficiency and economies of scale 5%–6%
Non-GAAP
Operating
Margin*
-17% -11% -15% 16%–20%
How We Get There
© 2016 Nimble Storage | Confidential: Do Not Distribute16
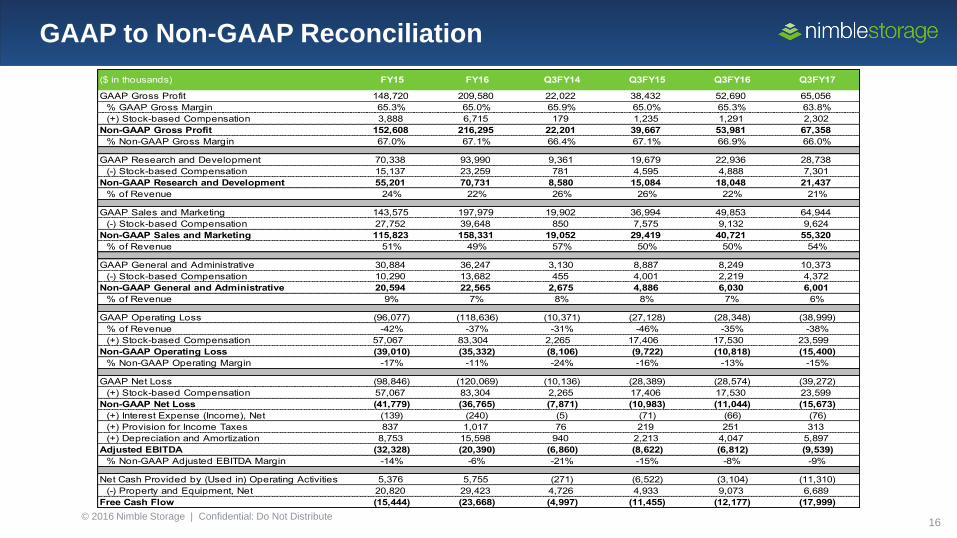
($ in thousands) FY15 FY16 Q3FY14 Q3FY15 Q3FY16 Q3FY17
GAAP Gross Profit 148,720 209,580 22,022 38,432 52,690 65,056
% GAAP Gross Margin 65.3% 65.0% 65.9% 65.0% 65.3% 63.8%
(+) Stock-based Compensation 3,888 6,715 179 1,235 1,291 2,302
Non-GAAP Gross Profit 152,608 216,295 22,201 39,667 53,981 67,358
% Non-GAAP Gross Margin 67.0% 67.1% 66.4% 67.1% 66.9% 66.0%
GAAP Research and Development 70,338 93,990 9,361 19,679 22,936 28,738
(-) Stock-based Compensation 15,137 23,259 781 4,595 4,888 7,301
Non-GAAP Research and Development 55,201 70,731 8,580 15,084 18,048 21,437
% of Revenue 24% 22% 26% 26% 22% 21%
GAAP Sales and Marketing 143,575 197,979 19,902 36,994 49,853 64,944
(-) Stock-based Compensation 27,752 39,648 850 7,575 9,132 9,624
Non-GAAP Sales and Marketing 115,823 158,331 19,052 29,419 40,721 55,320
% of Revenue 51% 49% 57% 50% 50% 54%
GAAP General and Administrative 30,884 36,247 3,130 8,887 8,249 10,373
(-) Stock-based Compensation 10,290 13,682 455 4,001 2,219 4,372
Non-GAAP General and Administrative 20,594 22,565 2,675 4,886 6,030 6,001
% of Revenue 9% 7% 8% 8% 7% 6%
GAAP Operating Loss (96,077) (118,636) (10,371) (27,128) (28,348) (38,999)
% of Revenue -42% -37% -31% -46% -35% -38%
(+) Stock-based Compensation 57,067 83,304 2,265 17,406 17,530 23,599
Non-GAAP Operating Loss (39,010) (35,332) (8,106) (9,722) (10,818) (15,400)
% Non-GAAP Operating Margin -17% -11% -24% -16% -13% -15%
GAAP Net Loss (98,846) (120,069) (10,136) (28,389) (28,574) (39,272)
(+) Stock-based Compensation 57,067 83,304 2,265 17,406 17,530 23,599
Non-GAAP Net Loss (41,779) (36,765) (7,871) (10,983) (11,044) (15,673)
(+) Interest Expense (Income), Net (139) (240) (5) (71) (66) (76)
(+) Provision for Income Taxes 837 1,017 76 219 251 313
(+) Depreciation and Amortization 8,753 15,598 940 2,213 4,047 5,897
Adjusted EBITDA (32,328) (20,390) (6,860) (8,622) (6,812) (9,539)
% Non-GAAP Adjusted EBITDA Margin -14% -6% -21% -15% -8% -9%
Net Cash Provided by (Used in) Operating Activities 5,376 5,755 (271) (6,522) (3,104) (11,310)
(-) Property and Equipment, Net 20,820 29,423 4,726 4,933 9,073 6,689
Free Cash Flow (15,444) (23,668) (4,997) (11,455) (12,177) (17,999)
GAAP to Non-GAAP Reconciliation