Embed Size (px)
Citation preview

Fourth quarter and full year 2015 financial results February 10th, 2016

\ 2
Important notice
Forward-looking statements This presentation contains forward-looking statements within the meaning of Section 27A of the Securities Act of 1933 and Section 21E of the
Securities Exchange Act of 1934. All statements, other than statements of historical facts, included in this presentation that address activities,
events or developments that Markit Ltd. (“Markit” or the “Company”) expects, believes or anticipates will or may occur in the future are
forward-looking statements. Without limiting the generality of the foregoing, forward-looking statements contained in this presentation may
include the expectations of management regarding plans, strategies, objectives and anticipated financial and operating results of the
Company. Markit’s estimates and forward-looking statements are mainly based on its current expectations and estimates of future events and
trends, which affect or may affect its businesses and operations. Although Markit believes that these estimates and forward-looking
statements are based upon reasonable assumptions, they are subject to several risks and uncertainties and are made in light of information
currently available to Markit. When used in this presentation, the words “anticipate,” “believe,” “intend,” “expect,” “plan,” “will” or other similar
words are intended to identify forward-looking statements. Such statements are subject to a number of assumptions, risks and uncertainties,
many of which are beyond the control of Markit, which may cause actual results to differ materially from those implied or expressed by the
forward-looking statements. Further information on such assumptions, risks and uncertainties is available in Markit’s filings with the United
States Securities and Exchange Commission (“SEC”) including its annual report on Form 20-F. Markit’s SEC filings are available at
www.sec.gov or on the investor relations section of its website, www.markit.com. Markit undertakes no obligation and does not intend to
update these forward-looking statements to reflect events or circumstances occurring after the date of this presentation. You are cautioned not
to place undue reliance on these forward-looking statements, which speak only as of the date of this presentation. All forward-looking
statements are qualified in their entirety by this cautionary statement.
Non-IFRS financial measures
This presentation also includes measures defined by the SEC as non-IFRS financial measures. Markit believes that these non-IFRS
measures can provide useful supplemental information to securities analysts, investors and other interested parties regarding financial and
business trends relating to its financial condition and results of operations when read in conjunction with the company’s reported results.
Definitions and reconciliations of these non-IFRS measures to most directly comparable IFRS financial measures are available in the
Appendix of this presentation and in Markit’s earnings release dated February 10th, 2016.
Copyright ©2016, Markit Group Limited. All rights reserved and all intellectual property rights are retained by Markit.

\ 3
Agenda
Full year 2015 overview and outlook
Lance Uggla, CEO
Fourth quarter and full year 2015 financial results
Jeff Gooch, CFO
Appendix

\ 4
Full year 2015 overview and outlook
Lance Uggla

\ 5
Full year 2015 overview and outlook
2015 overview and outlook
• Organic revenue increased +3.6% (+7.4% constant currency)
• Proactive cost management resulted in adjusted EBITDA margins of 45%
Financial performance
• Disciplined capital management:
• Secondary offering of $650 million including $350 million buyback
• Entered into $200 million accelerated share repurchase agreement
• Refinanced debt through $500 million private placement
• Board authorized new $500m share repurchase program
Capital management
• Our leadership team is a key competitive advantage
• Strengthened this year through recruitment, acquisition and promotion
• Demonstrated ability to attract and promote top talent
Management team
• Developing products internally positions us to generate organic growth
• Expanded product offerings and solutions for customers across divisions
Product development
• Actively involved in the fixed income index market
• New technologies create opportunities (e.g. Blockchain)
• Leveraging enhanced account management structure
• Helping our customers respond to new regulations
Investing for growth
• Announced four acquisitions in 2015 with good momentum in 2016
• Acquisitions are integrated and contributing to adjusted earnings
• Pipeline remains strong Acquisitions

\ 6
Q4 and full year 2015 financial results
Jeff Gooch

\ 7
Q4 and FY 2015 financial results
Summary financial results
($ million)
Q4 2015 Q4 2014 YoY% FY 2015 FY 2014 YoY%
Revenue 291.5 271.4 7.4% 1,113.4 1,065.1 4.5%
Constant currency growth - - 9.4% - - 7.4%
Adjusted EBITDA (1) 131.8 124.7 5.7% 496.9 488.2 1.8%
Adjusted EBITDA margin (2) 45.6% 46.3% N/A 45.0% 46.0% N/A
Adjusted Earnings (3) 68.8 69.1 (0.4)% 273.9 279.0 (1.8)%
Adjusted EPS, diluted (4) $0.37 $0.37 - $1.44 $1.51 (4.6)%
Weighted average number of shares
used to compute earnings per share,
diluted (million)
188.1 187.3 0.4% 189.8 184.5 2.9%
1. Adjusted EBITDA is defined as profit for the period from continuing operations before income taxes, net finance costs, depreciation and amortisation on fixed assets and
intangible assets (including acquisition related intangible assets), acquisition related items, exceptional items, share based compensation and related items, net other
gains or losses, including Adjusted EBITDA attributable to joint ventures and excluding Adjusted EBITDA attributable to non-controlling interests.
2. Adjusted EBITDA margin is defined as Adjusted EBITDA divided by revenue, excluding revenue attributable to non-controlling interests.
3. Adjusted Earnings is defined as profit for the period from continuing operations before amortisation of acquired intangibles, acquisition related items, exceptional items,
share based compensation and related items, net other gains or losses and unwind of discount, less the tax effect of these adjustments and excluding Adjusted Earnings
attributable to non-controlling interests.
4. Adjusted EPS diluted is defined as Adjusted Earnings divided by the weighted average number of shares used to compute earnings per share diluted.

\ 8
Q4 and FY 2015 financial results
Revenue growth ($ million)
$271.4 $2.9
$22.6 $(5.4) $291.5
Q4 2014 revenue
Organic growth
Acquired growth
FX / Currency impact (1)
Q4 2015 revenue
+1.1%
(2.0)%
+8.3%
+7.4%
Q4 2014 vs. Q4 2015
$1,065.1
$38.3 $41.1 $(31.1)
$1,113.4
FY 2014 revenue
Organic growth
Acquired growth
FX / Currency impact (1)
FY 2015 revenue
+3.6%
+3.8% (2.9)%
+4.5%
FY 2014 vs. FY 2015
1) 10% movement in rates = $8m revenue impact & $7m opex impact in quarter

\ 9
53.8% 58.2%
40.9% 34.1%
5.3% 7.7%
Q4 2014 Q4 2015
Non-recurring revenue
Recurring variable revenue
Recurring fixed revenue
Q4 and FY 2015 financial results
Revenue mix
($ million) Q4 2015 % Q4 2014 % $ YoY FY 2015 % FY 2014 % $ YoY
Recurring fixed $169.6 58.2% $146.0 53.8% $23.6 $624.6 56.1% $559.2 52.5% $65.4
Recurring variable $99.3 34.1% $111.0 40.9% ($11.7) $418.8 37.6% $450.5 42.3% ($31.7)
Non-recurring $22.6 7.7% $14.4 5.3% $8.2 $70.0 6.3% $55.4 5.2% $14.6
Total Revenue $291.5 $271.4 $20.1 $1,113.4 $1,065.1 $48.3
Q4 overview:
─ Recurring fixed revenue
grew 16%, primarily due to
acquisitions and new
business wins in Information
and Solutions
─ Recurring variable revenue
decrease driven by
Processing
─ Q4 renewal rate ~90%

\ 10
Q4 and FY 2015 financial results
Operating and exceptional expenses
($ million)
Q4 2015 Q4 2014 YoY% FY 2015 FY 2014 YoY%
Personnel
costs (90.7) (85.2) 6.5% (362.3) (350.4) 3.4%
Non
personnel
costs
(64.7) (54.1) 19.6% (238.1) (218.8) 8.8%
Total
operating
expenses
(155.4) (139.3) 11.6% (600.4) (569.2) 5.5%
Exceptional
items - (33.1) n/a (48.7) (84.9) (42.6%)
Q4 overview:
─ Operating expenses
increased primarily due to
acquisitions
─ Continued investment in
new product development,
such as KYC, KY3P and
hosted service Solutions
offerings
\ 11
Q4 and FY 2015 financial results
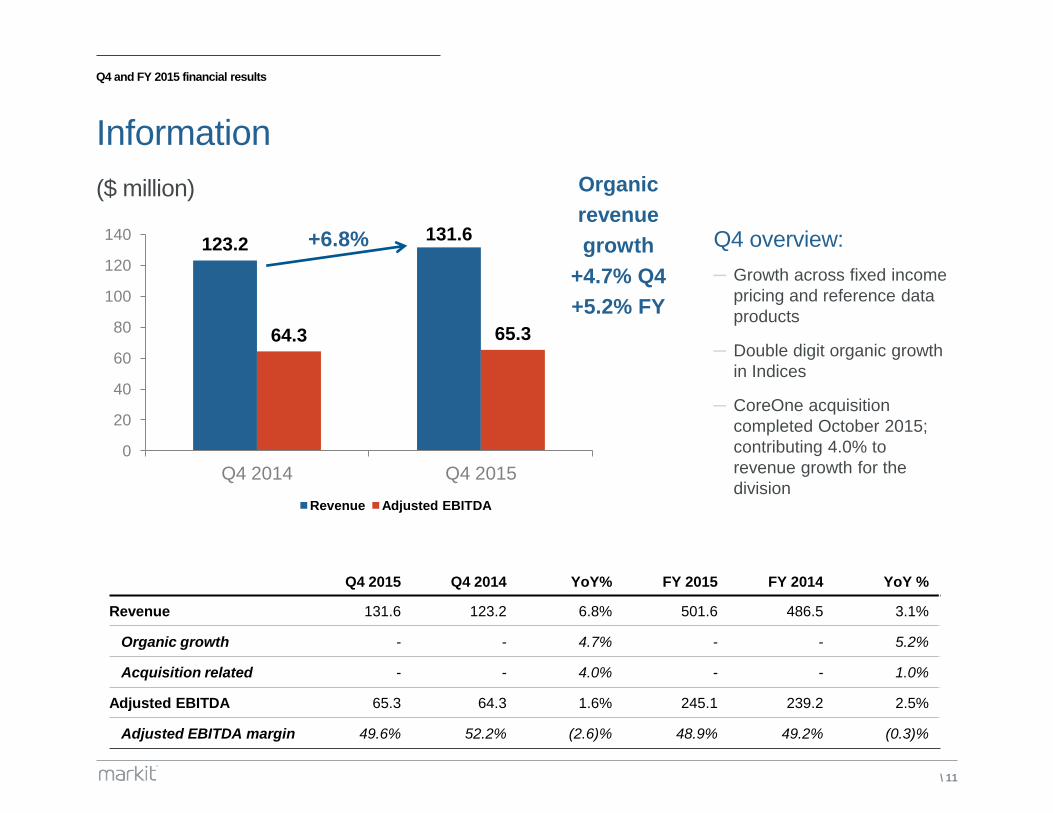
Information
($ million)
123.2 131.6
64.3 65.3
0
20
40
60
80
100
120
140
Q4 2014 Q4 2015
Revenue Adjusted EBITDA
+6.8% Q4 overview:
─ Growth across fixed income
pricing and reference data
products
─ Double digit organic growth
in Indices
─ CoreOne acquisition
completed October 2015;
contributing 4.0% to
revenue growth for the
division
Organic
revenue
growth
+4.7% Q4
+5.2% FY
Q4 2015 Q4 2014 YoY% FY 2015 FY 2014 YoY %
Revenue 131.6 123.2 6.8% 501.6 486.5 3.1%
Organic growth - - 4.7% - - 5.2%
Acquisition related - - 4.0% - - 1.0%
Adjusted EBITDA 65.3 64.3 1.6% 245.1 239.2 2.5%
Adjusted EBITDA margin 49.6% 52.2% (2.6)% 48.9% 49.2% (0.3)%

\ 12
Q4 and FY 2015 financial results
Processing
($ million)
Q4 overview:
─ Strong rates volumes offset by price
changes implemented in Q2 and
adverse FX movements
─ Continued weakness in credit
volumes, along with one-off regulatory
reporting revenue in prior year
─ Loans secondary volumes maintained,
continued weakness in primary loan
issuance volumes
─ DealHub acquisition completed
September 2015; contributing 3.9% to
revenue growth for the division
68.5
59.8
36.5 30.9
0
10
20
30
40
50
60
70
80
Q4 2014 Q4 2015
Revenue Adjusted EBITDA
(12.7)%
Q4 2015 Q4 2014 YoY% FY 2015 FY 2014 YoY %
Revenue 59.8 68.5 (12.7)% 256.0 284.9 (10.1)%
Organic growth - - (14.7%) - - (8.2)%
Acquisition related - - 3.9% - - 1.3%
Adjusted EBITDA 30.9 36.5 (15.3)% 133.9 156.6 (14.5)%
Adjusted EBITDA margin 51.7% 53.3% (1.6)% 52.3% 55.0% (2.7)%
Organic
revenue
growth
(14.7)% Q4
(8.2)% FY

\ 13
Q4 and FY 2015 financial results
Solutions
($ million)
79.7
100.1
24.3 36.0
0
20
40
60
80
100
120
Q4 2014 Q4 2015
Revenue Adjusted EBITDA
+25.6%
Q4 2015 Q4 2014 YoY% FY 2015 FY 2014 YoY%
Revenue 100.1 79.7 25.6% 355.8 293.7 21.1%
Organic growth - - 9.0% - - 12.3%
Acquisition related - - 18.8% - - 11.1%
Adjusted EBITDA 36.0 24.3 48.1% 120.0 93.1 28.9%
Adjusted EBITDA margin 36.0% 30.5% 5.5% 33.7% 31.7% 2.0%
Q4 overview:
─ Growth across Managed Services
and Enterprise Software driven by
new business and increased
customer assets under
management
─ EDM, On Demand, Corporate
Actions, WSO Services achieved
double digit organic growth
─ Acquisition related revenue
growth of 18.8% for the division
was driven by Information Mosaic,
CoreOne, Tax Solutions and
thinkFolio
Organic
revenue
growth
+9.0% Q4
+12.3% FY

\ 14
Q4 and FY 2015 financial results
Net debt / leverage & free cash flow
($ million) December
31st, 2015
December
31st, 2014
Bank borrowings 197.4 224.5
Share buyback 128.6 211.1
Private placement 498.0 -
Total borrowings 824.0 435.6
Cash and cash equivalents (146.0) (117.7)
Net debt 678.0 317.9
LTM Adjusted EBITDA (1) 496.9 488.2
Leverage (2) 1.36x 0.65x
Net cash generated by operating
activities 405.6 369.9
Purchases of property, plant and
equipment (16.6) (23.5)
Purchases of intangible assets (100.5) (101.4)
Free cash flow 288.5 245.0
Overview:
─ On November 4, 2015, we
completed a $500m private
placement of debt with $210m at
3.73% (due 2022) and $290m at
4.05% (due 2025)
─ Free cash flow up 17.8% to
$288.5m
─ Working capital showed a net
inflow of ~$30m during 2015
─ Capex under control, at $117m for
the year at 10.5% of revenues
(2014: $125m or 11.7% of
revenues)
1) LTM Adjusted EBITDA is defined as Adjusted EBITDA for the previous twelve month period to date reported
2) Leverage is defined as net debt divided by LTM Adjusted EBITDA

\ 15
187.3
191.7 190.8
185.4
188.1
184.9
4.4
2.3 5.4
4.0
3.2 10.8
1.3
Q4 2014 Dilution Q1 2015 Dilution Share repurchase
Q2 2015 Dilution Share repurchase
Q3 2015 Dilution Share repurchase
Q4 2015 At 01.01.16
In-period weighted average number of shares, diluted
Managing diluted shares outstanding ─ $350 million share repurchase (~14m shares) completed June 2015
─ ~5.1 million shares repurchased in December 2015 representing $150 million of aggregate $200 million
accelerated share repurchase program
─ New share repurchase programme of up to $500 million over two years was authorised in February 2016 by the
Board of directors
(million)
Dilution refers to dilutive impact of employee options and restricted stock.
Diluted share count as of January 1, 2016 (184.9m) removes the impact of time-weighting on the 2015 share count and includes expected vesting of restricted stock
Q4 and FY 2015 financial results

\ 16
Long term financial objectives and commentary
LONG TERM FINANCIAL OBJECTIVES
Organic revenue growth 5-7%
Total revenue growth (constant currency) Double digits through acquisitions
Adjusted EBITDA margins Mid 40%’s
MANAGEMENT COMMENTARY
Adjusted effective tax rate 26-29%
Leverage ratio Target range of 1.5 – 2.0x
Capital expenditures1 9-11% of revenues
Depreciation / Amortisation 8-10% of revenues
Share capital management Aim to use cash proceeds from option exercises to offset dilution
Aim to use buybacks to offset dilution from annual compensation awards
Information – organic revenue growth 4-6%
Processing – adjusted EBITDA margin ~50%
Solutions – organic revenue growth 10-15%
Q4 and FY 2015 financial results
1 Excluding significant office related capex (e.g. 2016 New York City office consolidation).
\ 17
Appendix

\ 18
Acquired revenue calculation method comparison
Impact of revised treatment of acquired revenue
─ At Q3 2015, we disclosed a change to our organic growth methodology to be in line with peers
─ Commencing Q1 2016, new methodology treats acquisitions as organic growth twelve months post acquisition
─ Only our Solutions division was impacted in 2014 and 2015
FY 2014 Q1 2015 Q2 2015 Q3 2015 Q4 2015 FY 2015
Reported:
Information 4.4% 6.3% 4.9% 5.1% 4.7% 5.2%
Processing 5.1% (2.4)% (2.5)% (13.6)% (14.7)% (8.2)%
Solutions 17.8% 14.4% 13.2% 13.1% 9.0% 12.3%
Group 7.8% 6.1% 5.1% 2.3% 1.1% 3.6%
New methodology:
Information 4.4% 6.3% 4.9% 5.1% 4.7% 5.2%
Processing 5.1% (2.4)% (2.5)% (13.6)% (14.7)% (8.2)%
Solutions 18.2% 15.6% 13.8% 15.9% 10.9% 14.0%
Group 7.8% 6.4% 5.3% 3.1% 1.7% 4.1%
Organic revenue growth comparison

\ 19
70 75 99 131 125 117
242
67
381 224
129
317
183
52
6191
551
2010 2011 2012 2013 2014 2015
($ million)
Annual capital allocation
Share repurchase Acquisitions Internal investments
Acquisitions 39%
Internal investments
19%
Share repurchase
42%
Balanced and flexible capital allocation framework
1 Includes $495m in share repurchases conducted in August 2012, 55% of which from related-party customers, payable in quarterly installments through to May 2017.
Capital allocation
495
194
1,099
355
254
985
2010 – 2015 cumulative capital allocation
Total: $3,380m
\ 20
Q4 and FY financial results
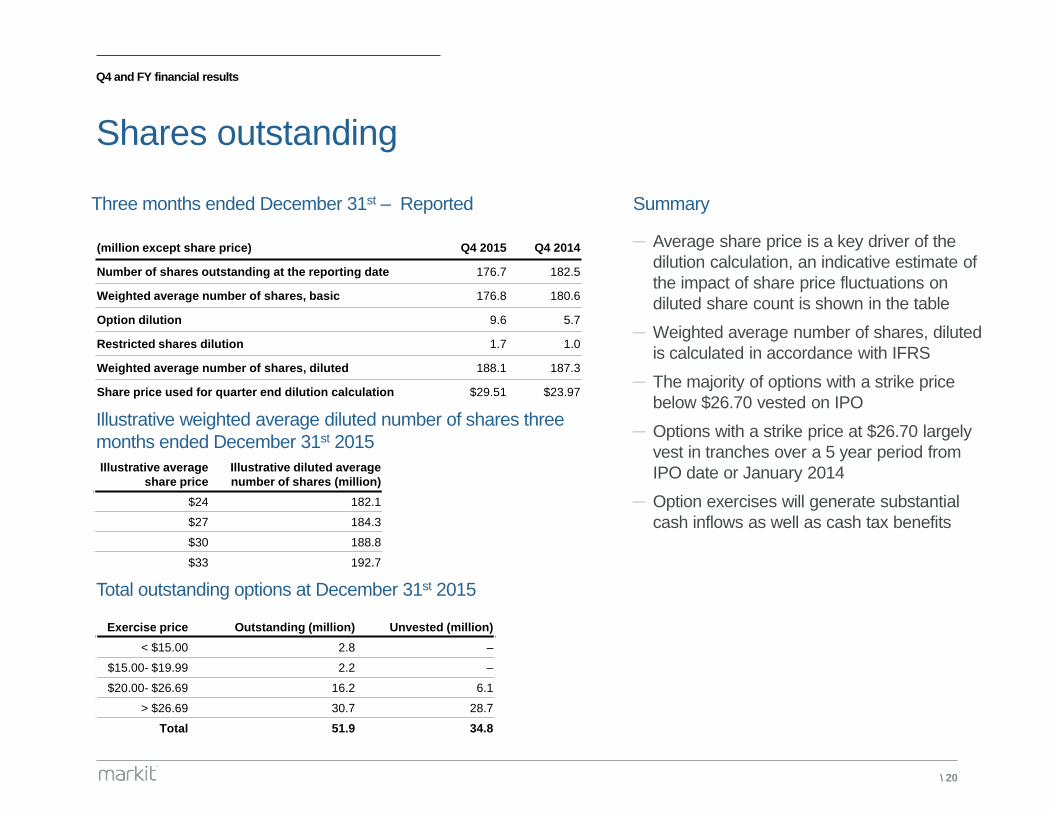
Shares outstanding
Summary
─ Average share price is a key driver of the
dilution calculation, an indicative estimate of
the impact of share price fluctuations on
diluted share count is shown in the table
─ Weighted average number of shares, diluted
is calculated in accordance with IFRS
─ The majority of options with a strike price
below $26.70 vested on IPO
─ Options with a strike price at $26.70 largely
vest in tranches over a 5 year period from
IPO date or January 2014
─ Option exercises will generate substantial
cash inflows as well as cash tax benefits
(million except share price) Q4 2015 Q4 2014
Number of shares outstanding at the reporting date 176.7 182.5
Weighted average number of shares, basic 176.8 180.6
Option dilution 9.6 5.7
Restricted shares dilution 1.7 1.0
Weighted average number of shares, diluted 188.1 187.3
Share price used for quarter end dilution calculation $29.51 $23.97
Illustrative average
share price
Illustrative diluted average
number of shares (million)
$24 182.1
$27 184.3
$30 188.8
$33 192.7
Exercise price Outstanding (million) Unvested (million)
< $15.00 2.8 –
$15.00- $19.99 2.2 –
$20.00- $26.69 16.2 6.1
> $26.69 30.7 28.7
Total 51.9 34.8
Three months ended December 31st – Reported
Illustrative weighted average diluted number of shares three
months ended December 31st 2015
Total outstanding options at December 31st 2015

\ 21
Sub-segment revenue summary
Sub-segment revenue – 3 year summary
($ million)
Segments FY 2013 FY 2014 FY 2015 CAGR %
FY2013 – 2015
Pricing and Reference Data 182.8 199.8 210.8 7.4%
Indices 86.6 91.5 99.1 7.0%
Valuation and Trading Services 190.2 195.2 191.7 0.4%
Information 459.6 486.5 501.6 4.5%
Processing 265.3 284.9 256.0 (1.8)%
Managed Services 131.6 167.6 202.1 23.9%
Enterprise Software 91.4 126.1 153.7 29.7%
Solutions 223.0 293.7 355.8 26.3%
Group 947.9 1,065.1 1,113.4 8.4%
Note: We reorganised certain products within our Information segment between the Pricing and Reference Data, Indices and Valuation and Trading Services sub-segments in 2014.
For comparability purposes, all prior year figures above have been presented to reflect this change.

\ 22
Q4 and FY 2015 financial results
Reconciliation to Adjusted EBITDA
($ million)
Q4 2015 Q4 2014 FY 2015 FY2014
Profit for the period 46.6 15.7 152.1 164.1
Income tax expense 19.9 19.7 70.0 56.5
Finance costs – net 7.2 4.1 18.9 16.9
Depreciation and amortisation - other 28.8 28.2 107.0 100.1
Amortisation – acquisition related 18.4 14.6 63.7 57.9
Acquisition related items 2.0 (1.4) 4.2 (12.4)
Exceptional items - 33.1 48.7 84.9
Share based compensation and related items 14.6 9.2 50.8 16.0
Other (gains) / losses – net (4.6) 3.0 (13.7) 6.0
Share of results from joint venture not attributable to
Adjusted EBITDA (0.4) (1.1) (2.4) (1.1)
Adjusted EBITDA attributable to non-controlling interests (0.7) -(0.4) (2.4) (0.7)
Adjusted EBITDA 131.8 124.7 496.9 488.2

\ 23
Q4 and FY 2015 financial results
Reconciliation to Adjusted Earnings
($ million)
Q4 2015 Q4 2014 FY 2015 FY 2014
Profit for the period 46.6 15.7 152.1 164.1
Amortisation – acquisition related 18.4 14.6 63.7 57.9
Acquisition related items 2.0 (1.4) 4.2 (12.4)
Exceptional items - 33.1 48.7 84.9
Share based compensation and related items 14.6 9.2 50.8 16.0
Other (gains) / losses – net (4.6) 3.0 (13.7) 6.0
Unwind of discount(1)
2.2 2.7 9.2 10.5
Tax effect of above adjustments (9.7) (6.9) (38.7) (47.4)
Adjusted Earnings attributable to non-controlling interests (0.7) (0.9) (2.4) (0.6)
Adjusted Earnings 68.8 69.1 273.9 279.0
Weighted average number of shares for computation of
earnings per share, diluted 188,093,760 187,335,924 189,796,719 184,467,540
1. Unwind of discount represents the non-cash unwinding of discount, recorded through finance costs – net in the income statement, primarily in relation to our share buyback liability.

\ 24
Q4 and FY 2015 financial results
Reconciliation to Adjusted earnings effective tax rate
($ million)
Q4 2015 Q4 2014 FY 2015 FY 2014
Income tax expense 19.9 19.7 70.0 56.5
Tax effect of adjusted earnings adjustments(1)
9.7 6.9 38.7 47.4
Tax on adjusted earnings (A) 29.6 26.6 108.7 103.9
Adjusted earnings(1)
68.8 69.1 273.9 279.0
Share of results from joint venture 3.2 5.9 11.3 5.9
Tax on adjusted earnings 29.6 26.6 108.7 103.9
Adjusted profit before tax (B) 101.6 101.6 393.9 388.8
Adjusted earnings effective tax rate (A divided by B) 29.1% 26.2% 27.6% 26.7%
1. See “Reconciliation to adjusted earnings”

\ 25
Q4 and FY 2015 financial results
Definitions
Revenue growth
We measure revenue growth in terms of organic revenue growth, acquisition related revenue growth, foreign currency impact on revenue growth and constant currency revenue growth. We
define these components as follows:
Organic – Revenue growth from continuing operations from factors other than acquisitions and foreign currency fluctuations. We derive organic revenue growth from the development of new
products and services, increased penetration of existing products and services to new and existing customers, price changes for our products and services and market driven factors such as
increased trading volumes or changes in customer assets under management.
Acquisition related – Revenue growth from acquired businesses through the end of the fiscal year following the fiscal year in which the acquisition was completed. This growth results from our
strategy of making targeted acquisitions that facilitate growth by complementing our existing products and services and addressing market opportunities.
Foreign currency – The impact on revenue growth resulting from the difference between current revenue at current exchange rates and current revenue at the corresponding prior period
exchange rates.
Constant currency – Total revenue growth, excluding the impact of exchange rate movements from the prior period to the current period. This is equal to the combination of organic and
acquisition related revenue growth, as described above.
Revenue by type
Revenue by type is how we classify the income recognised from the sale of our products and services into three groups as defined below:
Recurring fixed revenue – Revenue generated from contracts specifying a fixed fee for services delivered over the life of the contract. The fixed fee is typically paid annually, semiannually or
quarterly in advance. These contracts are typically subscription contracts where the revenue is recognised across the life of the contract. The initial term of these contracts can range from one to
five years and usually includes auto-renewal clauses.
Recurring variable revenue – Revenue derived from contracts that specify a fee for services which is typically not fixed. The variable fee is typically paid monthly in arrears. Recurring variable
revenue is based on, among other factors, the number of trades processed, assets under management or the number of positions we value. Many of these contracts do not have a maturity
date while the remainder have an initial term ranging from one to five years.
Non-recurring revenue – Revenue that relates to certain software license sales and the associated consulting revenue.
Other Non-IFRS Measures
Adjusted EBITDA is defined as profit for the period from continuing operations before income taxes, net finance costs, depreciation and amortisation on fixed assets and intangible assets
(including acquisition related intangible assets), acquisition related items, exceptional items, share based compensation and related items, net other gains or losses, including Adjusted EBITDA
attributable to joint ventures and excluding Adjusted EBITDA attributable to non-controlling interests.
Adjusted EBITDA margin is defined as Adjusted EBITDA divided by revenue, excluding revenue attributable to non-controlling interests.
LTM Adjusted EBITDA is defined as Adjusted EBITDA for the previous twelve month period from date reported.
Adjusted Earnings is defined as profit for the period from continuing operations before amortisation of acquired intangibles, acquisition related items, exceptional items, share based
compensation and related items, net other gains or losses and unwind of discount, less the tax effect of these adjustments and excluding Adjusted Earnings attributable to non-controlling
interests.
Adjusted EPS diluted is defined as Adjusted Earnings divided by the weighted average number of shares used to compute earnings per share, diluted.
Adjusted earnings effective tax rate is a rate calculated using income tax for the period adjusted for the tax effect of Adjusted earnings adjustments, divided by Adjusted earnings excluding
tax and excluding share of results from joint venture.
Leverage is defined as net debt divided by Adjusted EBITDA for the previous twelve month period from date reported.
Free cash flow is defined as net cash generated by or used in operating activities, less capital expenditure, purchases of property, plant and equipment and intangible assets.