Embed Size (px)
Citation preview
Fourth Quarter 2014 February 11, 2015
Genworth MI Canada Inc.
Q4 2014 Genworth MI Canada Inc. 2
Forward-Looking and Non-IFRS Statements
This presentation relating to Genworth MI Canada Inc. (the “Company”, “Genworth Canada” or “MIC”) includes certain forward-looking statements. These forward-looking statements include, but are not limited to, statements with respect to the Company’s future operating and financial results, expectations regarding premiums written, losses on claims and investment income, the Canadian housing market, and other statements that are not historical facts. These forward-looking statements may be identified by their use of words such as “may”, “would”, “could”, “will,” “intend”, “plan”, “anticipate”, “believe”, “seek”, “propose”, “estimate”, “expect”, and similar expressions. These statements are based on the Company’s current assumptions, including assumptions regarding economic, global, political, business, competitive, market and regulatory matters. These forward-looking statements are inherently subject to significant risks, uncertainties and changes in circumstances, many of which are beyond the control of the Company. The Company’s actual results may differ materially from those expressed or implied by such forward-looking statements, including as a result of changes in the facts underlying the Company’s assumptions, and the other risks described in the Company’s Annual Information Form dated March 17, 2014, its Short Form Base Shelf Prospectus dated June 18, 2014, the Prospectus Supplements thereto, its most recently issued Management’s Discussion and Analysis and all documents incorporated by reference in such documents. Other than as required by applicable laws, the Company undertakes no obligation to publicly update or revise any forward-looking statement, whether as a result of new information, future developments or otherwise.
To supplement its financial statements, the Company uses select non-IFRS financial measures. Non-IFRS financial measures include net operating income, interest and dividend income (net of investment expenses), operating earnings per common share (basic), operating earnings per common share (diluted), shareholders’ equity excluding accumulated other comprehensive income (“AOCI”), operating return on equity and underwriting ratios such as loss ratio, expense ratio and combined ratio. The Company believes that these non-IFRS financial measures provide meaningful supplemental information regarding its performance and may be useful to investors because they allow for greater transparency with respect to key metrics used by management in its financial and operational decision making. Non-IFRS measures do not have standardized meanings and are unlikely to be comparable to any similar measures presented by other companies. These measures are defined in the Company’s glossary, which is posted on the Company’s website at http://investor.genworthmicanada.ca. A reconciliation from non-IFRS financial measures to the most readily comparable measures calculated in accordance with IFRS, where applicable can be found in the Company’s most recent management’s discussion and analysis, which is posted on the Company’s website and is also available at www.sedar.com.
Q4 2014 Genworth MI Canada Inc. 3
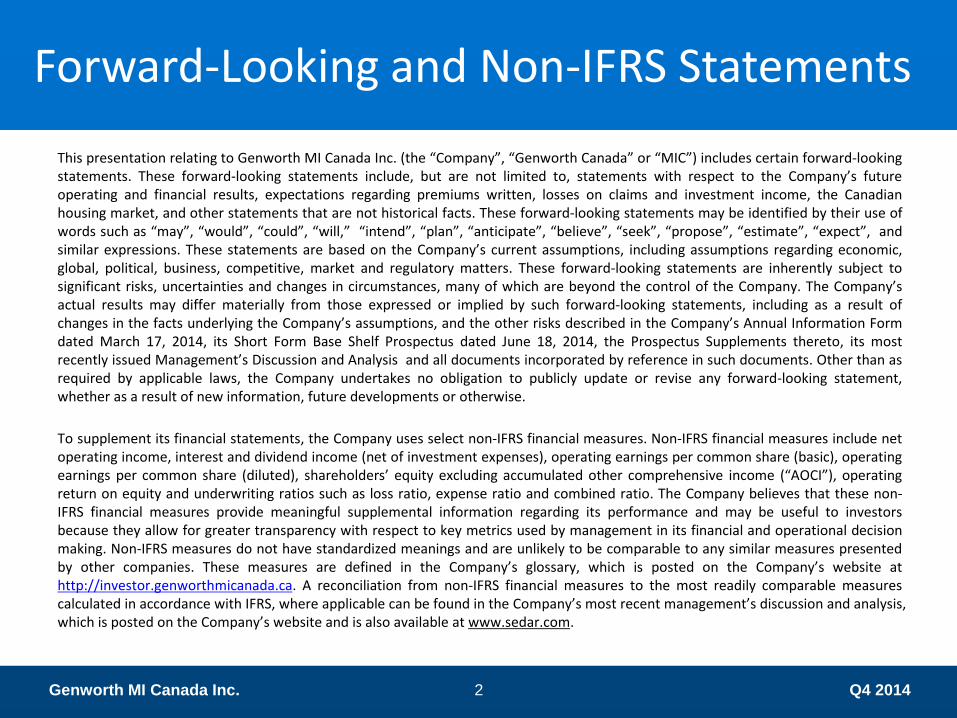
$32.53
$33.52
$34.17$34.57
$35.02
Q4 2013 Q1 2014 Q2 2014 Q3 2014 Q4 2014
$0.90$0.96
$1.04$0.97
$0.89
Q4 2013 Q1 2014 Q2 2014 Q3 2014 Q4 2014
2014 Financial Results
Q4 2014 Q/Q 2014 Y/Y
Premiums written $178 MM -18% $640 MM +25%
Loss ratio 26% +5 pts 20% -5 pts
Net Operating Income $84 MM -10% $366 MM +5%
Operating ROE 11% -1 pt 12% flat
Operating EPS (dil) $0.89 -8% $3.86 +7%
MCT1 225% +1 pt 225% +2 pts
Book Value Per Share (diluted, including AOCI)
Full Year Highlights
Strong top line growth of +25% Y/Y
Loss ratio of 20%, 5 points lower Y/Y
Seasonal losses driving EPS performance
Solid earnings performance and Y/Y book value growth of 8%
11% increase in the dividend paid in Q4 plus $0.43/share in a special dividend
Operating EPS (diluted)
1.Company estimate
Q4 2014 Genworth MI Canada Inc. 4
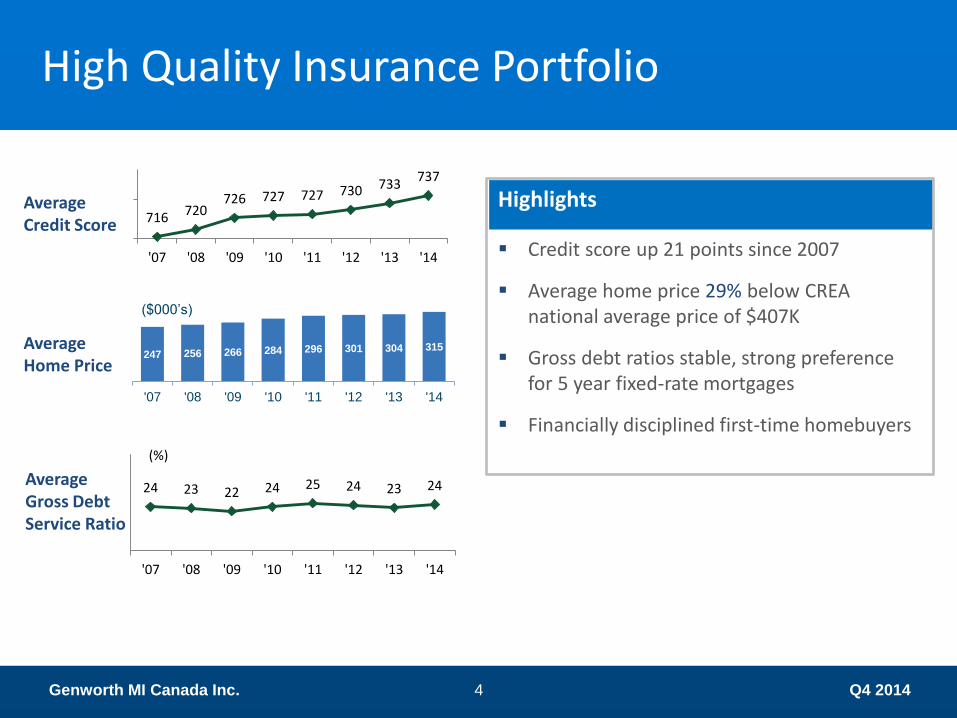
Highlights
Credit score up 21 points since 2007
Average home price 29% below CREA national average price of $407K
Gross debt ratios stable, strong preference for 5 year fixed-rate mortgages
Financially disciplined first-time homebuyers
High Quality Insurance Portfolio
Average Credit Score
Average Home Price
Average Gross Debt Service Ratio
716 720 726 727 727 730 733
737
'07 '08 '09 '10 '11 '12 '13 '14
247 256 266 284 296 301 304 315
'07 '08 '09 '10 '11 '12 '13 '14
($000’s)
24 23 22 24 25 24 23 24
'07 '08 '09 '10 '11 '12 '13 '14
(%)
Q4 2014 Genworth MI Canada Inc. 5
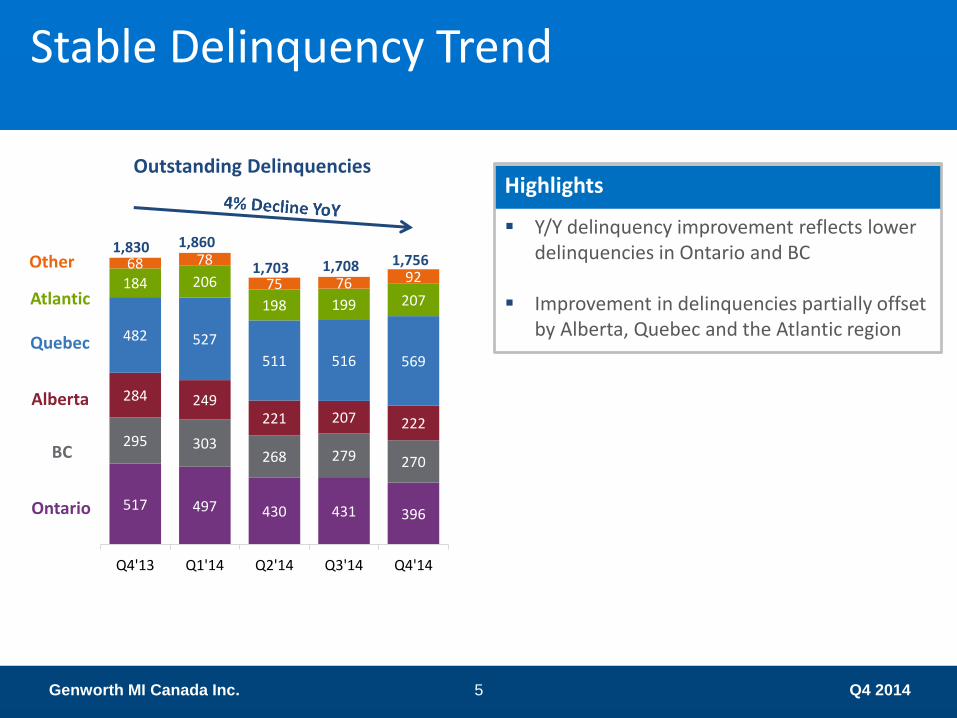
517 497 430 431 396
295 303 268 279 270
284 249 221 207 222
482 527
511 516 569
184 206
198 199 207
68 78
75 76 92
Q4'13 Q1'14 Q2'14 Q3'14 Q4'14
1,860 1,830
1,703 1,708 1,756
Outstanding Delinquencies
Stable Delinquency Trend
Ontario
BC
Alberta
Quebec
Atlantic
Highlights
Y/Y delinquency improvement reflects lower delinquencies in Ontario and BC
Improvement in delinquencies partially offset
by Alberta, Quebec and the Atlantic region
Other
Q4 2014 Genworth MI Canada Inc. 6
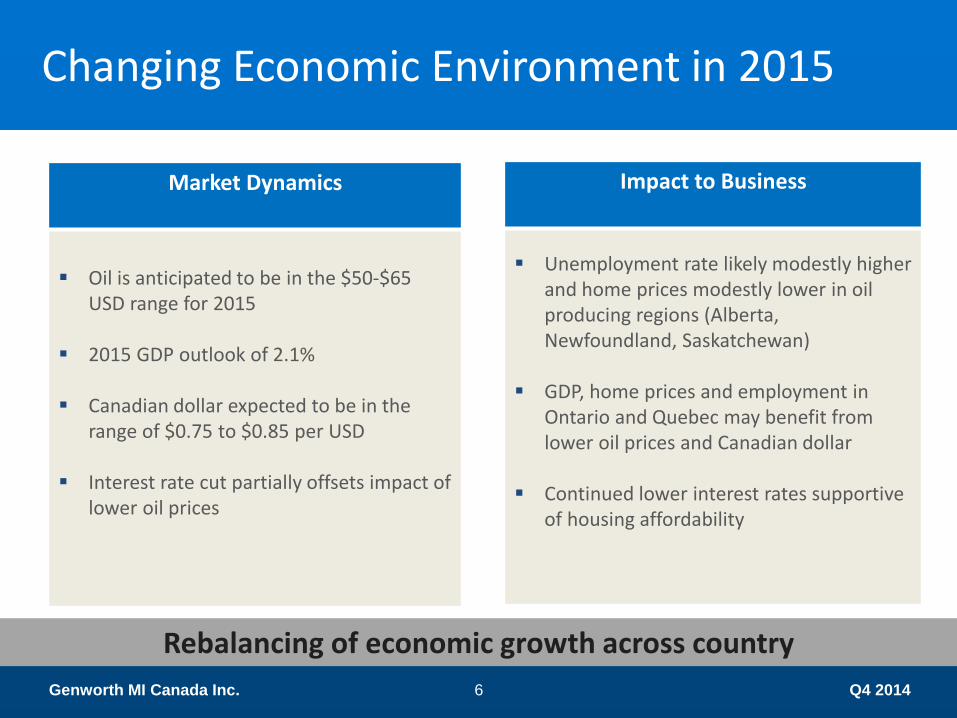
Changing Economic Environment in 2015
Market Dynamics
Oil is anticipated to be in the $50-$65 USD range for 2015
2015 GDP outlook of 2.1% Canadian dollar expected to be in the
range of $0.75 to $0.85 per USD Interest rate cut partially offsets impact of
lower oil prices
Impact to Business
Unemployment rate likely modestly higher and home prices modestly lower in oil producing regions (Alberta, Newfoundland, Saskatchewan)
GDP, home prices and employment in
Ontario and Quebec may benefit from lower oil prices and Canadian dollar
Continued lower interest rates supportive
of housing affordability
Rebalancing of economic growth across country
Q4 2014 Genworth MI Canada Inc. 7
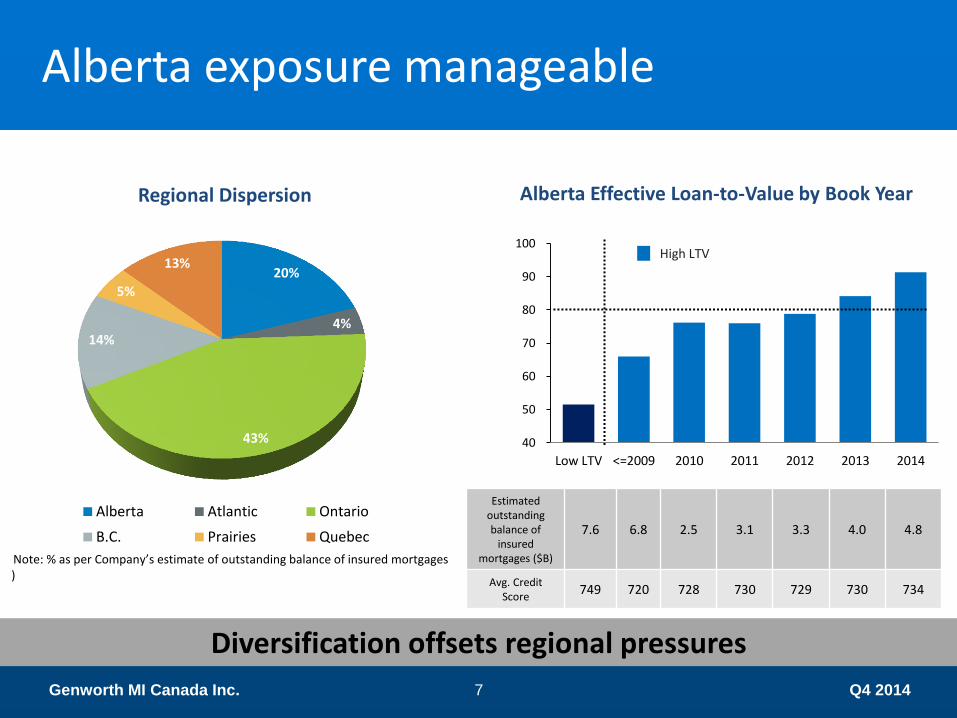
Alberta exposure manageable
20%
4%
43%
14%
5%
13%
Alberta Atlantic Ontario
B.C. Prairies Quebec
Regional Dispersion Alberta Effective Loan-to-Value by Book Year
Diversification offsets regional pressures
40
50
60
70
80
90
100
Low LTV <=2009 2010 2011 2012 2013 2014
High LTV
Estimated outstanding balance of
insured mortgages ($B)
7.6 6.8 2.5 3.1 3.3 4.0 4.8
Avg. Credit Score
749 720 728 730 729 730 734
Note: % as per Company’s estimate of outstanding balance of insured mortgages )
Q4 2014 Genworth MI Canada Inc. 8
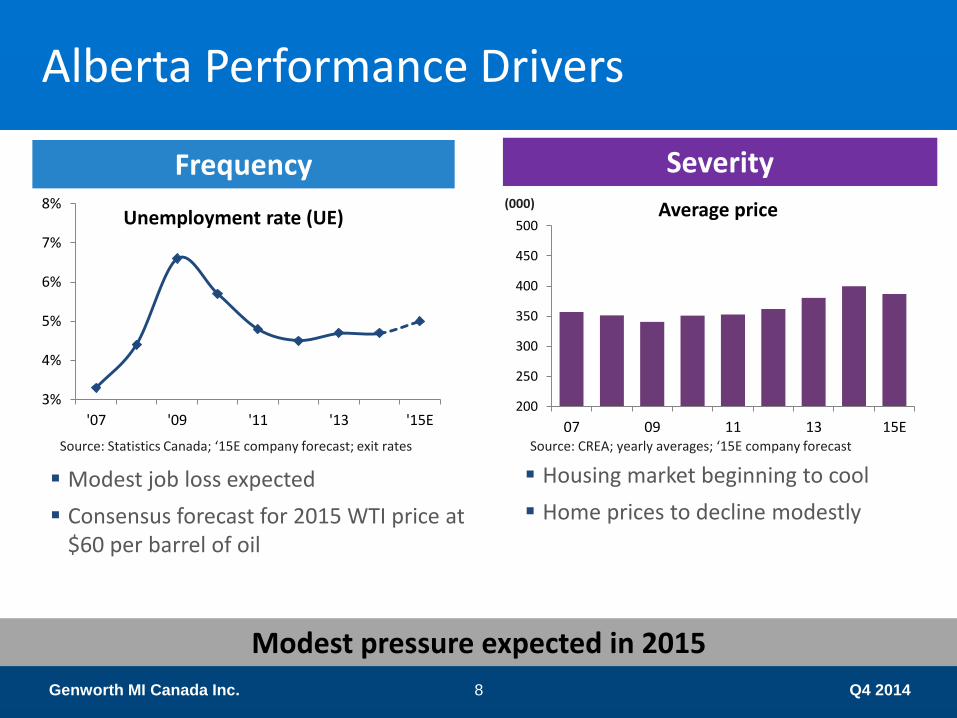
Alberta Performance Drivers
Frequency Severity
Modest job loss expected
Consensus forecast for 2015 WTI price at $60 per barrel of oil
Housing market beginning to cool
Home prices to decline modestly
3%
4%
5%
6%
7%
8%
'07 '09 '11 '13 '15E
Unemployment rate (UE)
200
250
300
350
400
450
500
07 09 11 13 15E
Average price (000)
Source: CREA; yearly averages; ‘15E company forecast Source: Statistics Canada; ‘15E company forecast; exit rates
Modest pressure expected in 2015
Q4 2014 Genworth MI Canada Inc. 9
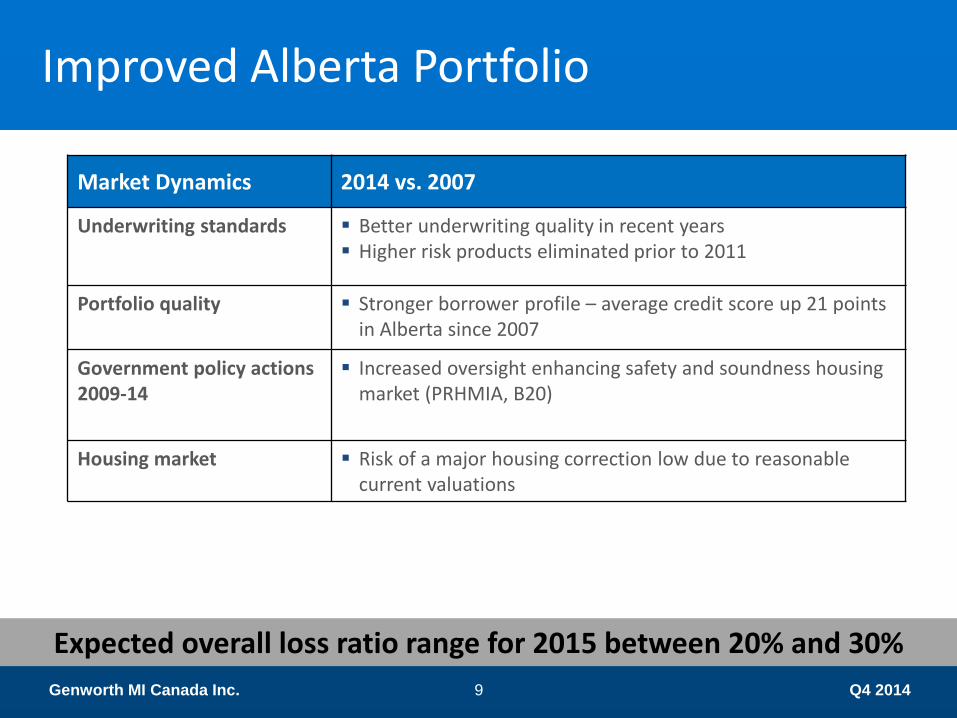
Improved Alberta Portfolio
Expected overall loss ratio range for 2015 between 20% and 30%
Market Dynamics 2014 vs. 2007
Underwriting standards Better underwriting quality in recent years Higher risk products eliminated prior to 2011
Portfolio quality Stronger borrower profile – average credit score up 21 points in Alberta since 2007
Government policy actions 2009-14
Increased oversight enhancing safety and soundness housing market (PRHMIA, B20)
Housing market Risk of a major housing correction low due to reasonable current valuations
Q4 2014 Genworth MI Canada Inc. 10
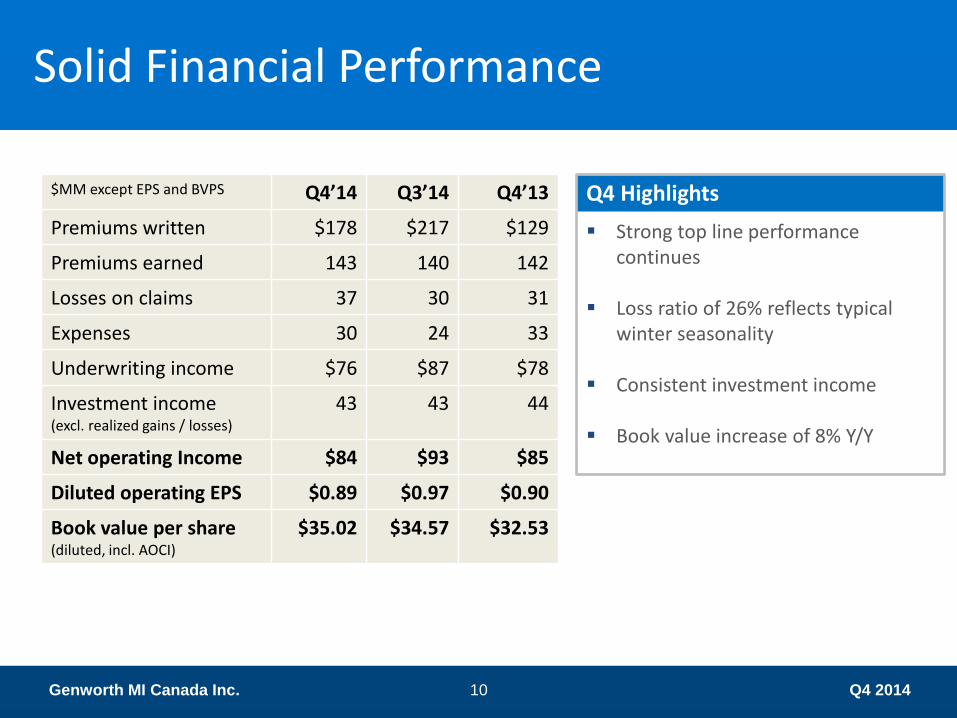
Solid Financial Performance
$MM except EPS and BVPS Q4’14 Q3’14 Q4’13
Premiums written $178 $217 $129
Premiums earned 143 140 142
Losses on claims 37 30 31
Expenses 30 24 33
Underwriting income $76 $87 $78
Investment income (excl. realized gains / losses)
43 43 44
Net operating Income $84 $93 $85
Diluted operating EPS $0.89 $0.97 $0.90
Book value per share (diluted, incl. AOCI)
$35.02 $34.57 $32.53
Q4 Highlights
Strong top line performance continues
Loss ratio of 26% reflects typical
winter seasonality Consistent investment income Book value increase of 8% Y/Y
Q4 2014 Genworth MI Canada Inc. 11
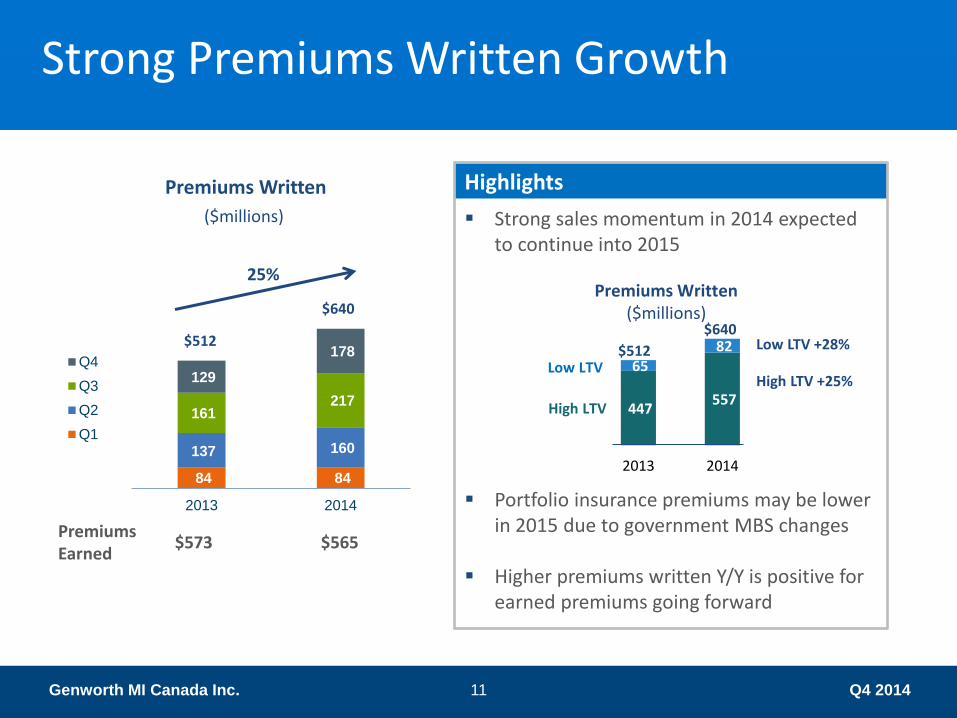
Strong Premiums Written Growth
Premiums Written
($millions)
Highlights
Strong sales momentum in 2014 expected to continue into 2015
Portfolio insurance premiums may be lower in 2015 due to government MBS changes
Higher premiums written Y/Y is positive for earned premiums going forward
84 84
137 160
161 217
129
178
2013 2014
Q4
Q3
Q2
Q1
25%
Premiums Earned
$573 $565
447 557
65 82
2013 2014
Premiums Written ($millions)
High LTV
Low LTV
Low LTV +28% $512
$640 $512
$640
High LTV +25%
Q4 2014 Genworth MI Canada Inc. 12
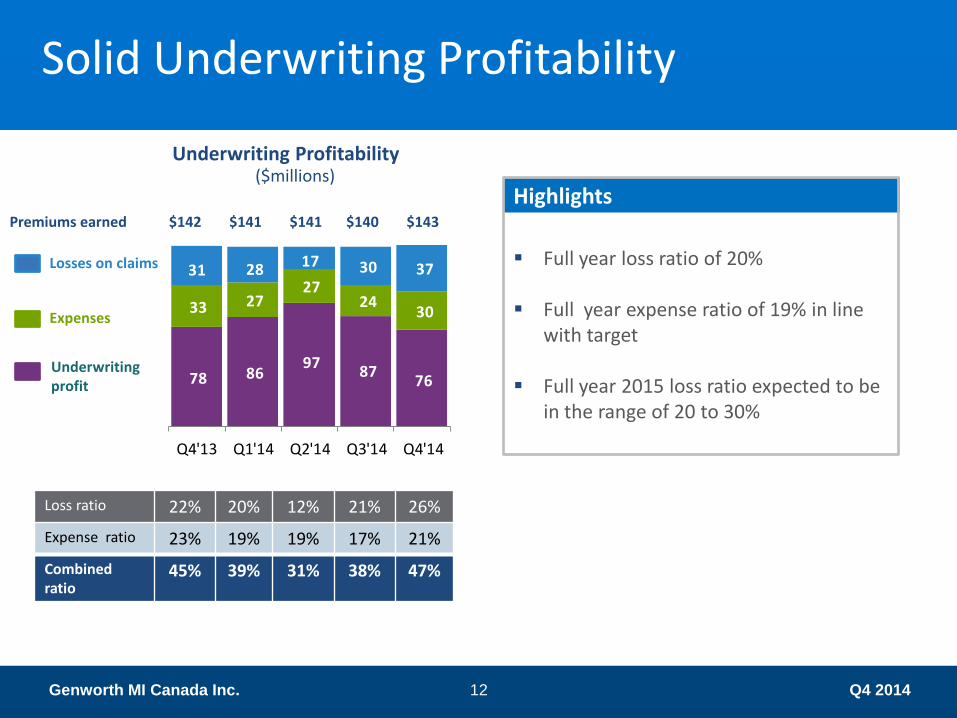
78 86 97
87 76
33 27 27
24 30
31 28 17 30 37
Q4'13 Q1'14 Q2'14 Q3'14 Q4'14
Solid Underwriting Profitability
Underwriting Profitability
Underwriting profit
Expenses
Losses on claims
Loss ratio 22% 20% 12% 21% 26%
Expense ratio 23% 19% 19% 17% 21%
Combined ratio
45% 39% 31% 38% 47%
($millions) Highlights
Full year loss ratio of 20% Full year expense ratio of 19% in line
with target
Full year 2015 loss ratio expected to be in the range of 20 to 30%
Premiums earned $142 $141 $141 $140 $143
Q4 2014 Genworth MI Canada Inc. 13
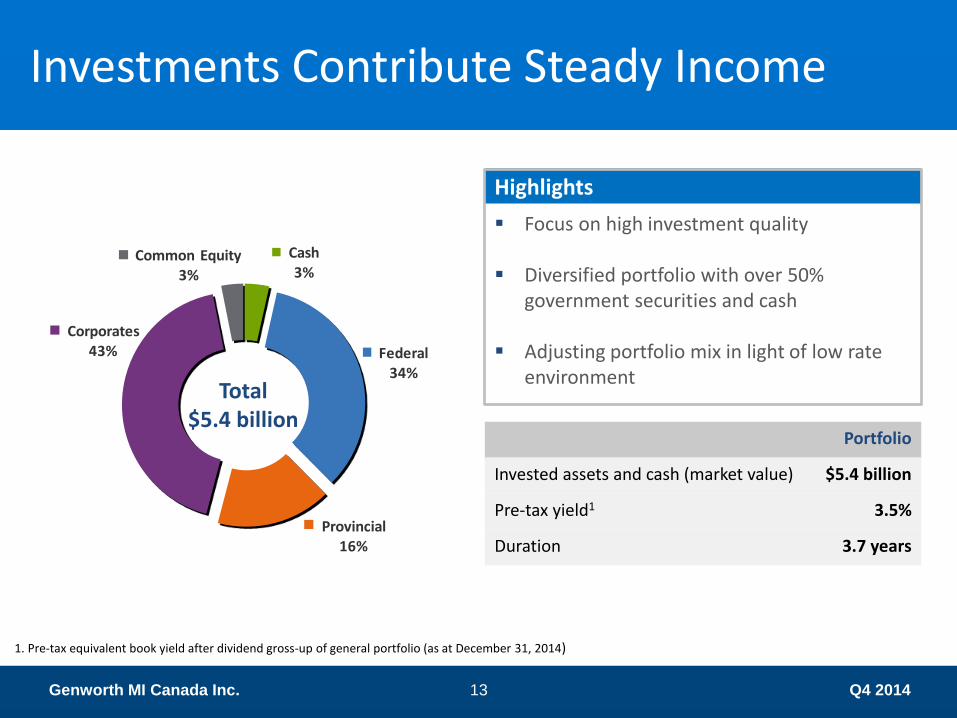
Cash3%
Federal34%
Provincial16%
Corporates 43%
Common Equity3%
Investments Contribute Steady Income
Total $5.4 billion
1. Pre-tax equivalent book yield after dividend gross-up of general portfolio (as at December 31, 2014)
Portfolio
Invested assets and cash (market value) $5.4 billion
Pre-tax yield1 3.5%
Duration 3.7 years
Highlights
Focus on high investment quality
Diversified portfolio with over 50% government securities and cash
Adjusting portfolio mix in light of low rate environment
Q4 2014 Genworth MI Canada Inc. 14
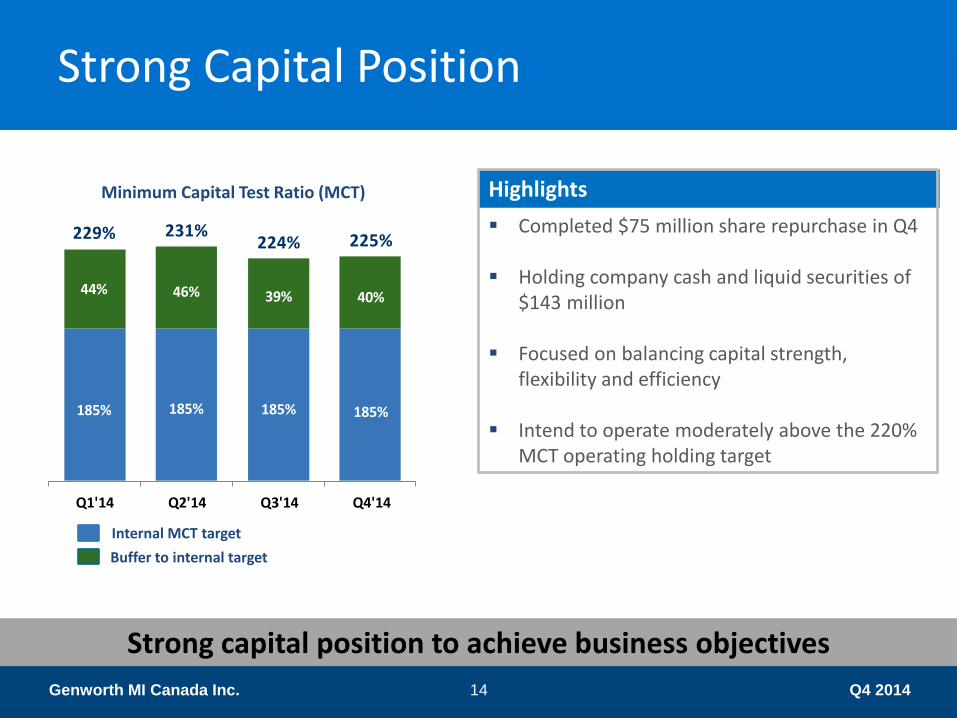
185% 185% 185% 185%
44% 46% 39% 40%
229% 231%224% 225%
Q1'14 Q2'14 Q3'14 Q4'14
Strong Capital Position
Minimum Capital Test Ratio (MCT)
Internal MCT target
Buffer to internal target
Highlights
Completed $75 million share repurchase in Q4
Holding company cash and liquid securities of $143 million
Focused on balancing capital strength,
flexibility and efficiency Intend to operate moderately above the 220%
MCT operating holding target
Strong capital position to achieve business objectives
Q4 2014 Genworth MI Canada Inc. 15
Building on Growth Momentum
Prudently expand market share
Proactive risk management and loss mitigation
Strong government relations
Efficient capital structure
Adjacent opportunities Employ and engage top talent
Well-positioned and remain focused on strategic course
Q4 2014 Genworth MI Canada Inc. 16
Question and Answer
Samantha Cheung Vice-President, Investor Relations 905.287.5482 [email protected] www.genworth.ca
Contact: