Embed Size (px)
Citation preview

1st NRG Corp. (OTCBB: FNRC.PK) is an exploration and production
company headquartered in Denver Colorado. Our activity has been centered
upon the development of coal bed methane reserves where we hold a working
interest in 42 producing wells, 1 permitted location, and 2,460 undeveloped
acres upon which we intend to permit an additional 35 locations. Most
recently, the Company has expanded its activities into one of North America’s
most exciting shale plays, through a development of prospective acreage in
SE Ohio encompassing approximately 7,000 acres.
In November 2013, the Company announced its participation agreement with
Energy Corporation of America (“ECA”), to jointly develop the SE Ohio
acreage.
Pursuant to the development agreement,
ECA commenced drilling of the Townley
1S – vertical test well in September 2014.
The Townley well reached TD at 7,620’ on
9/20/2014 and after running open hole logs
and coring tools the well was cased on
9/26/2014.
The Townley 1S identified potential reservoirs in the Utica shale, the Beekmantown
Dolomite and the Conasauga formation. The size of the Beekmantown and Conasauga
reservoirs was deemed insignificant for a company the size of ECA and the decline of
oil prices delay any horizontal development in the Utica. 1st NRG along with Keito Gas
will continue with the completion of the Townley well, with each company owning 50%

Ohio Properties
By completing the Townley 1S well, 1st NRG will keep the
development agreement in place with Keito Gas and the ability
to continue development on approximately 7,000 acres in SE
Ohio, including potential horizontal development of the
Utica/Point Pleasant Shale.
“Characterization of rotary sidewall core samples was conducted for the Townley IS well in Morgan County, Ohio
to define basic reservoir, geologic and petrologic properties, and to calibrate petrophysical log interpretations of
reservoir potential and OOIP. Of particular interest are samples collected from the Conasauga formation which
could provide a new resource play. The samples were received at W. D. Von Gonten Laboratories in College Station,
TX on September 26, 2014”
W. D. Von Gonten Laboratories in College Station, TX

The Conasauga formation is a Cambrian part of the Appalachian. The subterranean formation consists
of shales and carbonates over 15,000 feet (4,600 m) thick in certain areas. The Conasauga overlies the
Rome Formation, and in turn is overlain by the Knox Formation. No more than 50 holes have been drilled through
all or part of the rift-sequence in the Rome Trough. Several good gas and oil shows have been reported, the best of
which was an initial potential flow of between 5 and 9 MMCFGPD from the Exxon No. 1 McCoy well in Jackson
County, West Virginia. The well produced briefly before it was abandoned in 1975. The Mavity oil field, discovered
in 1967 in Boyd County, Kentucky, produced about 10,000 BO in 1-1/2 years from a sandstone in the upper part of
the Conasauga Group.
Resource potential: This play has potential for several undiscovered gas fields greater than 6 BCFG. A small oil
field and good gas and oil shows indicate that hydrocarbons are present in the rift sequence. Moreover, numerous
structures in the Rome Trough have not been tested. Several factors may limit the potential of the play: (1)
reservoirs may be widely scattered and of low quality, (2) source beds may be very local and lean, and (3) numerous
episodes of basement-fault reactivation may have permitted much of the gas to escape.

Townley 1S Well
Consauga Group wells south of our location
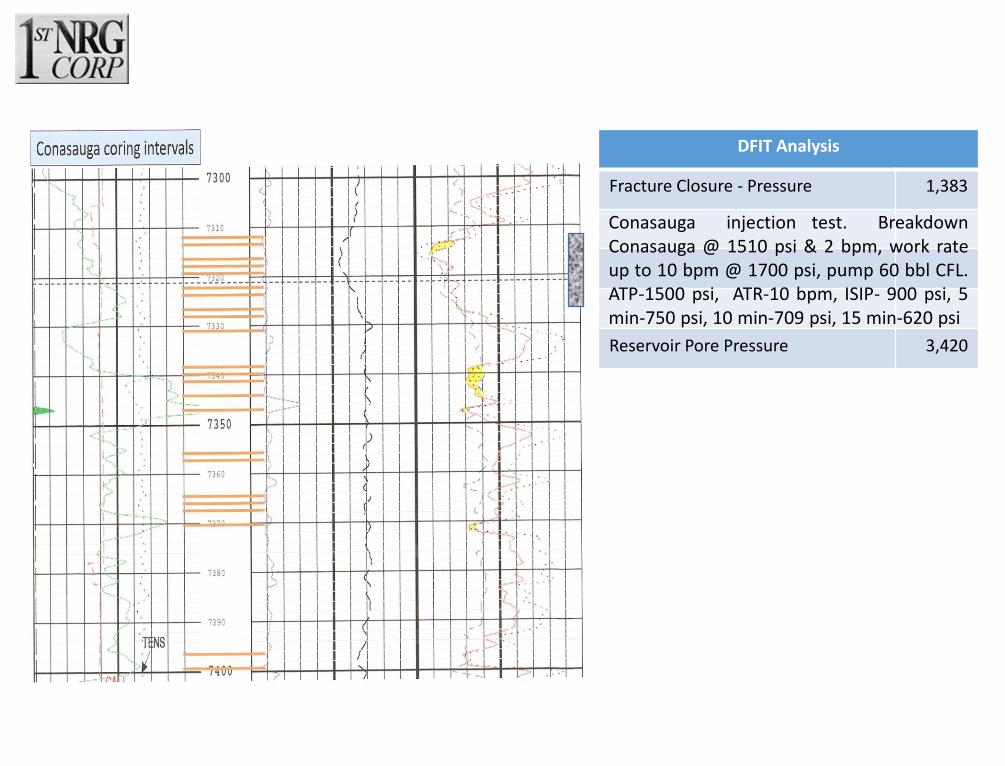
DFIT Analysis
Fracture Closure - Pressure 1,383
Reservoir Pore Pressure 3,420
Conasauga injection test. BreakdownConasauga @ 1510 psi & 2 bpm, work rateup to 10 bpm @ 1700 psi, pump 60 bbl CFL.ATP-1500 psi, ATR-10 bpm, ISIP- 900 psi, 5min-750 psi, 10 min-709 psi, 15 min-620 psi

Samples from the Conasauga formation were submitted for X-Ray Diffraction analysis, which aresummarized as follows:
Dolomite is the major mineral component while quartz and feldspars are minor components. Ankerite is presentin small amounts and calcite is only detected in two samples and in small amounts.
The clay fraction is small in all samples, generally less than 10%. Serpentine -a trioctahedral 1:1 clay mineral- isthe main component of the clay fraction. Serpentine is a Mg-rich clay which may have formed diageneticallyfrom the alteration of dolomite.
Serpentine is the only clay mineral above 7322 ft.
Below 7322 ft traces of chlorite and mica (illite) are present as well.
Expandable minerals were not found.
Carbonates Silicates - non clay Clay Minerals Accesory Minerals
Depth (ft) Dolomite Ankerlite Calcite Quartz
K-
Feldspar Serpentine Chlorite Mica/Iilite Pyrite Apalite Siderite Total %
% Clay
minerals
Grain
Density
7312 74.31% 3.87% 3.77% 13.02% 5.04% 100% 5.04% 2.80
7316 68.59% 3.92% 1.69% 9.36% 7.79% 7.12% 0.34% 1.18% 100% 7.12% 2.82
7318 64.80% 4.54% 11.85% 13.78% 4.44% 0.59% 100% 4.44% 2.79
7320 65.38% 2.06% 1.09% 8.08% 19.81% 3.24% 0.33% 100% 3.24% 2.78
7322 61.75% 3.80% 4.12% 21.91% 6.14% 0.87% 0.51% 0.90% 100% 7.01% 2.79
7326 74.34% 5.93% 8.37% 6.33% 3.09% 0.81% 0.64% 0.49% 100% 4.54% 2.83
7328 54.26% 0.94% 5.30% 31.39% 6.01% 0.94% 0.83% 0.34% 100% 7.78% 2.74
7336 88.04% 3.76% 0.75% 2.23% 3.70% 0.56% 0.66% 0.44% 100% 4.92% 2.86
7342 60.79% 3.72% 13.33% 12.82% 9.05% 0.29% 100% 9.34% 2.77
7356 69.42% 4.91% 5.79% 12.52% 2.89% 1.13% 2.48% 0.86% 100% 6.50% 2.82
7368 76.06% 4.20% 2.87% 7.97% 6.03% 0.75% 1.43% 0.47% 100% 8.21% 2.82
7399 66.30% 5.94% 7.55% 9.66% 7.36% 1.38% 0.86% 0.94% 100% 9.60% 2.82

Published industry DFIT analysis of unconventional reservoirs

2000
2100
2200
2300
2400
2500
2600
2700
2800
2900
3000
3100
3200
3300
3400
3500
3600
3700
3800
3900
4000
4100
4200
4300
4400
4500
4600
4700
Re
serv
oir
PSI
Conasaua Reservoir PressureFirst 24 Hours
Series1 Series2
Observations from Sapphire analysis.
Exhibits fractured reservoir behavior (composite reservoir, meaning it shows the combined responses of
the fracture network and the matrix)
Radial flow was clearly indicated (that's formation matrix contributing)
Estimated BHP = 3435 psia (P*), same as 3420 psig constant reading
Estimated formation perm 5.8 mD

2000
2100
2200
2300
2400
2500
2600
2700
2800
2900
3000
3100
3200
3300
3400
3500
3600
3700
3800
3900
4000
4100
4200
4300
4400
4500
4600
4700
Re
serv
oir
PSI
Conasauga Pressure Build Up Test -Daily
Downhole Pressure PSI Phydrostatic

1ST NRG CORP.
Conasauga Proformas
Five Year Projection
Year Ended
2015 2016 2017 2018 2019
Production - MCFE
Net to FNRC 43,216 157,642 293,018 373,669 439,021
43,216 157,642 293,018 373,669 439,021
Revenues 157,275 573,711 1,066,388 1,359,901 1,597,739
Total revenues 157,275 573,711 1,066,388 1,359,901 1,597,739
Costs and Expenses of
Operations
Transportation/gathering - - - - -
Lease operating expense 1,433 6,351 14,210 22,313 32,092
Production taxes 4,718 17,211 31,992 40,797 47,932
Total costs and expenses of
operations 6,151 23,562 46,201 63,110 80,024
Operating Margin 151,124 550,149 1,020,186 1,296,791 1,517,714
Cap X 200,000 300,000 400,000 300,000 300,000
Total Cap X 200,000 300,000 400,000 300,000 300,000
Net Cash Flow
Balance Forward (48,876) 201,273 821,460 1,818,251
Cash from Operations 151,124 550,149 1,020,186 1,296,791 1,517,714
Cap X (200,000) (300,000) (400,000) (300,000) (300,000)
Net Cash (48,876) 201,273 821,460 1,818,251 3,035,965
-
1,000
2,000
3,000
4,000
5,000
6,000
7,000
8,000
9,000
10,000
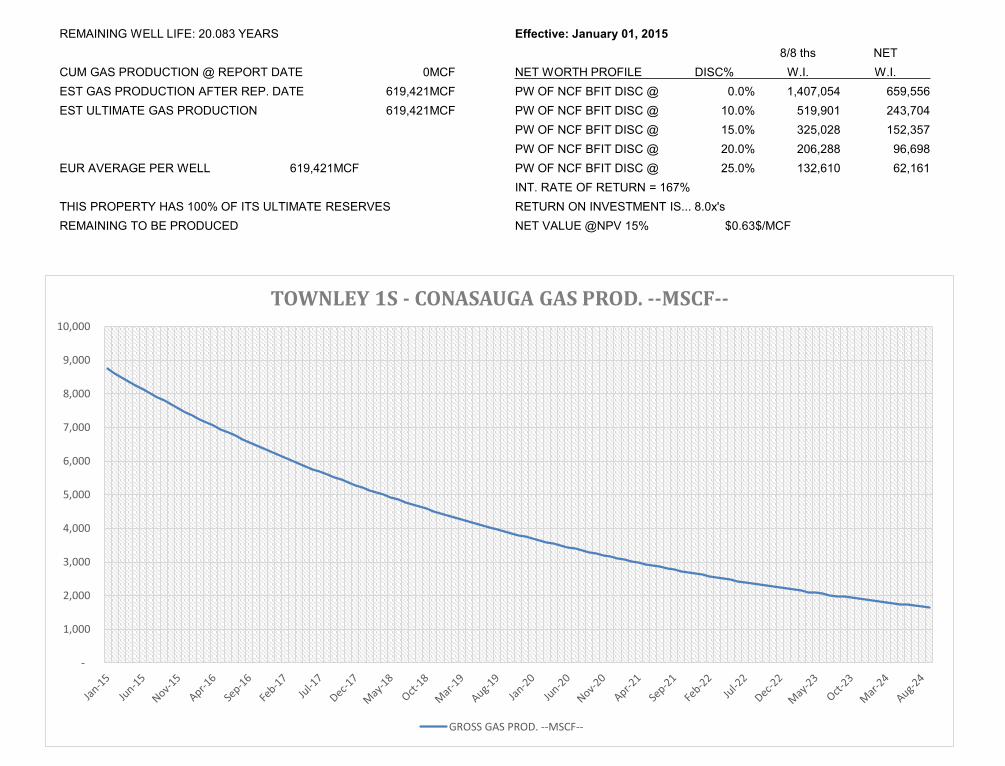
TOWNLEY 1S - CONASAUGA GAS PROD. --MSCF--
GROSS GAS PROD. --MSCF--
REMAINING WELL LIFE: 20.083 YEARS Effective: January 01, 2015
8/8 ths NET
CUM GAS PRODUCTION @ REPORT DATE 0 MCF NET WORTH PROFILE DISC% W.I. W.I.
EST GAS PRODUCTION AFTER REP. DATE 619,421 MCF PW OF NCF BFIT DISC @ 0.0% 1,407,054 659,556
EST ULTIMATE GAS PRODUCTION 619,421 MCF PW OF NCF BFIT DISC @ 10.0% 519,901 243,704
PW OF NCF BFIT DISC @ 15.0% 325,028 152,357
PW OF NCF BFIT DISC @ 20.0% 206,288 96,698
EUR AVERAGE PER WELL 619,421 MCF PW OF NCF BFIT DISC @ 25.0% 132,610 62,161
INT. RATE OF RETURN = 167%
THIS PROPERTY HAS 100% OF ITS ULTIMATE RESERVES RETURN ON INVESTMENT IS... 8.0x's
REMAINING TO BE PRODUCED NET VALUE @NPV 15% $0.63 $/MCF
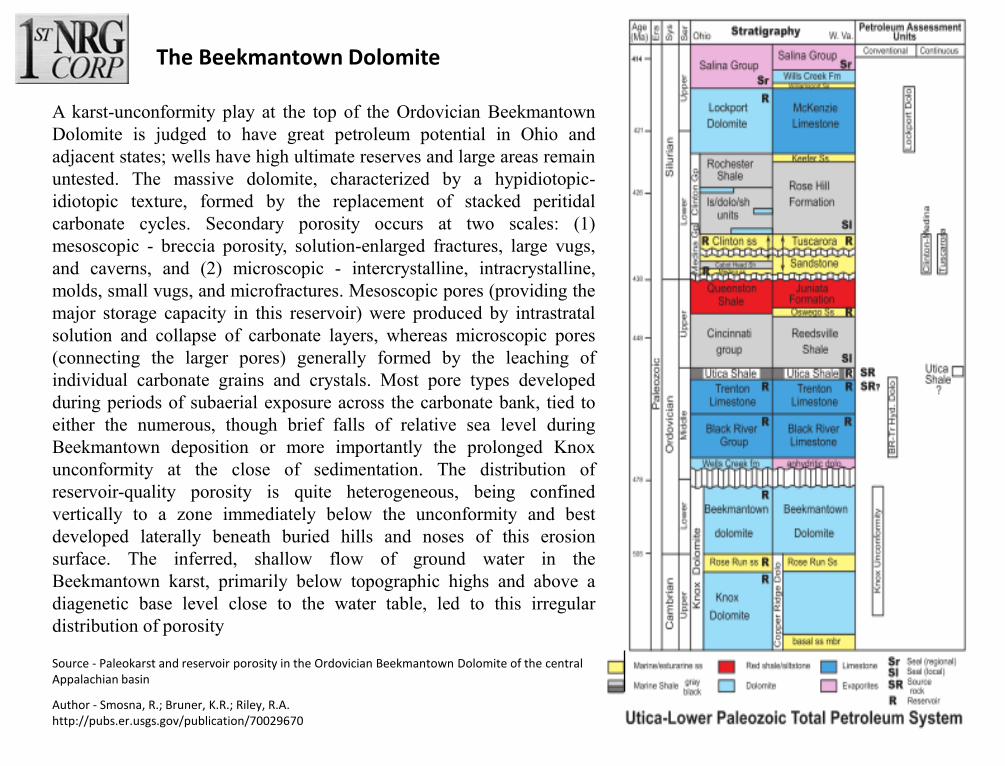
The Beekmantown Dolomite
A karst-unconformity play at the top of the Ordovician Beekmantown
Dolomite is judged to have great petroleum potential in Ohio and
adjacent states; wells have high ultimate reserves and large areas remain
untested. The massive dolomite, characterized by a hypidiotopic-
idiotopic texture, formed by the replacement of stacked peritidal
carbonate cycles. Secondary porosity occurs at two scales: (1)
mesoscopic - breccia porosity, solution-enlarged fractures, large vugs,
and caverns, and (2) microscopic - intercrystalline, intracrystalline,
molds, small vugs, and microfractures. Mesoscopic pores (providing the
major storage capacity in this reservoir) were produced by intrastratal
solution and collapse of carbonate layers, whereas microscopic pores
(connecting the larger pores) generally formed by the leaching of
individual carbonate grains and crystals. Most pore types developed
during periods of subaerial exposure across the carbonate bank, tied to
either the numerous, though brief falls of relative sea level during
Beekmantown deposition or more importantly the prolonged Knox
unconformity at the close of sedimentation. The distribution of
reservoir-quality porosity is quite heterogeneous, being confined
vertically to a zone immediately below the unconformity and best
developed laterally beneath buried hills and noses of this erosion
surface. The inferred, shallow flow of ground water in the
Beekmantown karst, primarily below topographic highs and above a
diagenetic base level close to the water table, led to this irregular
distribution of porosity
Source - Paleokarst and reservoir porosity in the Ordovician Beekmantown Dolomite of the central Appalachian basin
Author - Smosna, R.; Bruner, K.R.; Riley, R.A.http://pubs.er.usgs.gov/publication/70029670
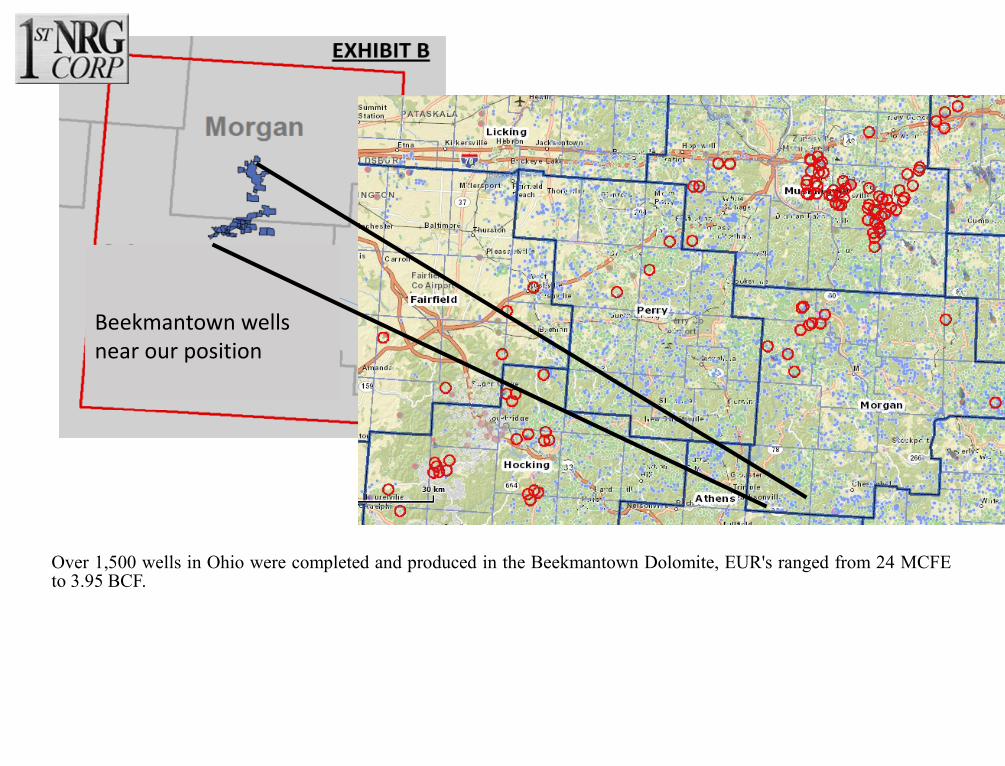
Beekmantown wells near our position
Over 1,500 wells in Ohio were completed and produced in the Beekmantown Dolomite, EUR's ranged from 24 MCFEto 3.95 BCF.

Beekmantown Dolomite
Townley 1S
Beekmantown
Resistivity 190
Porosity 8%
Thickness 25
RW .033
Water Saturation 17%
Formation Depth 6420

Beekmantown – Mud Log

1ST NRG CORP.
Beekmantown
Five Year Projection
Year Ended
2015 2016 2017 2018 2019
Production - MCFE
Net to FNRC 181,890 663,501 1,233,284 1,572,735 1,847,795
181,890 663,501 1,233,284 1,572,735 1,847,795
Revenues 1,534,262 5,596,706 10,402,893 13,266,199 15,586,362
Total revenues 1,534,262 5,596,706 10,402,893 13,266,199 15,586,362
Costs and Expenses of
Operations
Transportation/gathering - - - - -
Lease operating expense 14,328 63,510 142,095 223,130 320,923
Production taxes 46,028 167,901 312,087 397,986 467,591
Total costs and expenses of
operations 60,356 231,411 454,182 621,116 788,514
Operating Margin 1,473,906 5,365,295 9,948,711 12,645,082 14,797,848
Cap X 700,000 1,050,000 1,400,000 1,050,000 1,050,000
Total Cap X 700,000 1,050,000 1,400,000 1,050,000 1,050,000
Net Cash Flow
Balance Forward 773,906 5,089,201 13,637,912 25,232,994
Cash from Operations 1,473,906 5,365,295 9,948,711 12,645,082 14,797,848
Cap X (700,000) (1,050,000) (1,400,000) (1,050,000) (1,050,000)
Net Cash 773,906 5,089,201 13,637,912 25,232,994 38,980,842

100
1,000
10,000
100,000
Jan
-15
Jun
-15
No
v-1
5
Ap
r-1
6
Sep
-16
Feb
-17
Jul-
17
De
c-1
7
May
-18
Oct
-18
Mar
-19
Au
g-1
9
Jan
-20
Jun
-20
No
v-2
0
Ap
r-2
1
Sep
-21
Feb
-22
Jul-
22
De
c-2
2
May
-23
Oct
-23
Mar
-24
Au
g-2
4
Jan
-25
Jun
-25
No
v-2
5
Ap
r-2
6
Sep
-26
Feb
-27
Jul-
27
De
c-2
7
May
-28
Oct
-28
Mar
-29
Au
g-2
9
B
b
l
s
/
M
o
n
t
h
M
c
f
/
M
o
n
t
h
Beekmantown Model Production Curve
OIL
GAS
REMAINING WELL LIFE: 17.083 YEARS Effective: January 01, 2015
8/8 ths NET
CUM GAS PRODUCTION @ REPORT DATE 0 MCF NET WORTH PROFILE DISC% W.I. W.I.
EST GAS PRODUCTION AFTER REP. DATE 2,694,892 MCF PW OF NCF BFIT DISC @ 0.0% 16,070,220 7,532,916
EST ULTIMATE GAS PRODUCTION 2,694,892 MCF PW OF NCF BFIT DISC @ 10.0% 10,121,340 4,744,378
PW OF NCF BFIT DISC @ 15.0% 8,318,773 3,899,425
PW OF NCF BFIT DISC @ 20.0% 6,961,851 3,263,367
EUR AVERAGE PER WELL 2,694,892 MCF PW OF NCF BFIT DISC @ 25.0% 5,913,876 2,772,129
INT. RATE OF RETURN = 634%
THIS PROPERTY HAS 100% OF ITS ULTIMATE RESERVES RETURN ON INVESTMENT IS... 22.5x's
REMAINING TO BE PRODUCED NET VALUE @NPV 15% $3.70 $/MCF
IP – 322 mcfd161 bopd
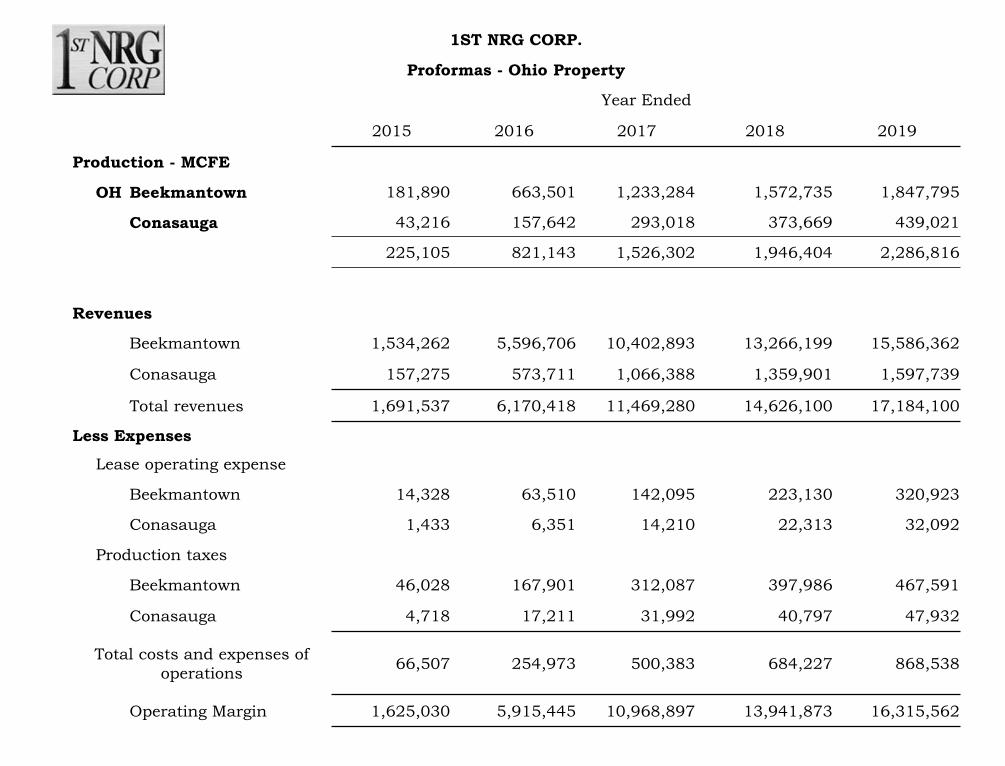
1ST NRG CORP.
Proformas - Ohio Property
Year Ended
2015 2016 2017 2018 2019
Production - MCFE
OH Beekmantown 181,890 663,501 1,233,284 1,572,735 1,847,795
Conasauga 43,216 157,642 293,018 373,669 439,021
225,105 821,143 1,526,302 1,946,404 2,286,816
Revenues
Beekmantown 1,534,262 5,596,706 10,402,893 13,266,199 15,586,362
Conasauga 157,275 573,711 1,066,388 1,359,901 1,597,739
Total revenues 1,691,537 6,170,418 11,469,280 14,626,100 17,184,100
Less Expenses
Lease operating expense
Beekmantown 14,328 63,510 142,095 223,130 320,923
Conasauga 1,433 6,351 14,210 22,313 32,092
Production taxes
Beekmantown 46,028 167,901 312,087 397,986 467,591
Conasauga 4,718 17,211 31,992 40,797 47,932
Total costs and expenses of
operations66,507 254,973 500,383 684,227 868,538
Operating Margin 1,625,030 5,915,445 10,968,897 13,941,873 16,315,562