Embed Size (px)
Citation preview

Investor and Analyst DayMarch 30, 2016

Forward Looking Information
Both these slides that you will be presented today and the accompanying oral presentations contain certain forward-looking statements within themeaning of the United States Private Securities Litigation Reform Act of 1995 and forward-looking information within the meaning of the Securities Act(Ontario). Forward-looking statements involve known and unknown risks, uncertainties and other factors which may cause the actual results,performance or achievements of Teck to be materially different from any future results, performance or achievements expressed or implied by theforward-looking statements. These forward-looking statements include statements relating to management’s expectations with respect to Teck’s costs,production, expenditures, financial projections and guidance, production targets and guidance and those other statements identified in the slides titled“Forward Looking Information” in each of the individual presentations. The “Forward Looking Information” slide in each individual presentation isincorporated by reference and please refer to each of those slides for further information.
These forward-looking statements involve numerous assumptions, risks and uncertainties and actual results may vary materially. These statements arebased on a number of assumptions, including, but not limited to, assumptions regarding general business and economic conditions, interest rates, thesupply and demand for, inventories of, and the level and volatility of prices of our products, the timing of receipt of regulatory and governmental approvalsfor Teck’s expansions, Teck’s costs of production and production and productivity levels, as well as those of its competitors, market competition, theaccuracy of Teck’s reserve and resources estimates and the geological, operational and price assumptions on which these are based, tax benefits, theresolution of environmental and other proceedings, our ongoing relations with our employees and partners and joint venturers, performance by customersand counterparties of their contractual obligations, and the future operational and financial performance of the company generally. Each of the slidestitled “Forward Looking Information” in the individual presentations describe additional assumptions for the forward-looking statements included in thatpresentation.
Events or circumstances could cause actual results to differ materially. Factors that may cause actual results to vary include, but are not limited to:unanticipated developments in business and economic conditions in the principal markets for Teck’s products or in the supply, demand, and prices formetals and other commodities to be produced, changes in interest or currency exchange rates, inaccurate geological assumptions (including with respectto the size, grade and recoverability of reserves and resources), legal disputes or unanticipated outcomes of legal proceedings, unanticipated operationaldifficulties (including failure of plant, equipment or processes to operate in accordance with specifications or expectations, cost escalation, unavailabilityof materials and equipment, government action or delays in the receipt of permits or government approvals, industrial disturbances or other job action,and unanticipated events related to health, safety and environmental matters), decisions made by our partners or co-venturers, social unrest, failure ofsuppliers to meet their contractual commitments and changes in general economic conditions or conditions in the financial markets. Each of the slidestitled “Forward Looking Information” in the individual presentations describe events and uncertainties that could cause actual results to differ materially.
Certain of these risks and the risks described in the slides titled “Forward Looking Information” in each of the individual presentations are described inmore detail in Teck’s annual information form available under Teck’s corporate profile at www.sedar.com and www.sec.gov. Teck does not assume theobligation to revise or update these forward-looking statements after the date of this document or to revise them to reflect the occurrence of futureunanticipated events, except as may be required under applicable securities laws.

Overview and StrategyMarch 30, 2016Don Lindsay, President & Chief Executive Officer

Top ten copper miner in the Americas
#3 zinc miner in the world
Building an energy business
# 1 Producer of steelmaking coal in North America
# 2 Seaborne exporter of steelmaking coal globally
Safety is a core value
Implementing a comprehensive sustainability strategy
Overview and Strategy
Canada’s Largest Diversified Resources Company
3

Overview and Strategy
Senior Management Planned Retirements
Ray ReipasSenior Vice President, Energy
Tim WatsonSenior Vice President, Project Development
Rob ScottSenior Vice President, Zinc
Ian KilgourExecutive Vice President & Chief Operating Officer
4

Overview and Strategy
Senior Management Update
• Continued strong leadership• Closer reporting relationship between GMs and senior executives• Further aligned to current business environment
Dale AndresSVP, Base Metals
Robin Sheremeta
SVP, Coal
Andrew StonkusSVP, Sales & Marketing
Copper Operations
Zinc Operations
Coal Operations
Energy Sales &
Marketing
Base Metals Sales &
Marketing
CoalSales &
Marketing
Alex ChristopherSVP, Exploration, Projects
& Technical Services
ExplorationEngineering & Related Activities
5
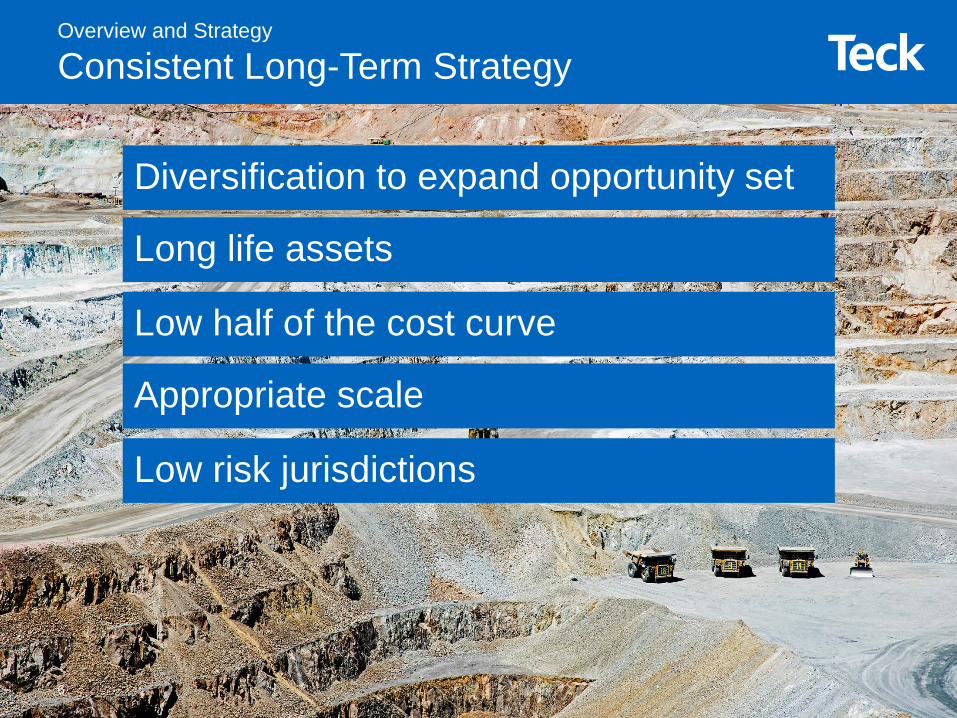
Diversification to expand opportunity set
Long life assets
Low half of the cost curve
Appropriate scale
Low risk jurisdictions
Overview and Strategy
Consistent Long-Term Strategy
6

• Based in Vancouver, Canada, with operations in the Americas
• Strategy focused on long life assets in stable jurisdictions
• Sustainability: Key to managing risks and developing opportunities
Strong Resource Position1
With Sustainable Long-Life AssetsCoal Resources ~100 years
Copper Resources ~30 years
Zinc Resources ~15 years
Energy Resources ~50 years
Overview and Strategy
Attractive Portfolio of Long-Life Assets
1. Reserve and resource life estimates refer to the mine life of the longest lived resource in the relevant commodity assuming production at planned rates and in some cases development of as yet undeveloped projects. See the reserve and resource disclosure in our most recent Annual Information Form, available on SEDAR and EDGAR, for additional detail regarding underlying assumptions.
7

Overview and Strategy
Plan to Navigate an Extended Low Price Environment & Emerge Stronger
Strength of our diversified portfolio of long-life assets & resources
Strong operating execution
Target for positive cash flow from core business
Finish building Fort Hills
Protect our strong financial position
8

Overview and Strategy
Core Business Free Cash Flow vs. Development Project Cash Flow
Cost management delivering improvements in Free Cash Flow2, despite weakening prices
Target for positive cash flow
Funding from internal sources in 2016; Current cash balance > remaining capital1
Fort Hills Development Project Core Business
Potential future free cash flow
Teck’s total share of capital $2.94B
Remaining capital (as of February 10th, 2016)
$1.2 B
Teck cash balance(as of February 10th, 2016)
~$1.8 B(100)
-
100
200
Q1 14 Q2 14 Q3 14 Q4 14 Q1 15 Q2 15 Q3 15 Q4 15C
$ M
illion
s
Free Cash Flow, Before Fort Hills Capex
1. As of February 10, 2016. Based on Suncor’s planned project spending. Sanction capital is the go-forward amount from the date of the Fort Hills sanction decision (October 30, 2013), denominated in Canadian dollars and on a fully-escalated basis.
2. Free Cash Flow is Net Cash from Operations, before changes in Working Capital, less Investing activity excluding Fort Hills capital expenditures, not including proceeds from sales of investments, less interest paid and distributions to minority interests.
9

Overview and Strategy
Near-Term Priorities
10 1. Assumes current commodity prices and exchange rates, Teck’s 2016 guidance for production, costs and capital expenditures, existing US$ debt levels and no unusual transactions.
• Target for positive cash flow from core business
• Fund Fort Hills from internal sources in 2016
• Protect our strong financial position− Target for US$3B credit facility
to remain undrawn in 2016− Expect year-end cash balance
of >$500M1
− Evaluating opportunities to further strengthen liquidity
Overview and Strategy
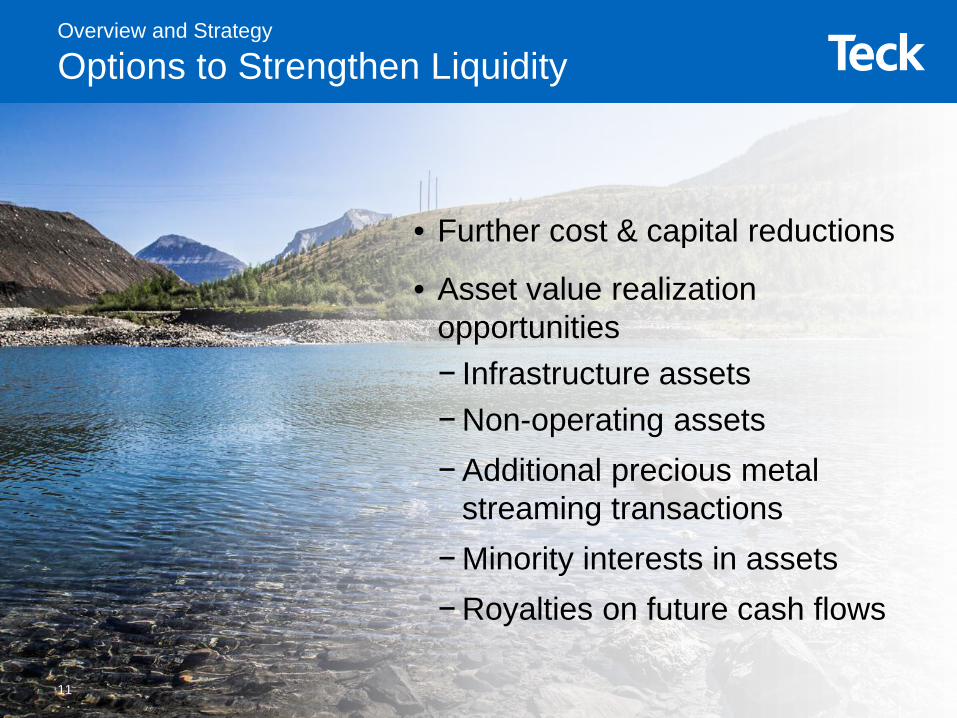
Options to Strengthen Liquidity
• Further cost & capital reductions
• Asset value realization opportunities− Infrastructure assets−Non-operating assets−Additional precious metal
streaming transactions−Minority interests in assets−Royalties on future cash flows
11

FinanceMarch 30, 2016Ron Millos, Senior Vice President, Finance & Chief Financial Officer

Finance
Agenda
2015 Overview
Balance Sheet & Liquidity
2016 Guidance & Overview
Summary
3

Diversified gross profit
Focus on costs has delivered improvements in free cash flow
Strong balance sheet and liquidity
Extended debt maturities consistent with long-life assets
Well positioned to finance capital spending plans
4
Finance
Navigating Difficult Market Conditions

Guidance Results
Steelmaking CoalProduction1 25-26 Mt 25.3 Mt
Site costs C$49-53/t C$45/t
Transportation costs C$37-40/t C$36/t
Combined costs2 C$86-93 /t C$83/tUS$64/t Lower unit costs at all mines
CopperProduction 340-360 kt 358 kt Record mill throughput at Antamina
Cash unit costs3 US$1.45-1.55 /lb US$1.45/lb Lower unit costs at all mines
ZincMetal in concentrate production4 635-665 kt 658 kt
Refined production 280–290 kt 307 kt Record production at Trail
Capital Expenditures5 $2.3B $2.2B Lower capex
Finance
Solid Delivery Against 2015 Guidance
1. Reflects mid-year revision for temporary shutdowns.2. Combined coal costs are site costs, inventory adjustments and transportation costs.3. Net of by-product credits.4. Including co-product zinc production from our copper business unit.5. Including capitalized stripping.
5

0%
25%
50%
75%
100%
2005 2006 2007 2008 2009 2010 2011 2012 2013 2014 2015
Coal Copper Zinc
Gross Profit Before Depreciation and Amortization
Finance
Diversified Gross Profit (before depreciation & amortization)
6

Teck has good leverage to stronger zinc and copper markets, and benefits from the weaker Canadian dollar
Finance
The Value of Our Diversified Business Model
Cash Operating Profit 2015
Production Guidance1
Unit of Change
Estimated Profit 2
EstimatedEBITDA2
$C/$US C$0.01 $22M /$.01∆ $34M /$.01∆
Coal 25.5 Mt US$1/tonne $23M /$1∆ $35M /$1∆
Copper 312 kt US$0.01/lb $6M /$.01∆ $9M /$.01∆
Zinc 940 kt US$0.01/lb $9M /$.01∆ $14M /$.01∆
2016 Leverage to Commodities & FX
1. Based on mid-point of 2016 guidance ranges. Zinc includes 645 kt of zinc in concentrate and 295 kt of refined zinc.2. Based on budgeted commodity prices and a 1.40 CAD/USD exchange rate. The effect on our profit and EBITDA will vary with
commodity price and exchange rate movements, and sales volumes.
Coal~30%
Copper 35%
Zinc35%
Base Metals~70%
7
Finance
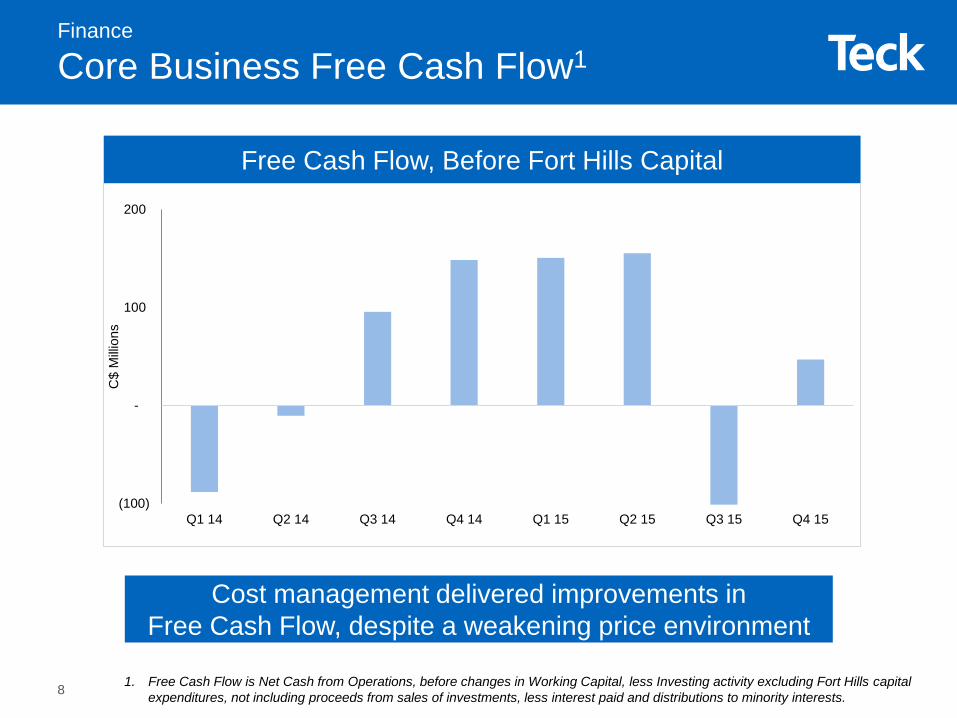
Core Business Free Cash Flow1
Free Cash Flow, Before Fort Hills Capital
(100)
-
100
200
Q1 14 Q2 14 Q3 14 Q4 14 Q1 15 Q2 15 Q3 15 Q4 15
C$
Milli
ons
Cost management delivered improvements in Free Cash Flow, despite a weakening price environment
1. Free Cash Flow is Net Cash from Operations, before changes in Working Capital, less Investing activity excluding Fort Hills capital expenditures, not including proceeds from sales of investments, less interest paid and distributions to minority interests.8
Finance
Agenda
2015 Overview
Balance Sheet & Liquidity
2016 Guidance & Overview
Summary
9
0
500
1000
1500
2000
2500
Original Guidancefor December
31,2015
Lower Prices &FX vs. Start ofYear Forecast
Repayed DebtFrom Cash
Cost ManagementProgram
Cut Capex Reduced theDividend
Proceeds fromSale of
Investments &Other Assets Incl.
Two PreciousMetal Streaming
Transactions
Cash Balance onDecember 31,
2015
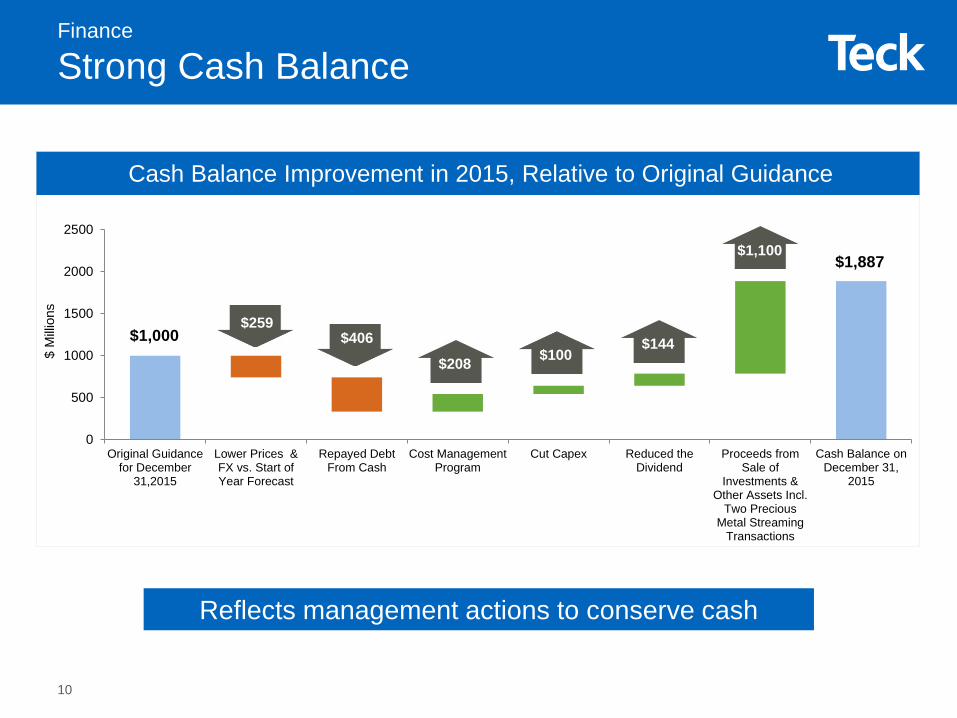
Cash Balance Improvement in 2015, Relative to Original Guidance
Finance
Strong Cash Balance$
Milli
ons
$1,000
$1,887
$208 $100
$1,100
$259$406 $144
Reflects management actions to conserve cash
10

$0
$250
$500
$750
$1,000
$1,250
$1,500
$1,750
$2,000
$2,250
$2,500
$2,750
$3,00020
16
2017
2018
2019
2020
2021
2022
2023
2024
2025
2026
2027
2028
2029
2030
2031
2032
2033
2034
2035
2036
2037
2038
2039
2040
2041
2042
2043
US$
M
11
• No debt due until 2017− Weighted average maturity ~14 years− Weighted average coupon (interest rate) ~4.8%− Average maturity <US$600M
• Debt to debt-plus-equity ratio 37%1
2017Q1: US$300MQ3: US$300M
Repaid US$300M in notes in Q4 2015
As at December 31, 2015.
Finance
Long-Dated Debt Maturity Profile

Amount (M) Commitment Maturity
Letters of Credit Limit
($M)
Letters of Credit Drawn
($M)
Total Available
($M)
US$3,000 Committed July 2020 US$1,000 Undrawn US$3,000
US$1,200 Committed June 2017 None US$740 US$460Expect to keep available for letter of credit requirements
~C$1,700 Uncommitted n/a n/a ~C$1,500 ~C$200
• Unsecured; any borrowings rank pari passu with outstanding public notes• Only financial covenant is debt to debt-plus-equity of <50%; excludes issued letters of credit• Availability not affected by commodity price changes or credit rating actions• Available for general corporate purposes
Ample liquidity for remaining Fort Hills capital expenditure of ~C$1.2B
Current cash balance of C$1.5B (3/4/16) and substantial credit facilities1:
1. As of December 31, 2015. Assumes a 1.38 CAD/USD exchange rate.
Finance
Strong Liquidity
12

Finance
US$1.2B Committed Credit Facility
US$740M drawn for letters of credit at Dec 31st• US$672M for power purchase agreements for QB2
− Requirements decrease: • If/when QB2 is sanctioned and certain project milestones are reached
− Requirements go away: • If/when QB2 reaches commercial production, regardless of credit rating; or• When Teck regains an investment grade credit rating
− Actively reviewing options to onsell power
• C$93M for transport service agreements related to Fort Hills− If all counterparties request financial assurances, aggregate requirement could
increase up to C$550M by year end 2016 and C$650M by year end 2017− Aggregate maximum requirement decreases to C$450M post the relevant
in-service date (late 2017 and beyond)− Requirements go away when Teck regains an investment grade credit rating
13

Finance
C$1.7B Uncommitted Credit Facilities
• C$1.5B drawn for letters of credit, mostly for reclamation obligations− Export Development Canada
facility renewed annually− Other facilities are uncommitted
• Assessing surety bonds to reduce bank exposure
Canadian Banks
EDC
Others
Uncommitted credit facilities are with relationship banks that have been supportive of Teck through the industry cycles
14
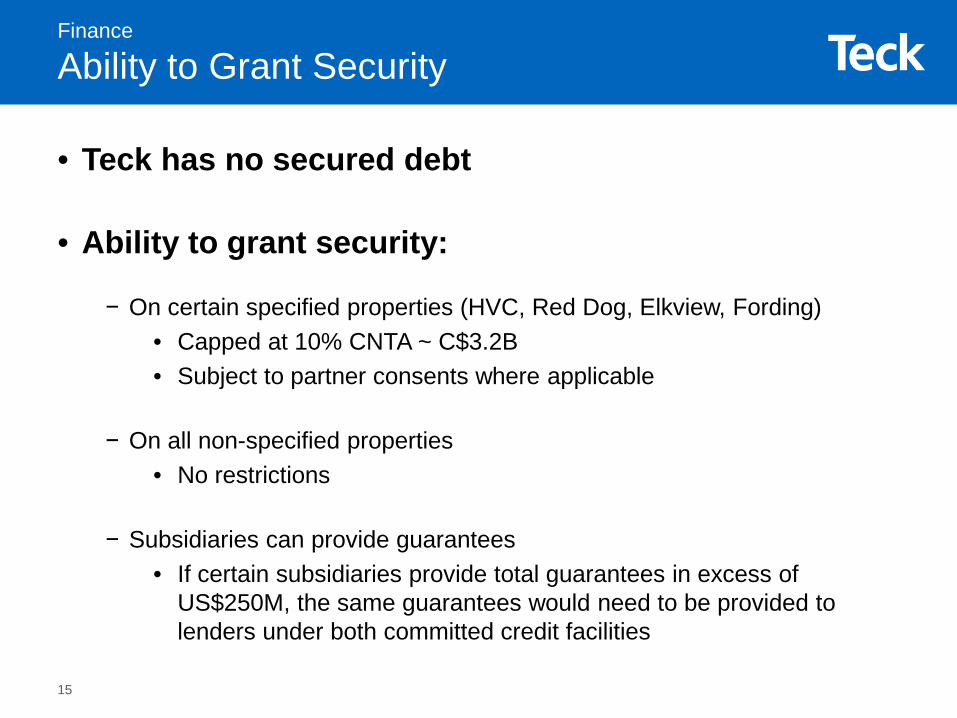
• Teck has no secured debt
• Ability to grant security:
− On certain specified properties (HVC, Red Dog, Elkview, Fording) • Capped at 10% CNTA ~ C$3.2B• Subject to partner consents where applicable
− On all non-specified properties• No restrictions
− Subsidiaries can provide guarantees• If certain subsidiaries provide total guarantees in excess of
US$250M, the same guarantees would need to be provided to lenders under both committed credit facilities
Finance
Ability to Grant Security
15

0
500
1,000
1,500
2,000
2,500
3,000
3,500
4,000
4,500
5,000Ja
n-05
Jan-
06
Jan-
07
Jan-
08
Jan-
09
Jan-
10
Jan-
11
Jan-
12
Jan-
13
Jan-
14
Jan-
15
Jan-
16
Moody's S&P Fitch DBRS London Metal Exchange Index (Right Axis)
BBB/Baa2
BBB-/Baa3
BB+/Ba1
BB/Ba2
BB-/Ba3
BBB+/Baa1
B+/B1
B/B2
B-/B3
A+/A1
A/A2
A-/A3
Inve
stm
ent G
rade
Non
-Inve
stm
ent G
rade
Teck Credit Ratings vs. London Metal Exchange Index
Finance
Credit Ratings Reflect Commodity Prices
16

Finance
Agenda
2015 Overview
Balance Sheet & Liquidity
2016 Guidance
Summary
17

2015 Results 2016 GuidanceSteelmaking Coal
Production 25.3 Mt 25-26 MtSite costs $45/t $45-49/tCapitalized stripping $16/t $11/t1
Transportation costs $36/t $35-37/tTotal cash costs2 $99/t
(US$76/t)$91-97/t
(US$65-69/t)Copper
Production 358 kt 305-320 ktC1 unit costs3 US$1.45/lb US$1.50-1.60/lbCapitalized stripping US$0.21/lb US$0.21/lb1
Total cash costs4 US$1.66/lb US$1.71-1.81/lbZinc
Metal in concentrate production5 658 kt 630-665 ktRefined production 307 kt 290-300 kt
Finance
2016 Production & Site Cost Guidance
1. Approximate, based on capitalized stripping guidance and mid-point of production guidance range.2. Steelmaking coal unit cost of sales include site costs, inventory adjustments and transport costs. Total cash costs
are unit cost of sales plus capitalized stripping. 3. Net of by-product credits.4. Copper total cash costs include cash C1 unit costs (after by-product margins) and capitalized stripping. 5. Including co-product zinc production from our copper business unit.
18

$0
$500
$1,000
$1,500
$2,000
$2,500
$3,000
2012 2013 2014 2015 2016Guidance
New MineDevelopment
MajorEnhancements
Sustaining Capital
CapitalizedStripping
$M
Finance
Achieved Capital Spending Reductions
Total Capital Expenditures 2012-2016F
19

Finance
Agenda
2015 Overview
Balance Sheet & Liquidity
2016 Guidance & Overview
Summary
20

• Core business to remain cash flow positive1
• All operations to generate positive cash flow2
• Achieve sustainable cost savings and capital reductions / deferrals
• C$500M minimum cash balance at year end, with no new debt
• Maintain sufficient liquidity
Finance
2016 Financial Objectives
1. Core business excludes the Fort Hills development project.2. After sustaining capital and capitalized stripping.21

OperationsMarch 30, 2016Ian Kilgour, Executive Vice President & Chief Operating OfficerRobin Sheremeta, Vice President, Coal OperationsDale Andres, Senior Vice President, CopperRob Scott, Senior Vice President, Zinc

Operations
Agenda
Overview
Steelmaking Coal
Copper
Zinc
Summary
3
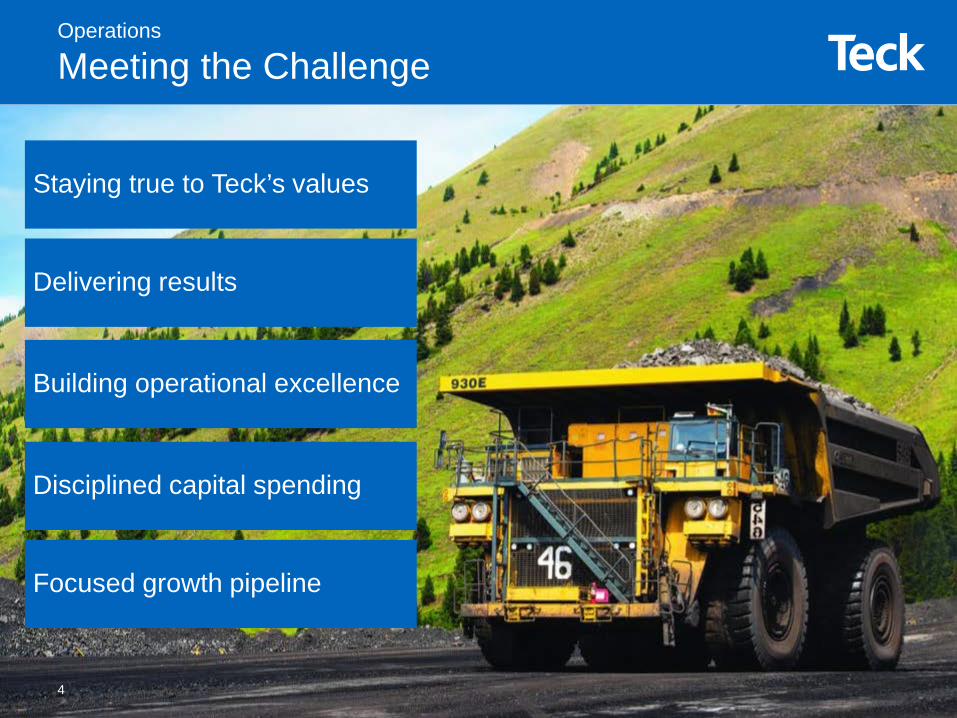
Staying true to Teck’s values
Delivering results
Building operational excellence
Disciplined capital spending
Focused growth pipeline
4
Operations
Meeting the Challenge

Operations
Staying True to Teck’s Values
Safety
Sustainability
Integrity
Respect
Excellence
Courage
5

Operations
Safety is a Core Value
Courageous Safety LeadershipVisible Felt Leadership
Frontline Leadership Development
Incident InvestigationHealth & Safety BenchmarkingControl Effectiveness Reviews
Risk ManagementStandards & Best Practices
Technology Enablers
6
Operations
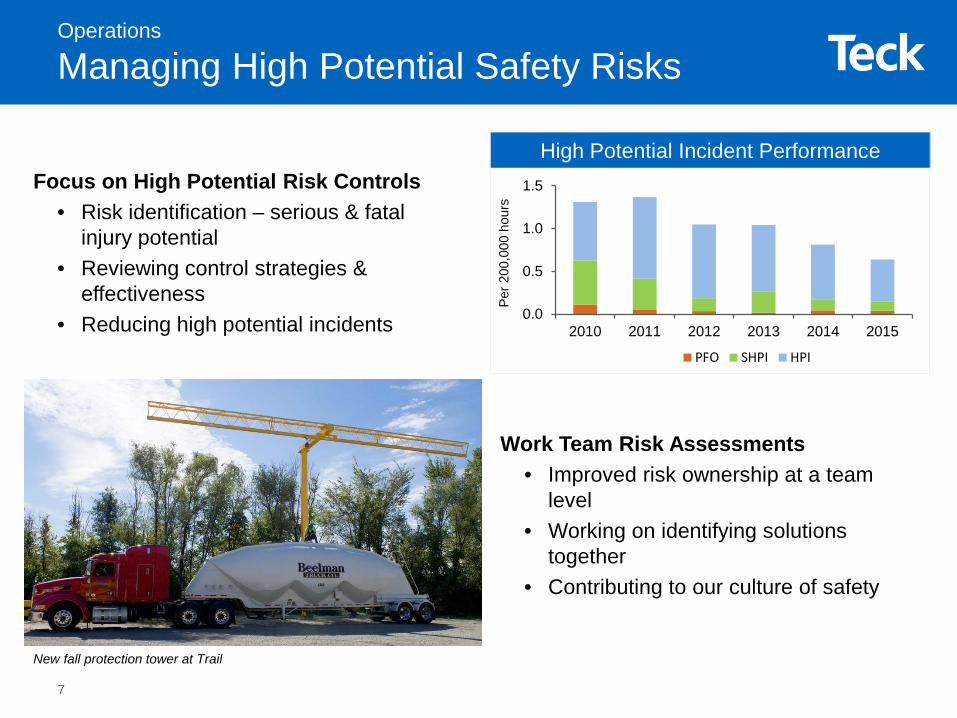
Managing High Potential Safety Risks
Focus on High Potential Risk Controls• Risk identification – serious & fatal
injury potential• Reviewing control strategies &
effectiveness• Reducing high potential incidents
High Potential Incident Performance
0.0
0.5
1.0
1.5
2010 2011 2012 2013 2014 2015
PFO SHPI HPI
Per 2
00,0
00 h
ours
Work Team Risk Assessments• Improved risk ownership at a team
level• Working on identifying solutions
together• Contributing to our culture of safety
New fall protection tower at Trail
7

Operations
Sustainability Incorporated in Operations
Sustainable practices are the “right thing to do” and have a solid business case
Formalizing our commitment to working with Indigenous Peoples
Enhancing air quality in areas near our operations
Reducing GHG remissions and energy costs through haul truck efficiency
Strengthening diversity at operations
8

Operations
LNG Haul Trucks – Status Update
9
• Six pilot trucks have been converted to “dual-fuel” - LNG and diesel (four 830E’s, two 930E’s); first in Canada
• Current substitution rates achieved: 25 – 40% (target >35%)• Pilot objective is to confirm the business case (cost and sustainability) for a Teck
wide application; focus is on safety, sustainability and operability• Establishing reliability of the LNG systems • Optimizing LNG substitution rates and monitoring GHG emissions
9

0.00
0.50
1.00
1.50
2.00
2.50
2012 2013 2014 2015 2016F*
Before by-product credits
After by-product credits
US$
/lb
0
50
100
150
200
250
300
350
400
2012 2013 2014 2015
US$
per t
onne
of p
rodu
ctio
n
0
10
20
30
40
50
60
70
80
90
2012 2013 2014 2015 2016F*
OperatingCapitalized Stripping
C$/
tOperations
Delivering Results in Unit Cost Management
Copper Cash Costs3
Achieved significant unit cost reductions, and expect further reductions in 2016
Steelmaking Coal Total Site Costs1
2
1. Total site costs are site costs, inventory write-downs and capitalized stripping, excluding depreciation. 2. Operating costs include site costs and inventory write-downs.3. By-product credits reduced cash costs by US$0.19/lb in 2015. Assumes US$0.19/lb in 2016.4. Zinc cash costs are Red Dog site costs per tonne of combined zinc and lead production.* 2016F based on mid-point of guidance range.
Zinc Cash Costs4
10

- $50 $100 $150 $200 $250 $300
Other ($1M)Productivity - Utilization (e.g Op Delays) ($5M)
Components (life/cost) ($7M)Freight savings ($7M)
Over time reduction ($12M)Productivity - Enablers, multiple levers ($16M)
Plan optimization ($21M)Pricing Improvements ($20M)
Equipment Rental Savings ($20M)Mining Productivity - Availability ($23M)
Admin savings ($55M)Idling & Energy Savings ($64M)
Consumables ($64M)Employee Cost Reduction ($134M)
Contractors/Consultants Reduction ($160M)Mining Productivity - Throughput ($215M)
2013 Initiatives 2014 Initiatives 2015 Initiatives
CAD$ millions(all USD savings translated using CAD/USD rate of 1.384)
~$820M of Annualized Savings in 2015, from Major Cost Reduction Initiatives in 2013-2015
Annualized 2015 Savings from Major Cost Reduction Program Initiatives
Targeting an additional $300M in operating cost reductions in 2016; A total of >$1B of annualized savings identified and included in 2016 plan
Operations
Embedding Sustainable, Ongoing Operating Cost Reductions in the Organization
11

Planning
Blasting
Loading and Hauling
CrushingStockpiling
Geology and Metallurgy
Grinding
Optimizing value across the production process to breakdown silos and drive continuous improvement
Operations
One Teck: Mine to Mill Optimization
Increased Margin
Lower Unit Costs
More Product
Sharing Best Practices
12

Operations
Disciplined Project Execution
Our project delivery framework strengthens our ability to deliver projects on time and on budget
Highland Valley Crusher Relocation Project
Teck Project Delivery Framework • Significant progress in
permitting practices
• Tight alignment between permitting and engineering
• Integrating sustainability into project framework
Pend Oreille Restart
West Line Creek Water Treatment Plant
13

Robust People Development Systems are Key• Performance management systems that
align organizational goals and objectives with personal goals
• Company-wide development programs for all levels of supervision and management, including operational based leadership development - To address the demand on increasing leadership
competence to drive business results
• Internal career opportunities- Ensuring ‘the best people in the right jobs’ at the
right time
14
Operations
People Achieve Excellence
We attract, engage and develop people whose passion, skills and motivation lead our journey in safety, sustainability and productivity
ProgramBegan
# of Cohorts
# of Participants
Leading for the Future (LFF) 2011 40 844
~70% of eligible population
Leading for Excellence (LFX) 2011 33
462~70% of eligible population;Includes 30 senior leaders
The LeadershipChallenge (LC) 2014 16 271
~15% of eligible population
0
200
400
600
800
1000
1200
1400
2010 2011 2012 2013 2014 2015 2016F
$M
Steelmaking Coal Copper Zinc Corporate
15
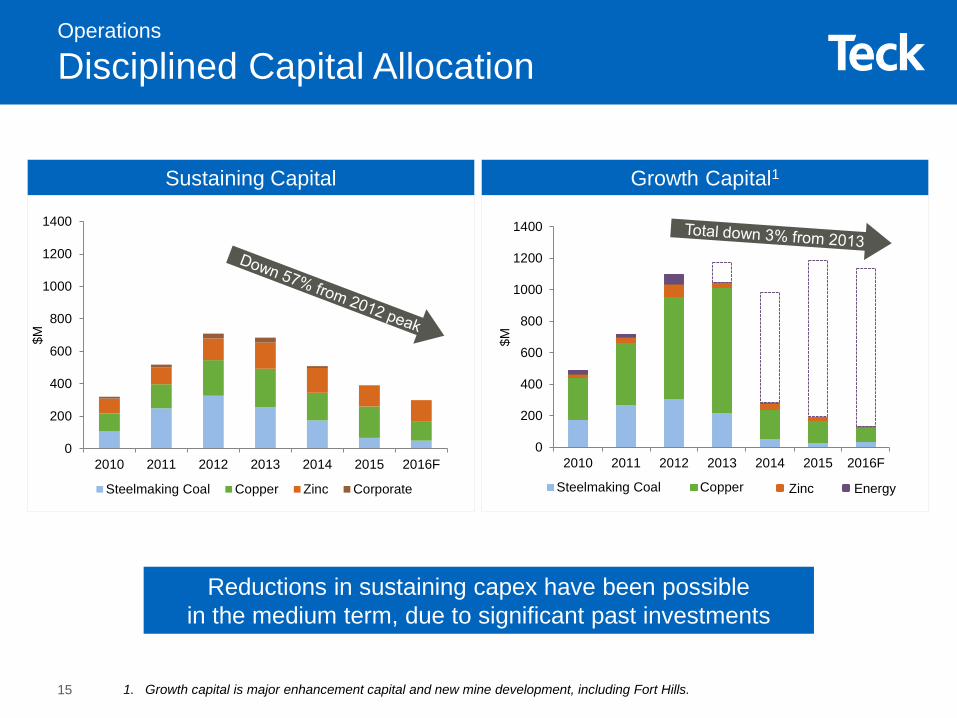
Operations
Disciplined Capital Allocation
Reductions in sustaining capex have been possible in the medium term, due to significant past investments
Growth Capital1Sustaining Capital
1. Growth capital is major enhancement capital and new mine development, including Fort Hills.
0
200
400
600
800
1000
1200
1400
2010 2011 2012 2013 2014 2015 2016F
$MSteelmaking Coal Copper Zinc Energy

CoalWell established with capital efficient growth options
Strong platform combined with diverse portfolio of options allows us to be selective in terms of commodity and timing
Completed In Construction Pre-Sanction
CopperStrong platform with substantial growth options
ZincWorld-class resource combined with integrated assets
EnergyBuilding a new business through partnership
Trail #1 Acid Plant
HVC Mill Optimization
Pend Oreille Restart
Fort Hills
Elk Valley Brownfield (4 Mpta)
Operations
Staged Growth/Value Pipeline
Red Dog Satellite Deposit – Anarraaq
San Nicolas (Cu-Zn)
Elk Valley Brownfield (Replacement 4Mpta) Quintette/Mt. Duke
Frontier
Lease 421
QB Phase 2
Corridor
Mesaba
ZafranalHVC Brownfield
Galore/Schaft Creek
Cirque
Future Options
Trail #2 Acid Plant
Medium-term Growth Options
Elk Valley Brownfield
Antamina Brownfield
Red Dog Satellite Deposits
Neptune Terminals to 18Mtpa
16

Staying true to Teck’s values
Delivering results
Building operational excellence
Disciplined capital spending
Focused growth pipeline
17
Operations
Meeting the Challenge

Operations
Agenda
Overview
Steelmaking Coal
Copper
Zinc
Summary
18

Steelmaking Coal
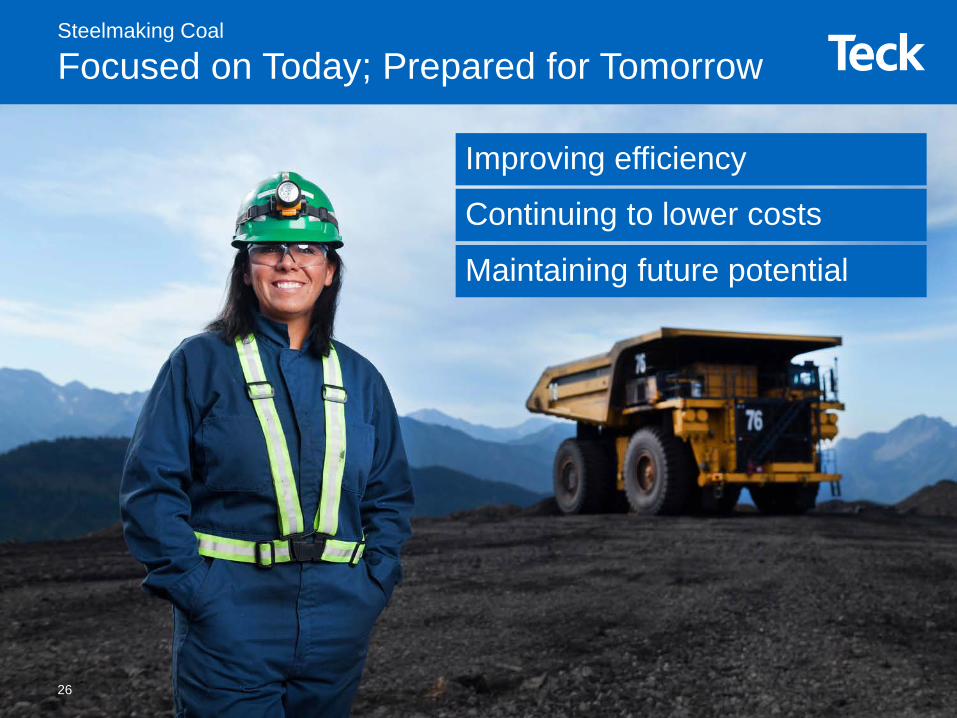
Focused on Today; Prepared for Tomorrow
19
Improving efficiency
Continuing to lower costs
Maintaining future potential

Steelmaking Coal
An Integrated Long Life Coal Business
20
Prince Rupert
Ridley Terminal
Vancouver
Prince George Edmonton
Calgary
Westshore Terminal
Quintette
Cardinal River
Elk Valley
Kamloops
British Columbia
Alberta
Seattle
Elkford
Sparwood
Hosmer
Fernie
Fording River
Greenhills
Line Creek
Elkview
Coal Mountain
ElcoElk Valley
1,150 km
• >1 billion tonnes of reserves support 26 Mt of production for many years• Geographically concentrated in the Elk Valley• Established infrastructure and capacity with mines, railways and terminals• Only steelmaking coal mines still operating in Canada; competitive globally
Neptune Terminal
20
Coal MountainPhase 2
20
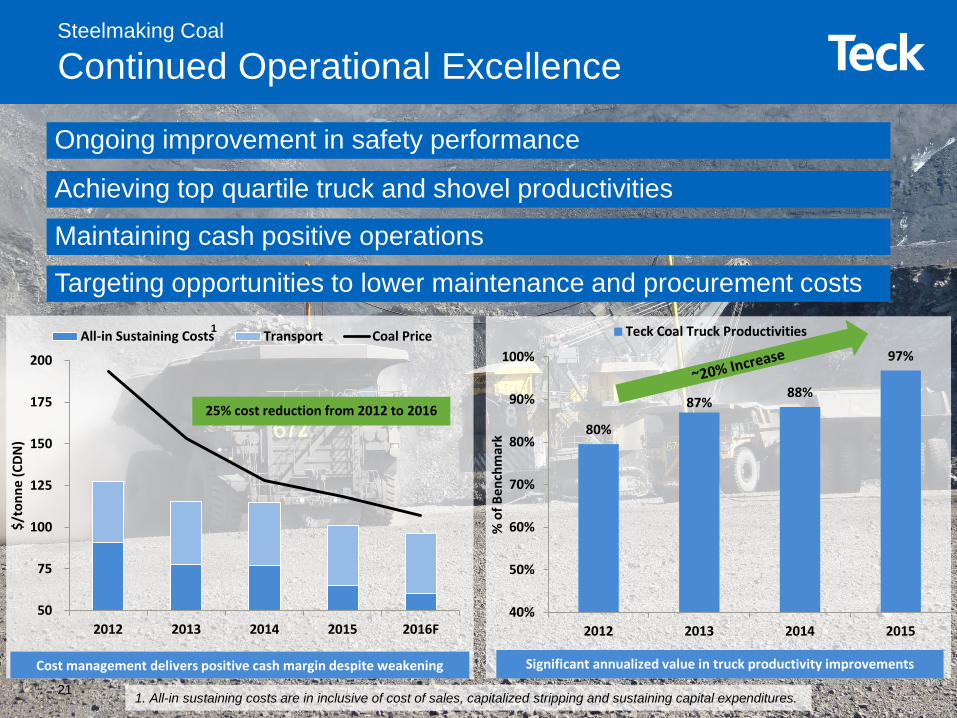
Ongoing improvement in safety performance
Achieving top quartile truck and shovel productivities
Maintaining cash positive operations
Targeting opportunities to lower maintenance and procurement costs
21
Steelmaking Coal
Continued Operational Excellence
80%
87%88%
97%
40%
50%
60%
70%
80%
90%
100%
2012 2013 2014 2015
% o
f Ben
chm
ark
Teck Coal Truck Productivities
Significant annualized value in truck productivity improvements
1. All-in sustaining costs are in inclusive of cost of sales, capitalized stripping and sustaining capital expenditures.
50
75
100
125
150
175
200
2012 2013 2014 2015 2016F
$/to
nne
(CDN
)
All-in Sustaining Costs Transport Coal Price
25% cost reduction from 2012 to 2016
Cost management delivers positive cash margin despite weakening i
1

197
125
76
81
0
50
100
150
200
250
300
350
400
450
500
2013 2014 2015 2016
$ (m
illion
s)
2013 Savings 2014 Savings 2015 Savings 2016 Target
Highlights:• Truck productivity improvements achieved
$145M in sustainable savings • Labour improvements resulted in $90M
savings• $74M savings in contractor management
initiatives
Highlights:• Reduction of 587 employees since
December 2013• Reduction of 360 employees since the May
2015 hiring freeze• Additional planned reduction of 99
employees in 2016
Steelmaking Coal
Cost Reduction & Workforce 2013-2015
~$400M of sustainable annual cost reductions to date; targeting >$81M of additional savings in 2016
Coa
l Hiri
ng F
reez
e
Achieving balanced workforce profile to manage production to market conditions
Total Annualized Savings ~$400M
4,711
4,463
4,124 4,025
5,000
5,400
5,800
6,200
6,600
7,000
3,000
3,400
3,800
4,200
4,600
5,000
Dec-13 Dec-14 Dec-15 2016
Tonn
es/E
mpl
oyee
# Em
ploy
ees
Workforce Productivity
22

5635 34
1
37
28 26
21
128
2012 2015 2016F
Total cash costs down US$46/t from 2012 to 2016F2
Total Cash Costs2
23
US$/t 20123 2015 2016F4 Change
Site $56 $35 $34 -39%
Inventory Adjustments $0 $1 $0 n/a
Transportation $37 $28 $26 -29%
Unit Cost of Sales (IFRS) $93 $64 $60 -35%
Capitalized Stripping $21 $12 $84 -61%
Total Cash Costs2 $114 $76 $68 -40%
Sustaining Capital $14 $2 $15 -90%
All In Sustaining Costs $128 $78 $69 -45%
1. In US dollars per tonne. Assumes a Canadian dollar to US dollar exchange rate of 1.00 in 2012, 1.28 in 2015 and 1.38 in 2016.2. Steelmaking coal unit cost of sales include site costs, inventory adjustments and transport costs. Total cash costs are unit cost
of sales plus capitalized stripping. All in sustaining costs are total cash costs plus sustaining capital.3. Assumes that capitalized stripping was reported from January 1, 2012.4. Based on the mid-point of guidance ranges.5. Approximate, based on capital expenditures guidance and mid-point of production guidance ranges.
IFRS
$114
$76
IFRS IFRS
$68
Site
Inventory
Transport
Capitalized Stripping
Steelmaking Coal
Highly Competitive Costs1

West Line Creek Treatment Plant• First of the water treatment facilities planned for the
Elk Valley; total cost $120M• Operating at design flowrate (7,500 m3 per day) and
achieving design selenium and nitrate reductionsFording River South Treatment Plant• Facility to be operational by 2019, using learnings
from West Line Creek • Project capital estimate of <$150M
Elk Valley Water Quality Plan Costs• Capex as per previous guidance for both plants,
and expectation that this will continue as design and construction improvements are incorporated
• Costs included in sustaining capital• Continuing research and development into
alternative processes which have potential to further reduce costs
24
Steelmaking Coal
Achieving the Elk Valley Water Quality Plan
Overview of FROAWTF-S Location and Streams
Steelmaking Coal
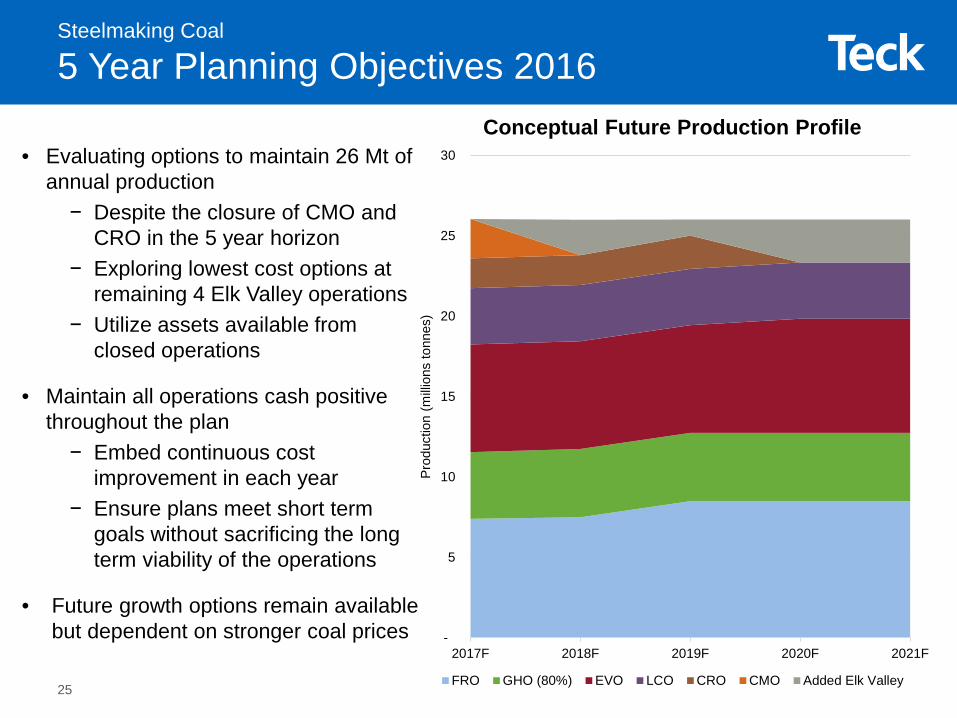
5 Year Planning Objectives 2016
• Evaluating options to maintain 26 Mt of annual production− Despite the closure of CMO and
CRO in the 5 year horizon− Exploring lowest cost options at
remaining 4 Elk Valley operations− Utilize assets available from
closed operations
• Maintain all operations cash positive throughout the plan− Embed continuous cost
improvement in each year− Ensure plans meet short term
goals without sacrificing the long term viability of the operations
• Future growth options remain available but dependent on stronger coal prices -
5
10
15
20
25
30
2017F 2018F 2019F 2020F 2021F
Prod
uctio
n (m
illion
s to
nnes
)
Conceptual Future Production Profile
FRO GHO (80%) EVO LCO CRO CMO Added Elk Valley25
Steelmaking Coal
Focused on Today; Prepared for Tomorrow
26
Improving efficiency
Continuing to lower costs
Maintaining future potential

Operations
Agenda
Overview
Steelmaking Coal
Copper
Zinc
Summary
27
28
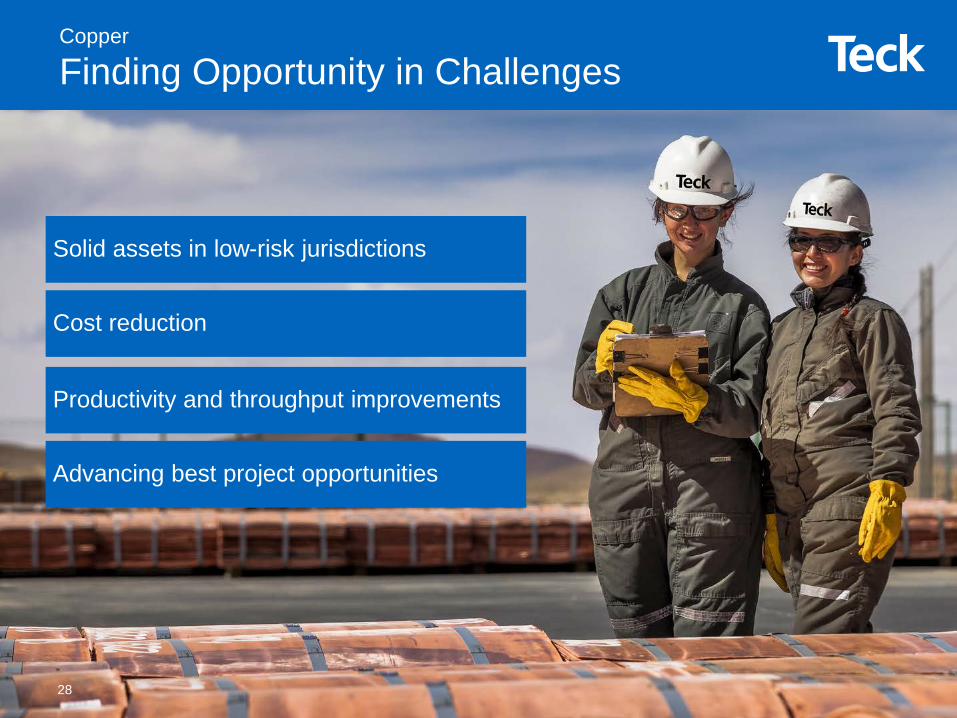
Solid assets in low-risk jurisdictions
Cost reduction
Productivity and throughput improvements
Advancing best project opportunities
Copper
Finding Opportunity in Challenges

• Operating assets with long lives capable of multiple price cycles
• Strong resource base to leverage- Opportunities at existing operations
to extend mine lives significantly- Disciplined approach to greenfield
project portfolio
0
100
200
300
400
500
2012 2013 2014 2015 2016E* 2017-2019E
Tonn
es(0
00’s
)
Cu Cathode Cu in Concentrate
Copper Production
* 2016E represents the mid-point of 2016 guidance.
Copper
Long-Life Assets Focused on the Americas
29

0.2
0.3
0.4
100
125
150
175
200
2012 2013 2014 2015 2016E* 2017-2019E
2020+
Grade (%
)
Tonn
es p
er d
ay (0
00’s
)
Mill Throughput Copper Grade R&R Grade
Lower Near-Term Copper Production
Focusing on sustainable cost reduction strategies to unlock potential expansion and extension options
* 2016E represents the mid-point of 2016 guidance.
• High-grade phase ends late-2016• Aggressive cost reduction plans• Options to expand production & mine life
Copper
Highland Valley Grade Decline in the Short-Term
30

0.60
0.80
1.00
1.20
50
100
150
200
2011 2012 2013 2014 2015 2016E* 2017-2019E
Grade (%
)
Tonn
espe
r day
(000
s)
Mill Throughput Copper Grade
Record Throughput in 2015Strong Cost Position
* 2016E represents the mid-point of 2016 guidance.
Antamina
• New three-year collective agreement signed• Increasing zinc production over the next 5 years• Copper and zinc grades rising• Strong cost position; driving further improvements
Copper
Antamina’s Resources Support a Long Mine Life
31

Copper
Removing Barriers to Unlocking Value at Andacollo
0.2
0.4
0.6
30
45
60
2012 2013 2014 2015 2016E* 2017-2019E
Grade (%
)
Tonn
es p
er d
ay (0
00’s
)
Mill Throughput Copper Grade
Throughput Offsets Grade Decline1
30
60
90
2012 2013 2014 2015 2016E* 2017-2019EC
oppe
r pro
duct
ion,
t (0
00’s
)
Copper in Concentrate Copper Cathode
Extending Cathode Production Creates Value
1. Grade represents total copper grade of ore sent to the mill only, excluding the cathode operation.* 2016E represents the mid-point of 2016 guidance.
• Four-year labour agreements settled• Throughput improvement projects underway• Further cost reductions in progress• Extending cathode production to 2020
32

Copper Cutting Costs & Evaluating Options at Quebrada Blanca
RIPIOS
RIPIOS
DUMP
• Labour agreements settled through 2017• Geotechnical issues mitigated• Implementing aggressive cost reduction initiatives• Evaluating options to supplement production
-
20
40
60
80
2012 2013 2014 2015 2016E*
Unit C
osts ($/lb)Tonn
es (0
00’s
)
Cu Production Unit Costs
2
Cash Costs Maintained Against Declining Production
* 2016E represents the mid-point of 2016 guidance.33
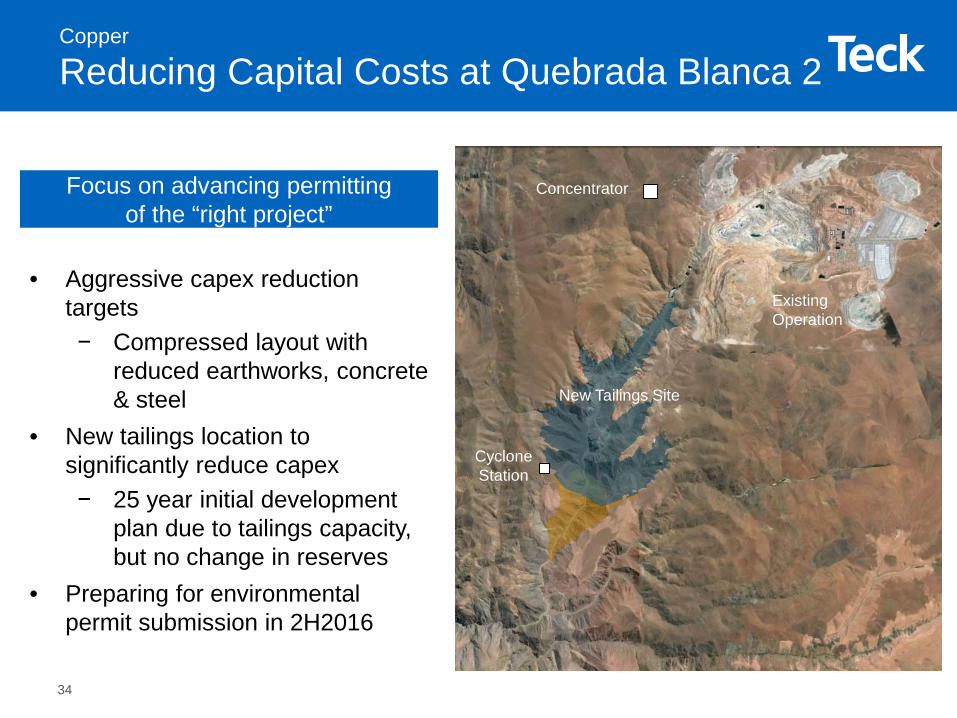
• Aggressive capex reduction targets− Compressed layout with
reduced earthworks, concrete & steel
• New tailings location to significantly reduce capex− 25 year initial development
plan due to tailings capacity, but no change in reserves
• Preparing for environmental permit submission in 2H2016
Copper
Reducing Capital Costs at Quebrada Blanca 2
Concentrator
CycloneStation
New Tailings Site
Existing Operation
Focus on advancing permitting of the “right project”
34

35
• Committed to building strong, mutually beneficial relationships with stakeholders and communities
• Capital smart partnership- Common infrastructure- Longer mine life- Reduced environmental footprint- Enhanced community benefits
• Short term priorities- Community engagement &
participatory planning- Evaluate strategic options &
prefeasibility study
35
Before: Duplicate Infrastructure
After: Common Infrastructure
Copper
Building Partnerships: Project Corridor

• Absolute cost reduction• Productivity improvements• Labour force reduction• Contractor reduction• Managing supply contracts and usage
Copper
Intense Focus on Costs & Productivity
36

37
Solid assets in low-risk jurisdictions
Cost reduction
Productivity and throughput improvements
Advancing best project opportunities
Copper
Finding Opportunity in Challenges

Operations
Agenda
Overview
Steelmaking Coal
Copper
Zinc
Summary
38

• Red Dog has stable zinc production despite declining grade• Pend Oreille moving to a higher proportion of secondary mining,
which improves selectivity and ore availability• Increased refined zinc production at Trail with enhanced process
stability of a new acid plant • Value creating roadmaps for Red Dog and Pend Oreille
39
ZincPoised to Capitalize on Improving Fundamentals

Mill Throughput vs. Grade
40
Stable zinc metal production despite declining grade
• Declining zinc grade offset by increasing mill throughput
• Increasing mill throughput has resulted in reduced unit cost
• Exploring opportunities to further increase mill throughput
ZincRed Dog: Maintaining Zinc Metal Production
Expected Production 2017-2019
• 500,000-550,000 tonnes of zinc
• 100,000-110,000 tonnes of lead10
15
20
25
2,000
2,500
3,000
3,500
4,000
4,500
5,000
Gra
de %
Mill
Thro
ughp
ut (k
t)
Grade
Throughput

41
Su-LikAktigirukAnarraaq
Red Dog Mine
NANA Lease100% Teck
Red Dog District Drilling 2004-2015
Significant regional land position
• 350 km2 of highly prospective NANA and State lands with identified exploration targets
• Ongoing drilling programs to enhance resource certainty and define future developments
ZincRed Dog: Significant Exploration Potential
0
5,000
10,000
15,000
20,000
25,000
30,000
35,000
2004 2005 2006 2007 2008 2009 2010 2011 2012 2013 2014 2015
Mine Regional Exploration
41

1980 – Red Dog Main and Qanaiyaq drilled
1989 – First ore from Main
1995 – Aqqaluk and Paalaaqdiscovered
2012 - First ore from Aqqaluk
2016 – First ore from Qanaiyaq
35 years of discovery and development42
ZincRed Dog: Mine Area Deposits

1999 Discovery: Anarraaq
2001 Discovery: Aktigiruk
Underground targets
Plan & section at same scale as previous slide
43
Anarraaq–Aktigiruk corridor
ZincRed Dog: Regional Exploration Discoveries

2cm
1.1 m @ 42.2% Zn, 14.7 % Pb, 558g/t Ag
2cm
1.9 m @ 24.6% Zn, 6.3 % Pb, 53g/t Ag
Zinc
Red Dog: Anarraaq High Grade Intercepts Demonstrate Significant Resource Potential1
DDH171854.7m @ 15.7%Zn, 4.0% Pb, 106g/t AgIncl. 11.2m @ 34.2% Zn, 11.5% Pb, 382g/t Ag
DDH1714 42m @ 18.3% Zn, 4.5% Pb, 82g/t AgIncl. 23.4m @ 23.2% Zn, 5.2% Pb, 74g/t Ag44
Industry Average Zinc Grades Falling
High Grade Anarraaq Intercepts
Red Dog zinc grades are much higher than industry average
0
5
10
15
20
25
2009 2010 2011 2012 2013 2014 2015
Gra
de %
Weighted Average Industry Grade
Red Dog
1. The scientific and technical information disclosed has been reviewed and approved by Rodrigo Marinho, P.Geo., Technical Director, Reserve Evaluation, Teck who is a Qualified Person under NI 43-101. For further information, please see Teck’s most recent Annual Information Form.

• Underground mine• Road access• Power generation
• Access to Aktigurik• Resource upside
• Resource drilling• Development schedule
and capital
• SAG motor upgrades• Fine grinding• Additional flotation
• Lower ore cut-off• Further throughput
increase
• Mill space• Generator capacity
Components
Opportunities
Challenges
• Crushing & sorting equipment
• Reactive ore
• Higher metal recovery• Lower cut-off• Increase throughput
• Screening technology
• Underground mine• Access from Anarraaq
• Resource upside
• Resource drilling• Development schedule
and capital
Creating value through long-term planning45
Mill Throughput Increase
AnarraaqUnderground
Ore Sorting
AktigirukUnderground
Current Life of Mine Plan
Legend
Zinc
Red Dog: Value Creating Road Map

Ore Production from Secondary Mining
46
Stabilizes ore production, which will result in reduced unit costs
• Room and pillar stopes developed by drift mining
• Initial ore supply entirely from primary mining of stopes – limited broken ore inventory
• Secondary mining increases as stopes established and pillars can be removed as the mining front retreats – larger broken inventory
0
100
200
300
400
500
600
700
800
900
2004 2005 2006 2007 2008 2015 2016F
Ore
Min
ed (
ooo’
ston
nes)
Primary Mining (Drift)
Secondary Mining (Pillar)
Zinc
Pend Oreille: Increasing Secondary Mining

• Tailings back fill• Resource in adjacent
to existing workings
• Higher grades• Additional life
• Resource drilling• Development schedule
and capital
• Dry stack tailings• Resources in YH1
• Higher grades and recovery
• Additional mine life
• Drilling required• Permitting of tailings
Components
Opportunities
Challenges
Creating value through long-term planning47
Possible Life Extension
to 2028
Ongoing Exploration to Define Future
ResourcesOre Sorting
Current Life of Mine Plan
Legend
Zinc
Pend Oreille: Value Creating Road Map

Acid Plant Reliability –Unplanned Downtime and Refined Zinc Production
260
265
270
275
280
285
290
295
300
305
310
0%
1%
2%
3%
4%
5%
6%
7%
8%
2010 2011 2012 2013 2014 2015
Ref
ined
Zin
c Pr
oduc
tion
(000
's t)
Unp
lann
ed D
ownt
ime
(%)
48
Increased refined zinc production with enhanced process stability of a new acid plant
New Acid Plant
• Commissioned May 2014; first full year 2015
• Removes SO2 gas created from roasting sulphideconcentrates.
• Replaced unreliable 40-year old acid plants
Focus on Cost Reduction
• Personnel utilization
• Zinc production
Zinc
Trail: More Reliable Acid Plant
Unplanned Downtime

• Red Dog has stable zinc production despite declining grade• Pend Oreille moving to a higher proportion of secondary mining,
which improves selectivity and ore availability• Increased refined zinc production at Trail with enhanced process
stability of a new acid plant • Value creating roadmaps for Red Dog and Pend Oreille
49
ZincPoised to Capitalize on Improving Fundamentals

Operations
Agenda
Overview
Steelmaking Coal
Copper
Zinc
Summary
50

Staying true to Teck’s values
Delivering results
Building operational excellence
Disciplined capital spending
Focused growth pipeline
51
Operations
Meeting the Challenge

MarketingMarch 30, 2016Andrew Stonkus, Senior Vice President, Marketing & SalesRéal Foley, Vice President, Coal MarketingMike Doma, Managing Director, Lee & Doma Energy Group

Marketing
Agenda
Overview
Steelmaking Coal
Base Metals
Energy
Summary
3
Marketing
World Economy in 2016
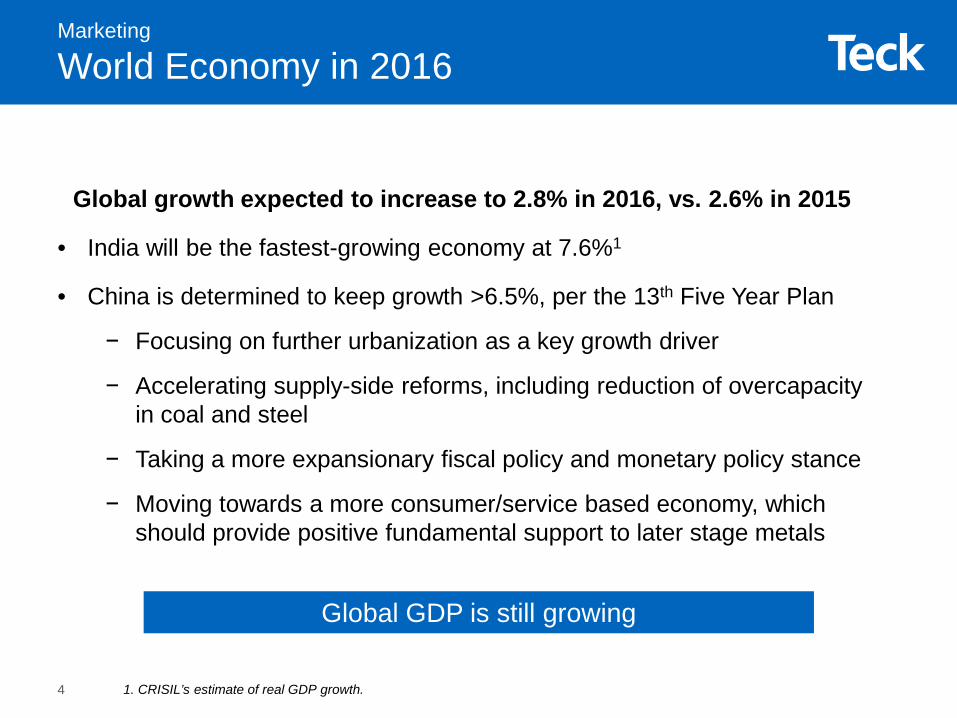
Global growth expected to increase to 2.8% in 2016, vs. 2.6% in 2015
• India will be the fastest-growing economy at 7.6%1
• China is determined to keep growth >6.5%, per the 13th Five Year Plan
− Focusing on further urbanization as a key growth driver
− Accelerating supply-side reforms, including reduction of overcapacity in coal and steel
− Taking a more expansionary fiscal policy and monetary policy stance
− Moving towards a more consumer/service based economy, whichshould provide positive fundamental support to later stage metals
Global GDP is still growing
1. CRISIL’s estimate of real GDP growth.4

Marketing
Prolonged Deep Cycle
Prices starting to improveSource: LME, BEA, LBMA, Teck
Relative Price Changes
0.0
0.2
0.4
0.6
0.8
1.0
1.2
ZN CU Au WTI HC Coal
plotted to March 15, 2016
Peak2014-2016
ChangeFrom Peak
Change FromDecember 2015
Oil $108/bbl -66% -3%
Zinc $1.10/lb -28% +10%
Copper $3.37/lb -34% +5%
Gold $1,385/oz -8% +16%
HC Coal $135/Mt -39% +8%
5

• Up cycles in green and down cycles in orange; plotted against duration in years on the right scale• Peak-to-trough price moves during the cycle in blue; plotted against the left axis• Up cycles tend to be longer, with higher percentage gains
Marketing
Price Cycles Deepest since 1920’sYears
Pea
k to
Tro
ugh
Cyc
le %
Cha
nge
Source: Wood Mackenzie, USGS, WBMS, Teck* Copper prices were fixed in the 1932-1937 period.
72%
-37%
132%
-57%
3%41%
-68%
130%
-10%
86%
-13%
115%
-37%
23%
-6%
92%
-12%
50%
-15%
54%
-28%
5%
-13%
97%
-30%
51%
-45%
16%
-14%
333%
-26%
68%
-49%
54
6
4
6
23
5
8*
3
1
7
2 21
9
2 2
4
2 21 1
54
2
4
12
5
2 2
5
0
2
4
6
8
10
12
14
16
18
20
-600%
-500%
-400%
-300%
-200%
-100%
0%
100%
200%
300%
400% Example: Copper Cycle
6

Current cycle is extreme from a historical perspective
Coal market slowly rebalancing
Minor copper surplus at risk
Structural deficits developing in zinc
Oil market rebalance and WTI >US$50/bbl expected by end 2017
Good long-term fundamentals
Marketing
Improving Commodity Markets
7

Marketing
Agenda
Overview
Steelmaking Coal
Base Metals
Energy
Summary
8

9
Steelmaking Coal Marketing
Market Slowly Rebalancing
• Steelmaking coal in longest and deepest cycle
• Pricing at unsustainably low levels
• USA supply reduced and remains under most pressure
• Good demand outside China
• Higher pricing required to incent future production

Our Market - Seaborne Hard Coking Coal2: ~200 million tonnes
1. Source: International Energy Agency 2014 data2. Source: CRU
Global Coal Production1: 7.9 billion tonnesSteelmaking Coal Production2: ~1,185 million tonnes
Export Steelmaking Coal2: ~325 million tonnesSeaborne Steelmaking Coal2: ~290 million tonnes
Steelmaking Coal Marketing
High Grade Hard Coking Coal Is A Niche Market
10

60
80
100
120
140
160
$ / to
nne
Quarterly Contract Settlement Argus FOB Australia
Steelmaking Coal Marketing
Largest Uptick in Spot Prices Since Q3 2013
Source: Argus
Coal Prices: Quarterly Benchmark Prices and Spot Assessments
Q2 Benchmark Price?11

Steelmaking Coal Marketing
Mixed Views on China Coking Coal Imports
2020
F
China's Coking Coal Imports & Stock Changes
Stocks at ports and end users reaching low levels
China Rolling 12-Month Coking Coal Imports
2020 Forecast: 30~70 Mt
Source: GTIS, Wood Mackenzie, CRU, UBS, Mysteel
0
10
20
30
40
50
60
70
80
2009
2010
2011
2012
2013
2014
2015
Milli
on to
nnes
Seaborne imports rolling 12moMongolia imports rolling 12mo
60.0
15.413.2 13.1
35.3
12.7
3.48.0
0
10
20
30
40
50
60
70
Seaborne Landborne Stock at ports Stock at sampleend users
Milli
on to
nnes
2013 2015
12

0
200
400
600
800
1000
1200
1400
Mt
Estimated Crude Steel Capacity Crude Steel Production
Source: Teck, Fenwei, NBS, CISA, MIIT, State Administration of Work Safety
Steelmaking Coal Marketing
China Reducing Overcapacity
Raw CoalCrude Steel
13th 5-Year Plan: Eliminate 100-150 Mt of capacity
13th 5-Year Plan: Eliminate 500 Mt of capacity
0
1000
2000
3000
4000
5000
Mt
Estimated Raw Coal Capacity Raw Coal Production
13

0
200
400
600
800
1000
2010 2015 2020 2025 2030 2035
Crude Steel and Hot Metal Production
Source: WSA, China Association of Metalscrap Utilization, Wood Mackenzie
Crude Steel
Steelmaking Coal Marketing
China Scrap Use to Increase Slowly
China’s Scrap Ratio Low vs. Other Countries
73%54%
33%
88%
28%
50%
11%
36%
0%
20%
40%
60%
80%
100%
UnitedStates
Europe Japan Turkey Russia Korea China WorldAverage China
Steel Use By Sector(2000-14)
Electric Arc Furnace
Hot Metal
Hot metal / crude steel ratio to remain >90% and EAF share of crude steel production <10% until ~2028
14

Steelmaking Coal Marketing
Growing India Steelmaking Coal Imports
India’s Hot Metal Capacity; Projects and Operations
Seaborne Steelmaking Coal ImportsRequired to Meet India Hot Metal Production
0
10
20
30
40
50
60
70
80
0
10
20
30
40
50
60
70
80
2003
2004
2005
2006
2007
2008
2009
2010
2011
2012
2013
2014
2015
2016
2017
2018
2019
2020
HMP forecast by Wood MackenzieHMP forecast by CRUSeaborne Steelmaking Coal Imports (average Wood Mackenzie and CRU)
Mt
Seaborne steelmaking coal imports forecasted to increase by >20%
Source: WSA, Wood Mackenzie, CRU15

Source: CRU, Wood Mackenzie
Steelmaking Coal Marketing
Stronger Fundamentals in Rest of the World
Seaborne Steelmaking Coal Imports (Average Wood Mackenzie and CRU; Change 2020 vs. 2015)
16

Steelmaking Coal Marketing
Cash Margins Under Pressure
Seaborne HCC Cash Margins US Steelmaking Seaborne Coal Exports
38 Mt
0
10
20
30
40
50
60
70
Mt 2000-2009
average of 23 Mt
2010-2014average of 55 Mt
>90% of US HCC exports are cash negative
Source: GTIS, Wood Mackenzie17

Steelmaking Coal Marketing
Australian Production Peaking
Australian Steelmaking Coal Production
Higher pricing required to incent more production
Source: CRU
100
120
140
160
180
200
220
2016 2018 2020 2022 2024 2025
Existing & Committed Production
Mt
18

Steelmaking Coal Marketing
We Are a Leading Steelmaking Coal Supplier To Steel Producers Worldwide
North America~5%
Europe2015: ~20%2013: ~15%
China 2015: ~20%2013: ~30%
High quality, consistent, reliable, long-term supply
Asia excl. China2015: ~50%2013: ~45% Latin America
~5%
Proactively realigning sales with changing market19

20
Steelmaking Coal Marketing
Market Slowly Rebalancing
• Steelmaking coal in longest and deepest cycle
• Pricing at unsustainably low levels
• USA supply reduced and remains under most pressure
• Good demand outside China
• Higher pricing required to incent future production

Marketing
Agenda
Overview
Steelmaking Coal
Base Metals
Energy
Summary
21
22
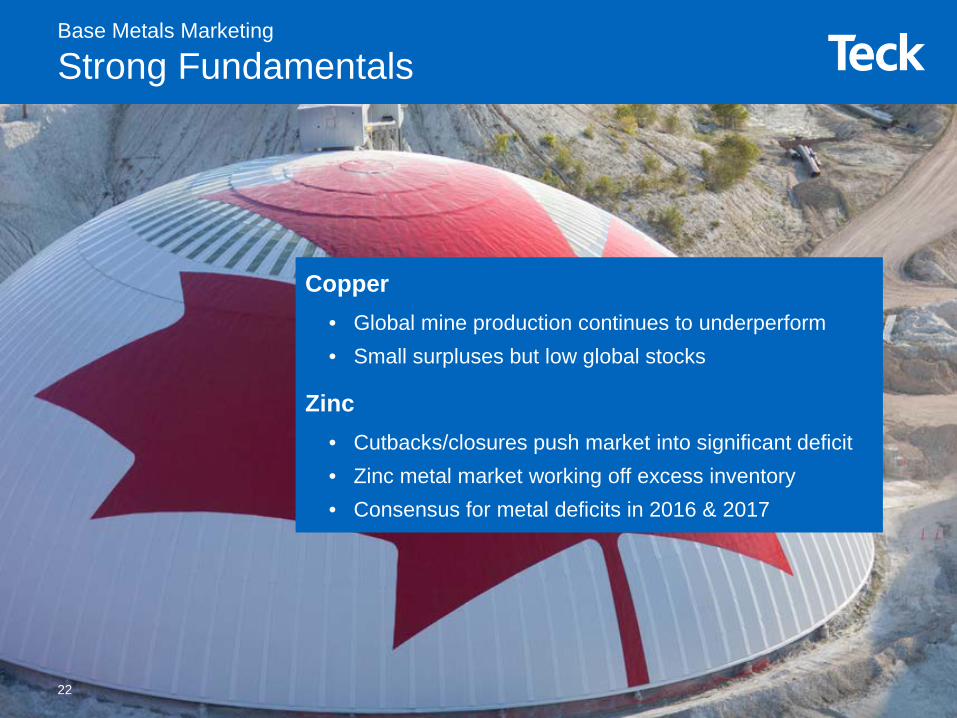
Base Metals Marketing
Strong Fundamentals
Copper• Global mine production continues to underperform• Small surpluses but low global stocks
Zinc• Cutbacks/closures push market into significant deficit• Zinc metal market working off excess inventory • Consensus for metal deficits in 2016 & 2017

Base Metals Marketing
Slowing Copper Mine Production Growth
0
5,000
10,000
15,000
20,000
25,000
30,000
2010 2013 2016 2019 2022 2025
Thou
sand
Ton
nes
Mine Production SXEW Scrap Demand
Copper Mine Production Peaks in 2017 Uncommitted Projects Increasingly Delayed
0
1,000
2,000
3,000
4,000
5,000
6,000
7,000
8,000
9,000
10,000
2016FLast Year
2016FToday
2018FLast Year
2018FToday
2020FLast Year
2020FToday
Thou
sand
Ton
nes
Highly Probable Probable Possible
Existing and Fully Committed Mines
Committed and operating mine production peaking & replacement projects delayed
Source: Wood Mackenzie, CRU, ICSG, Teck23

Base Metals Marketing
Copper Cathode Balances Trending Down
-950-859
-776-851
-945
-584
-839
-973
-831
-968
-1,315
-225
-1,400
-1,200
-1,000
-800
-600
-400
-200
0
Thou
sand
tonn
es
Analysts projecting weak fundamentals still don’t show massive stock builds
Source: Wood Mackenzie, Teck
Historic Disruptions 7-9% / Year
2015 Disruptions: 8.5%2016 YTD: 6.7%
-200
-100
0
100
200
300
400
500
WM
CR
U
JPM MS
Citi CS
UB
S
Mac
q
BNS
TD
Thou
sand
tonn
es
1% of Demand
Analyst 2016 & 2017 Cathode Balances
24

Base Metals Marketing
Significant Chinese Copper Demand Remains
…But Will Add Significantly in Additional Tonnage Terms
Annual Growth Rate of Chinese Copper Consumption to Slow Dramatically…
China expected to add almost as much to global demand in the next 15 years as the past 25 years
Source: Wood Mackenzie, Teck
-
200
400
600
800
1,000
1,200
1,400
1990 1994 1998 2002 2006 2010 2014 2018 2022 2026 2030
0%
5%
10%
15%
20%
25%
30%
1990 1994 1998 2002 2006 2010 2014 2018 2022 2026 2030
Annual Avg. 11.9%
Annual Avg. 2.8%
Annual Avg. Growth 356 kt Annual Avg. Growth
325 kt
Thou
sand
tonn
es
25

0
200
400
600
800
1,000
1,200
2004 2005 2006 2007 2008 2009 2010 2011 2012 2013 2014 2015 2016
Cathode Concs Scrap Blister/Semis
000’
s to
nnes
(con
tent
)
Net Copper Imports up ~5% in 2015
Source: NBS
Updated to January 2016
Total copper unit imports continue to climb
Base Metals Marketing
China Switching to Copper Concentrates
26
(2,000)
(1,500)
(1,000)
(500)
0
500
2012 2014 2016 2018 2020
Thou
sand
tonn
es
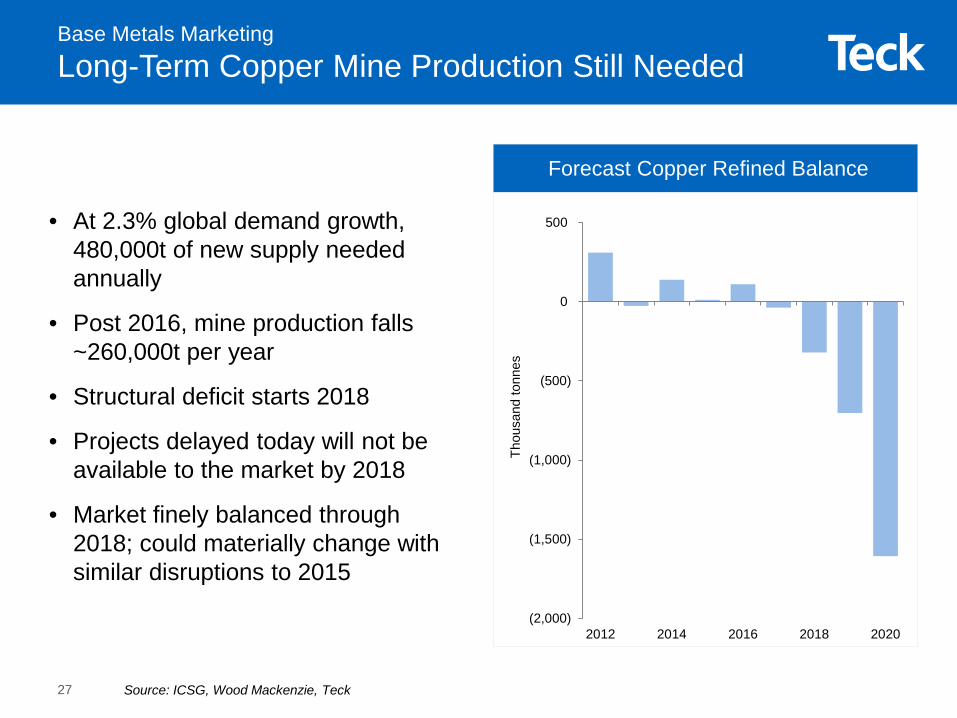
• At 2.3% global demand growth, 480,000t of new supply needed annually
• Post 2016, mine production falls ~260,000t per year
• Structural deficit starts 2018
• Projects delayed today will not be available to the market by 2018
• Market finely balanced through 2018; could materially change with similar disruptions to 2015
Forecast Copper Refined Balance
Base Metals Marketing
Long-Term Copper Mine Production Still Needed
Source: ICSG, Wood Mackenzie, Teck27
Base Metals Marketing
Global Copper Stocks Falling
-
50
100
150
200
250
300
350
400
450
500
0
200
400
600
800
1,000
1,200
1,400
1,600
1,800
2011 2012 2013 2014 2015 2016
US¢/lb
Thou
sand
tonn
es
Chinese Bonded LME COMEX SHFE LME Price
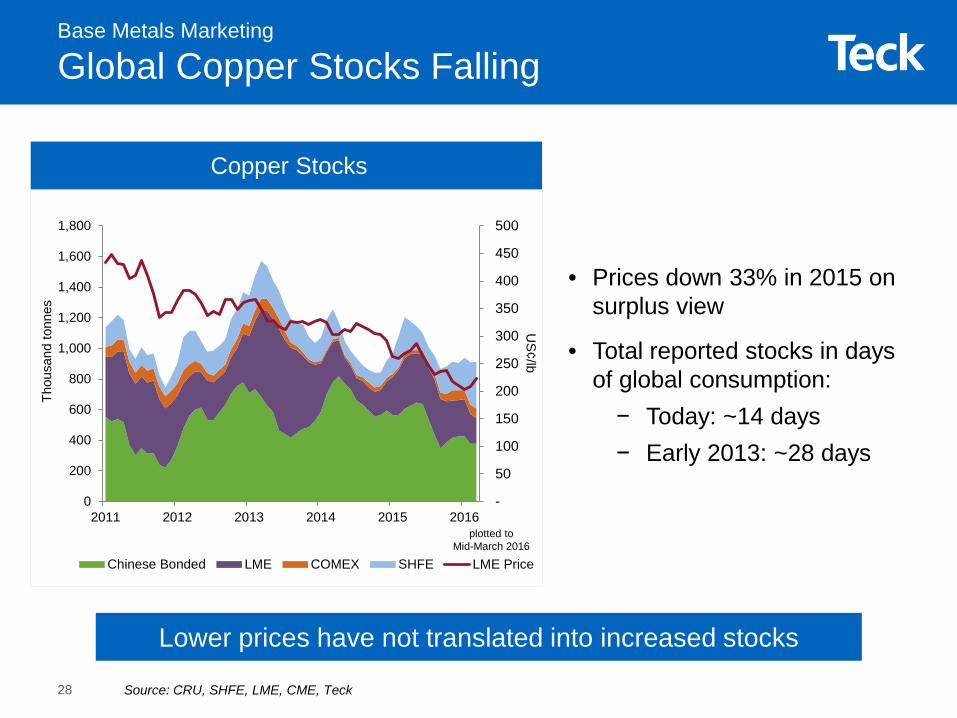
• Prices down 33% in 2015 on surplus view
• Total reported stocks in days of global consumption:− Today: ~14 days − Early 2013: ~28 days
Copper Stocks
Source: CRU, SHFE, LME, CME, Teck
plotted to Mid-March 2016
Lower prices have not translated into increased stocks
28

29
• Mine production continues to underperform• Small forecast surpluses relative to market size• Production curtailments and project delays due low prices• Global stocks are low in days of consumption• Deficit if upside to demand or higher than forecast disruptions
Base Metals Marketing
Minor Copper Surpluses at Risk

0
1,000
2,000
3,000
4,000
5,000
6,000
7,000
8,000
9,000
10,000
2016FLastYear
2016FToday
2018FLastYear
2018FToday
2020FLastYear
2020FToday
Thou
sand
Ton
nes
Highly Probable Probable Possible
Base Metals Marketing
Slowing Zinc Mine Production Growth
Zinc Mine Production Peaks in 2020 Uncommitted Projects Increasingly Delayed
Existing and Fully Committed Mines
Committed and operating mine production peaking & replacement projects delayed
0
2,000
4,000
6,000
8,000
10,000
12,000
14,000
16,000
18,000
20,000
2010 2013 2016 2019 2022 2025
Thou
sand
Ton
nes
Mine Production Secondary Demand
Source: Wood Mackenzie, CRU, ILZSG, Teck30

4,000
4,500
5,000
5,500
6,000
6,500
7,000
2012 2013 2014 2015 2016F
Thou
sand
tonn
es
Mine Supply ROW Conc Imports Australia Conc Imports Metal Imports Demand 3%
Source: NBS, GTIS, Wood Mac, Teck
Chinese Zinc Supply, Including Trade & Demand
Base Metals Marketing
Chinese Zinc Spot Market is Short
• 2016 Australian mine production will fall 43%• Chinese concentrate imports: 40% Australia and 30% Peru in 2015• 2016 shortage of 1.0 Mt at 0% growth, and 1.3 Mt at 3% growth
Con
cent
rate
Sup
ply
Con
cent
rate
Sup
ply
Lower concentrate supply expected in 201631

Spot TCs Tighten
Base Metals Marketing
Market Consensus for Tightening Zinc Market
Source: BGRIMM/Antaike, Wood Mackenzie
-1,000
-800
-600
-400
-200
0
200
400
WM
CR
U
JPM MS
Citi CS
UB
S
Mac
q
BNS
TD
Thou
sand
tonn
es
2016 2017
Analyst Zinc Metal Balance Comparison
$0
$100
$200
$300
$400
$500
$600
Spot Annual
32

Base Metals Marketing
Committed Zinc Supply Insufficient for Demand
Forecast Zinc Refined Balance
Source: Teck
• We expect insufficient mine supply to constrain refined production− From 2014-2020, refined metal supply
increase of only 792 kt− Over the same period, refined demand
increase of 2.8 Mt
• Market was in deficit in 2014• Ongoing, large inventory that has
funded the deficit will continue in 2016• Metal market moving into significant
deficit with further mine closures and depleting inventories
(2,500)
(2,000)
(1,500)
(1,000)
(500)
0
500
2012 2013 2014 2015 2016 2017 2018 2019 2020
Thou
sand
tonn
es
33

-
20
40
60
80
100
120
0
500
1,000
1,500
2,000
2,500
2011 2012 2013 2014 2015 2016
US¢/lb
Thou
sand
tonn
es
Chinese Bonded LME SHFE LME Price
Base Metals Marketing
Global Zinc Stocks Falling
• Prices fell 27% in 2015
• Total reported stocks in days of global consumption:− Today: ~25 days − Early 2013: ~59 days
Zinc Stocks
Source: CRU, SHFE, LME, Teck
plotted to Mid-March 2016
34

35
Base Metals Marketing
Structural Deficits Developing in Zinc
• Mine closures have occurred
• Supply deficit magnified by production cuts
• Spot concentrate treatment charges falling
• Chinese metal imports must increase
• Stocks declining & insufficient to meet demand

36
Base Metals Marketing
Strong Fundamentals
Copper• Global mine production continues to underperform• Small surpluses but low global stocks
Zinc• Cutbacks/closures push market into significant deficit• Zinc metal market working off excess inventory • Consensus for metal deficits in 2016 & 2017
Marketing
Agenda
Overview
Steelmaking Coal
Base Metals
Energy
Summary
37

38
Energy Marketing
Near-Term Market Expectations
• Oil markets currently oversupplied
• Markets expected to rebalance in 2017
• >US$50/bbl WTI expected by end 2017

Energy Marketing
Market Rebalance Expected in 2017
$0
$50
$100
$150
$200
40
50
60
70
80
90
100
Nom
inal
$U
S/b
bl
MM
b/d
Oil Demand (left axis)
Source: IEA and EIA
Source: Wood Mackenzie Macro Oils Short-Term Outlook, February 2016
Long-Term Trend: Prices rose to create supply to meet demand growth• 2000–2015 demand up 16 MM b/d
− Growth from 74 to 90 MM b/d or 1.3%/yr
• 2000–2015 supply − Higher prices required to bring on incremental supply
to meet demand growth− Supply growth (16 MM b/d): U.S. 4.8, Russia 4.6,
Saudi Arabia 2.1, Canada 1.6, China 1.1, Brazil 1.0, Net Others 0.8
Short-Term: Low price due to oversupply & resultant inventory build• 2011–2015 liquids supply up 7.9 MM b/d
− U.S. tight oil growth and Saudi policies result in current oversupply and inventory build
− Supply growth (MM b/d): U.S. 4.8, Iraq 1.3, Saudi Arabia 1.1, Canada 0.9, Net Others -0.2
• Supply/demand expected to rebalance in 2017− Response to low price signals have begun− Key 2016 trends: Demand to grow, US tight oil
production to decline and Iranian production to grow
Long-Term Global Oil Demand and WTI Price
World Liquids Supply & Demand
-2
0
2
4
6
80
85
90
95
100
MM
b/d
MM
b/d
Stock Change (right axis)World Supply (left axis)World Demand (left axis)
WTI Price (right axis)
Forecast
39

Energy Marketing
>$US50/bbl WTI Expected by End 2017
$0$10$20$30$40$50$60
-2
0
2
4
6
Nom
inal
$U
S/b
bl
MM
b/d
Stock ChangeWoodMackenzie WTI ForecastConsensus Economics Avg. Forecast
Stock Change (left axis)
Forecast
02004006008001,0001,2001,4001,6001,800
4
5
6
7
8
9
10
# of
Oil
Rig
s
MM
b/d
U.S. Oil Rig Count (right axis)
U.S. Oil Production (left axis)
Rebalancing of supply and demand expected to raise WTI to >US$50/bbl by Q4/17• 2016/17 world liquids demand expected to rise by
2.7 MM b/d while supply decreases by 0.9 MM b/d• WTI price forecast for Q4/2017:
• WoodMackenzie: US$59/bbl• Consensus Economics Avg.: US$52/bbl
Lower investment leads to lower supply growth• U.S. oil rig count fell from a peak of 1,609 in Oct/14 to
a low of 392 in March/16 (76% drop). • U.S. oil production peaked in June/15 and expected
to decline by 0.6 MM b/d in 2016/17• Global oil capital expenditures dropped from
US$540B in 2014 to US$400B in 2015, and an expected US$330B in 2016 (40% drop in 2 years)
Source: Wood Mackenzie February 2016; Consensus Economics February 2016
WTI Price (right axis)
Source: EIA, Baker Hughes
World Liquids Balance and WTI Price Outlook
U.S. Oil Production and Oil Rig Count
40

Energy Marketing
Higher Prices Required For New Production Development
$0$20$40$60$80$100$120$140$160$180$200
50
60
70
80
90
100
2000
2002
2004
2006
2008
2010
2012
2014
2016
2018
2020
2022
2024
2026
2028
2030
Nom
inal
US
$/bb
l
MM
b/d
Actual WoodMac IEAActual WoodMac McD/Spr/GLJ
Source: IEA World Energy Outlook, December 2015
Demand growth continues and prices recover to ensure supply meets demand• Oil demand growth to continue
− Wood Mackenzie and IEA forecasting similar demand growth, increasing ~8 MM b/d by 2030 (0.7% growth/yr)
• Higher long-term prices required for new production development
− 2018 to 2030 avg. WTI price forecasts (2016 dollars):• Wood Mackenzie (Nov/15): US$80/bbl• McDaniel/Sproule/GLJ Avg.: US$73/bbl
36 MM b/d of new oil production required to meet demand growth & production declines • 28 MM b/d of declines plus 8 MM b/d of oil demand
growth implying 36 MM b/d of new production by 2030
• Key contributors to production growth (MM b/d):• Iraq 3.0, Brazil 2.3, Canada 1.5, Saudi Arabia 1.5, Iran
1.4
• US production peaks around 2022; 2030 US production similar to 2014 levels
Oil Demand (left axis)
WTI Price (right axis)
020406080
100120
MM
b/d
Forecast
Oil Demand and WTI Price Outlook
World Oil Supply Sources
41

• US/Canadian heavy refining capacity exceeds Canadian heavy crude oil production
• US Gulf Coast provides largest market for growth
• TMX and Energy East pipelines will provide access to deep water ports
Energy Marketing
Heavy Oil Refining Capacity Available
Estimated Disposition and Refining Capacity for Canadian Heavy (kbbls/day)
0600
12001800
2014 2019
Western Canada
0600
12001800
2014 2019
US Rockies0
60012001800
2014 2019
Eastern US/Canada0600
12001800
2014 2019
US West Coast
0600
12001800
2014 2019
US Midwest
0600
12001800
2014 2019
US Gulf Coast
0
1000
2000
3000
4000
2014 2019
kbbl
s/da
y
US/Canada Heavy Crude Refining Capacity
AdditionalCapacityAvailable forCanadian Heavy
Canadian HeavyUsage
Access to deep water ports will add market capacity and diversification
Source: CAPP, EIA, Lee & Doma Energy Group
Additional Capacity Available for Canadian Heavy
Canadian Heavy Usage
42

Energy Marketing
Sufficient Western Canadian Takeaway Capacity Expected
0
1,000
2,000
3,000
4,000
5,000
6,000
7,000
2012
2013
2014
2015
2016
2017
2018
2019
2020
2021
2022
2023
2024
2025
2026
2027
2028
2029
2030
kbbl
s/da
y
Western Canada Crude Supply Forecast Pipeline & Local Refining Capacity
Pipeline, Local Refining & Rail Capacity
TMX & Energy East
Enbridge Expansions
Western Canadian Supply and Takeaway Capacity
Source: CAPP, Lee & Doma Energy Group
Fort Hills’ First Oil Sufficient takeaway capacity expected for forecast growth
• 2011–2014− Rapid production growth resulted in
takeaway capacity challenges− Industry added significant pipeline and
rail capacity during this time
• 2015–2030− Existing pipeline capacity, new pipelines
(TMX and Energy East) and existing rail capacity expected to provide sufficient takeaway capacity
43

WTI - WCS Annual Average Price Differentials
Sufficient takeaway capacity results in current WTI-WCS differentials
• 2011–2014− Takeaway capacity challenges drive
wider WTI - WCS differentials, averaging ~US$25/bbl in 2013
• 2015–2030− Sufficient takeaway capacity developed
and WTI - WCS differential narrowed to ~US$14/bbl in 2015
− Current differentials expected to persist with sufficient takeaway capacity available
$14.19
$17.09
$21.01
$25.12
$19.63
$13.69 $14.00
$0
$5
$10
$15
$20
$25
$30
2010 2011 2012 2013 2014 2015 2018-2030Real
Forecast*
Nom
inal
US
$/bb
l
* In 2016 real US dollars. Assumes US$75/bbl WTI.Source: GLJ (historicals), Lee & Doma Energy Group (forecast)
Average real price differential of US$14/bbl expected 2018-2030
Energy Marketing
Current Differentials Expected to Persist
44

45
Energy Marketing
Market Rebalance Expected in 2017
• 36 MM b/d of new oil production required by 2030• Higher prices required for new production development• US/Canadian heavy refining capacity can accommodate
growing Canadian heavy production• Sufficient Western Canadian takeaway capacity expected

Marketing
Agenda
Overview
Steelmaking Coal
Base Metals
Energy
Summary
46
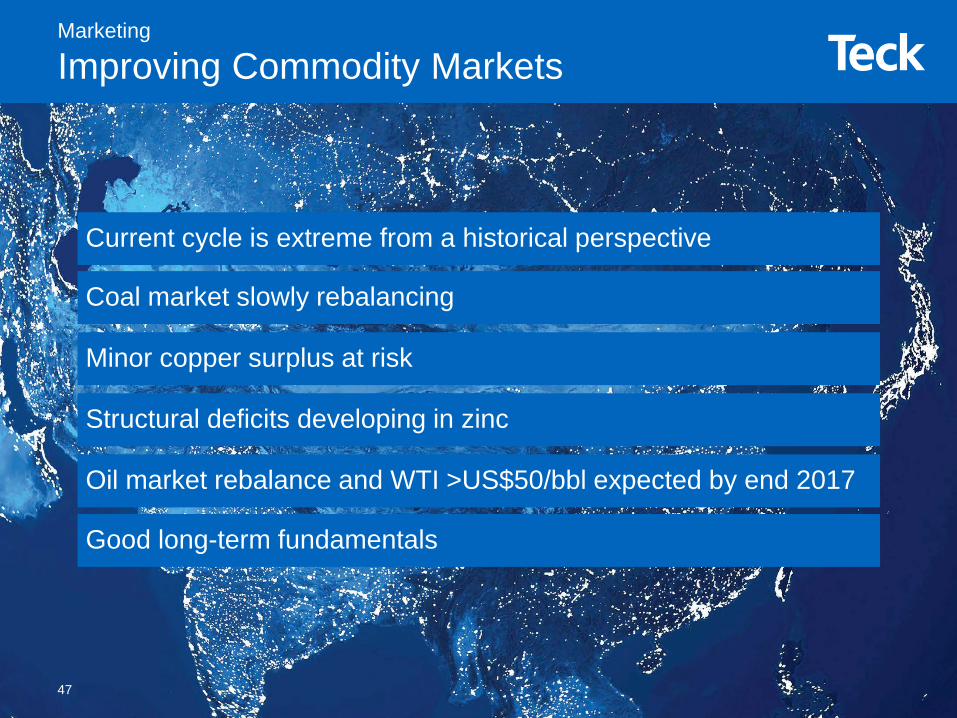
Current cycle is extreme from a historical perspective
Coal market slowly rebalancing
Minor copper surplus at risk
Structural deficits developing in zinc
Oil market rebalance and WTI >US$50/bbl expected by end 2017
Good long-term fundamentals
Marketing
Improving Commodity Markets
47

Energy ProjectsMarch 30, 2016Ray Reipas, Senior Vice President, EnergyTim Watson, Senior Vice President, Project Development

Energy Projects
Agenda
Energy Business
Fort Hills
3

Energy Business
Building A Valuable Energy Business
4
Market strategy and market access are progressing
Fort Hills economics are robust
Significant free cash flow over 50 year project life at expected long term oil price

Energy Business
Progress in Implementing Our Diversified Marketing Strategy
Market Access Options for Teck’s 50 kbbls/day of Fort Hills Diluted Bitumen Blend
Cushing
Flanagan
Houston
Kitimat
Edmonton
US Gulf Coast
Europe
Asia
TransCanada Energy East (Proposed, Contract Carriage)Enbridge Northern Gateway (Proposed, Contract Carriage)
TransCanada Keystone/MarketLink (Existing, Contract Carriage)Enbridge Flanagan South (Existing, Contract Carriage)
Vancouver
TransMountain Pipeline Expansion (Proposed, Contract Carriage)
Asia
Agreements for pipelines to Hardisty in place
Agreement for Hardisty product storage in place
Monitoring production vs market access balance
Developing a portfolio of pipeline capacity opportunities, to enable access to diversified markets
Evaluating opportunities in the secondary market for pipeline capacity
Developing a diversified customer base
Hardisty
Chicago
Sarnia
Patoka
SuperiorGuernsey
MontrealSaint John
Enbridge Mainline System (Existing, Common Carriage)Spectra Express (Existing, Contract Carriage)
Teck can enter into long-term take or pay contracts
5

East Tank Farm Blending w/Condensate
Energy Business
Committed Logistics Solutions in Alberta
Pipeline/Terminal OperatorPipelineCapacity
(kbpd)
Teck Capacity
(kbpd)Status
Northern Courier Hot Bitumen TransCanada 202 40.4 Construction on schedule
East Tank Farm -Blending Suncor 292 58.4 Modules constructed and on site; tank construction
ahead of schedule
Wood Buffalo Blend Pipeline Enbridge 550 65.3 In service
Wood Buffalo Extension Enbridge 550 65.3 Pipeline 80% complete, beginning pump stationconstruction
Norlite Diluent Pipeline Enbridge 130 18.0 Construction on schedule: In service May 2017
Hardisty Blend Tankage Gibsons 425 kbbls 425 kbbls Construction ahead of schedule: In service Q4 2016
Wood BuffaloExtension
NorliteDiluent Pipeline
Cheecham Terminal
Hardisty Terminal
Wood Buffalo Pipeline
AthabascaPipeline
Edmonton Terminal
Fort HillsMine Terminal
Northern CourierHot Bitumen Pipeline
Teck
OptionsExport Pipeline
Rail
Local Market
Pipeline LegendBitumenBlendDiluentExistingNew
Kirby AthabascaTwin Pipeline
6
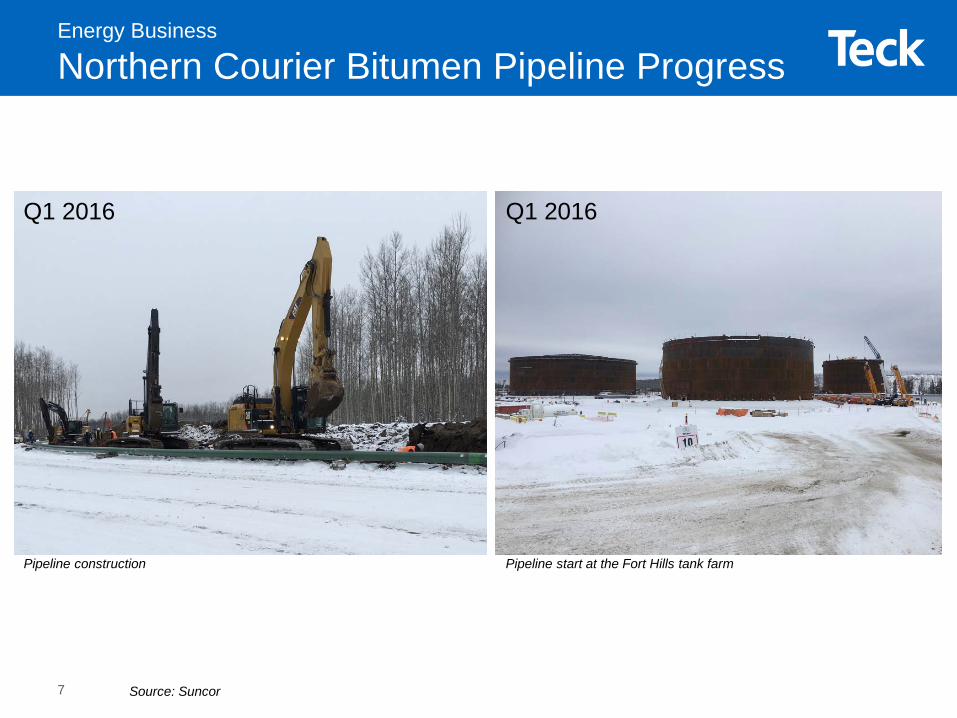
Source: Suncor
Energy Business
Northern Courier Bitumen Pipeline Progress
Q1 2016 Q1 2016
Pipeline start at the Fort Hills tank farmPipeline construction
7

Source: Suncor
Q1 2016
Energy Business
East Tank Farm Progress
8

Source: Teck
Q1 2016 Q1 2016
Energy Business
Wood Buffalo Extension Pipeline Progress
9

Source: Teck
Energy Business
Norlite Diluent Pipeline Progress
Q1 2016 Q1 2016
10

Source: Gibson’s
Q1 2016 Q1 2016
Energy Business
Gibson’s Tank at Hardisty Progress
11

Source: Teck 1. Estimates are based on exchange rates as shown, expected bitumen netbacks, and operating costs of C$25 per barrel
(including sustaining capital of C$3-5 per barrel). 2. Per barrel of bitumen.3. Sanction capex is the go-forward amount from the date of the Fort Hills sanction decision (October 30, 2013), denominated
in Canadian dollars and on a fully-escalated basis. 4. Pre-tax free cash flow yield during pre and post capital recovery periods.5. Post-payout estimated net margin includes C$1.50 export market premium.
The Fort Hills project is expected to have significant free cash flow yield across a range of WTI prices
Fort Hills Free Cash Flow Yield4
Sensitivity to WTI PricePotential Contribution
from Fort Hills US$60 WTI
& $1.30 USD/CAD
US$75 WTI & $1.20
USD/CAD
Pre-Payout Post-Payout
Teck’s share of annual production (36,000 bpd) 13 Mbpa 13 Mbpa
Estimated netback2 ~$40/bbl ~$55.50/bbl
Estimated operating margin2 ~$15/bbl ~$30.50/bbl
Alberta oil royalty2 ~$1.50/bbl ~$10/bbl
Estimated net margin2,5 ~$13.50/bbl ~$22/bbl
Annual pre-tax cash flow ~$180 M ~$290 M
Teck’s share of sanction capex3 ~$2,940 M ~$2,940 M
Free cash flow yield4 ~6% ~10%
Energy Business
Fort Hills Project Economics Are Robust1
0%
5%
10%
15%
20%
25%
$40 $50 $60 $70 $80 $90 $100 $110 $120
Free
Cas
h Fl
ow Y
ield
WTI $/bbl
Post-Payout @$1.20 USD/CAD
Pre-Payout@$1.30 USD/CAD
12

Energy Business
Building A Valuable Energy Business
13
Market strategy and market access are progressing
Fort Hills economics are robust
Significant free cash flow over 50 year project life at expected long term oil price

Energy Projects
Agenda
Energy Business
Fort Hills
14

15
On schedule, with construction >53% complete1
On budget, with significant contingency remaining
Commissioning starting in 15 months
1. As at February 29, 2016.Photo Source: Suncor
Fort Hills
Fort Hills Project On Track

>95% Engineering completeapproximate as at February 29, 2016
>53% Construction completeapproximate as at February 29, 2016
Project Progressconstruction has surpassed the midway point and the project continues to track positively within schedule expectations
Global fabrication, module and logistics programperforming well to date, delivering positive results
All critical schedule milestones have been achieved to date supporting target 2017 first oil
Safety and Environmentcontinued positive performance
Construction hours2 reportable environmental; 0 regulatory non-compliance~28MRecordable injury frequencyper 200,000 exposure hours0.45-0.55
Fort Hills
Project Status & Progress
16

Teck’s Sanction Capital2
~$2.94billion
Teck’s Estimated 2016 Spend
$960million
Teck’s Remaining Capital3
~$1.2billion
Operating & Sustaining Costs4
$25-28per barrel of bitumen
Sustaining Capital4
$3-5per barrel of bitumen
Teck’s Share of Production
13,000,000bitumen barrels per year
1. All costs and capital are based on Suncor’s estimates.2. Sanction capital is the go-forward amount from the date of the Fort Hills sanction decision (October 30, 2013), denominated in
Canadian dollars and on a fully-escalated basis. Includes earn-in of $240M. 3. As of February 10, 2016.4. Sustaining capital is included in operating & sustaining costs.
Mine life: 50 years
Fort Hills
Key Numbers1
17

Fort Hills
Bitumen Production & Blend Supply
0
10
20
30
40
50
60
0
10
20
30
40
50
60
K bb
ls/d
ay
K bb
ls/d
ay
Estimated Fort Hills Production1 -First 36 Months
Bitumen Diluent Available Blend
Fort Hills• Teck Share: 20%, or 36 kbpd of bitumen• Start-up: December 2017• 90% production after 12 months• Production varies based on operating
conditions and throughput
Diluent Blending Required• Diluent required to meet pipeline viscosity
specifications• Typical barrel of blended bitumen: 75%
bitumen and 25% diluent• Blend requirements depend on bitumen
density, diluent quality and seasonality
Total blend for Teck: 45-50 kbpd
1. Teck’s share of production.18

Fort Hills
Site Overview
Source: Suncor
Q1 2016

Fort Hills
Ore Preparation PlantMSE Wall & Crusher
Q1 2015
Source: Suncor19

Fort Hills
Ore Preparation Plant
Source: Suncor
Q1 2016

Fort Hills
Ore Preparation PlantOne of Two Crusher Stations
Q1 2016
Source: Suncor20

Fort Hills
Ore Preparation PlantOne of Two Crusher Stations
Source: Suncor
Q1 2016

Q1 2016
Fort Hills
Ore Preparation PlantSurge Bin, Conveyors, Rotary Breaker Building
Source: Suncor
Q2 2015
21

Fort Hills
Extraction & Tailings
Source: Suncor
Q1 2016

Fort Hills
Extraction & TailingsPrimary Separation Cells, Flotation & Tailings Buildings
Q1 2015
Source: Suncor22

Fort Hills
Extraction & TailingsPrimary Separation Cells, Flotation & Tailings Buildings
Q1 2016
Source: Suncor23

Fort Hills
Secondary Extraction
Q2 2015
Q4 2015
Source: Suncor24

Fort Hills
Secondary Extraction
Source: Suncor
Q1 2016

Fort Hills
Secondary Extraction
Source: Suncor
Q1 2016
25

Fort Hills
Secondary ExtractionSolvent Bullets Installed
Q1 2016
Q1 2016
Source: Suncor26

Fort Hills
River Water Intake Coffer Dam
Q2 2014 Q4 2015
Source: Suncor27

Fort Hills
River Water Intake Mechanical Installation of Pumphouse
Q1 2016
Source: Suncor28

Fort Hills
Utilities & Offsites
Source: Suncor
Q1 2016

Fort Hills
Utilities & OffsitesBoiler Installation
Q1 2016
Source: Suncor29

Fort Hills
Utilities & OffsitesStorage Tanks
Q1 2016
Source: Suncor30

On schedule, with construction >53% complete1
On budget, with significant contingency remaining
Commissioning starting in 15 months
1. As at February 29, 2016.Photo Source: Suncor
Fort Hills
Fort Hills Project On Track
31

SustainabilityMarch 30, 2016Marcia Smith, Senior Vice President, Sustainability & External Affairs

• Six focus areas• Community • Biodiversity• Our People• Water• Air• Energy and Climate Change
• Achieved all 2015 goals• Set new short-term 2020
goals • Working towards long-term
2030 goals
Sustainability
Our Sustainability Strategy
3
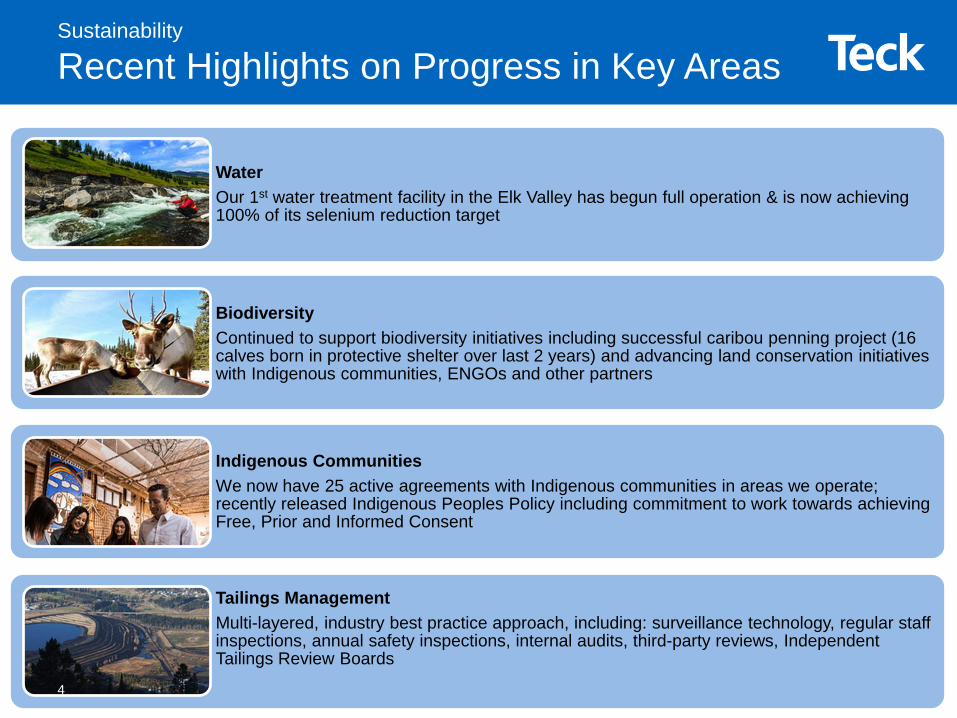
Sustainability
Recent Highlights on Progress in Key Areas
Water Our 1st water treatment facility in the Elk Valley has begun full operation & is now achieving 100% of its selenium reduction target
BiodiversityContinued to support biodiversity initiatives including successful caribou penning project (16 calves born in protective shelter over last 2 years) and advancing land conservation initiatives with Indigenous communities, ENGOs and other partners
Indigenous CommunitiesWe now have 25 active agreements with Indigenous communities in areas we operate; recently released Indigenous Peoples Policy including commitment to work towards achieving Free, Prior and Informed Consent
Tailings ManagementMulti-layered, industry best practice approach, including: surveillance technology, regular staff inspections, annual safety inspections, internal audits, third-party reviews, Independent Tailings Review Boards
4
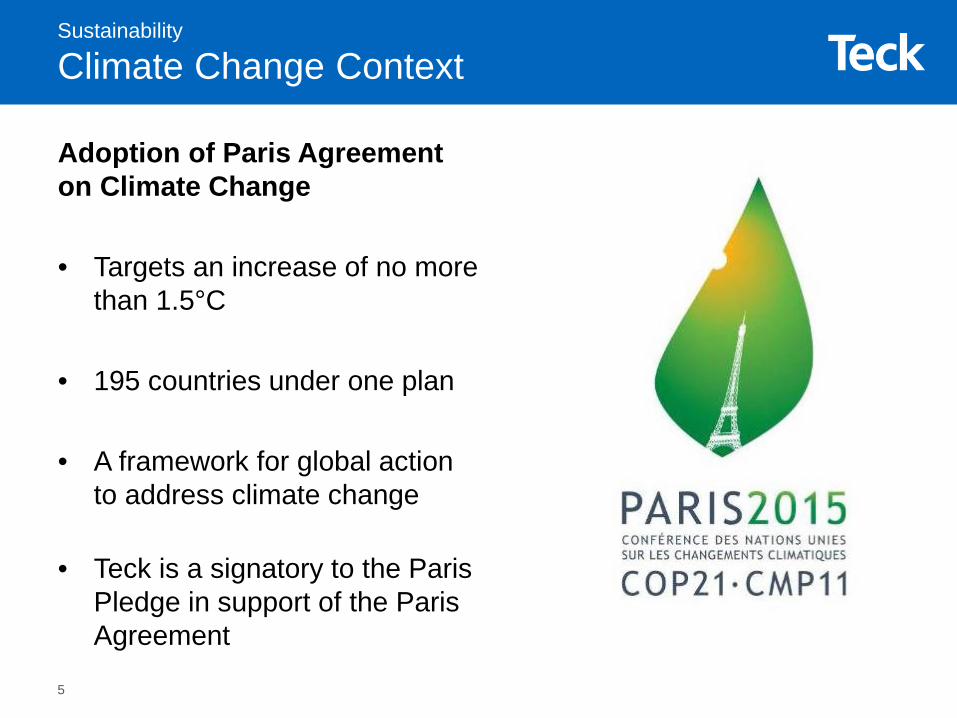
Adoption of Paris Agreementon Climate Change
• Targets an increase of no more than 1.5°C
• 195 countries under one plan
• A framework for global action to address climate change
• Teck is a signatory to the Paris Pledge in support of the Paris Agreement
Sustainability
Climate Change Context
5

• In British Columbia, Elk Valley Steelmaking coal mines, Highland Valley Copper mine, Trail Operations smelter charged at $30/t of CO2
• In Alberta, $20/t of CO2 charged over specified target
• Movement towards global climate action will level playing field
Sustainability
Climate Change Teck Context
6
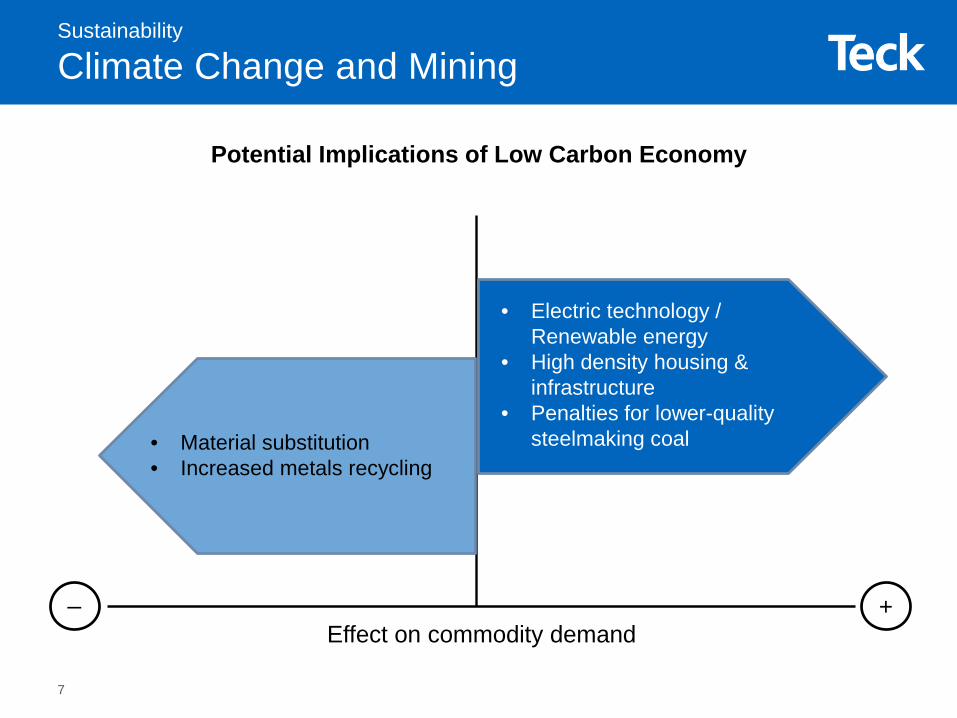
Sustainability
Climate Change and Mining
Potential Implications of Low Carbon Economy
+_Effect on commodity demand
• Material substitution• Increased metals recycling
• Electric technology / Renewable energy
• High density housing & infrastructure
• Penalties for lower-quality steelmaking coal
7
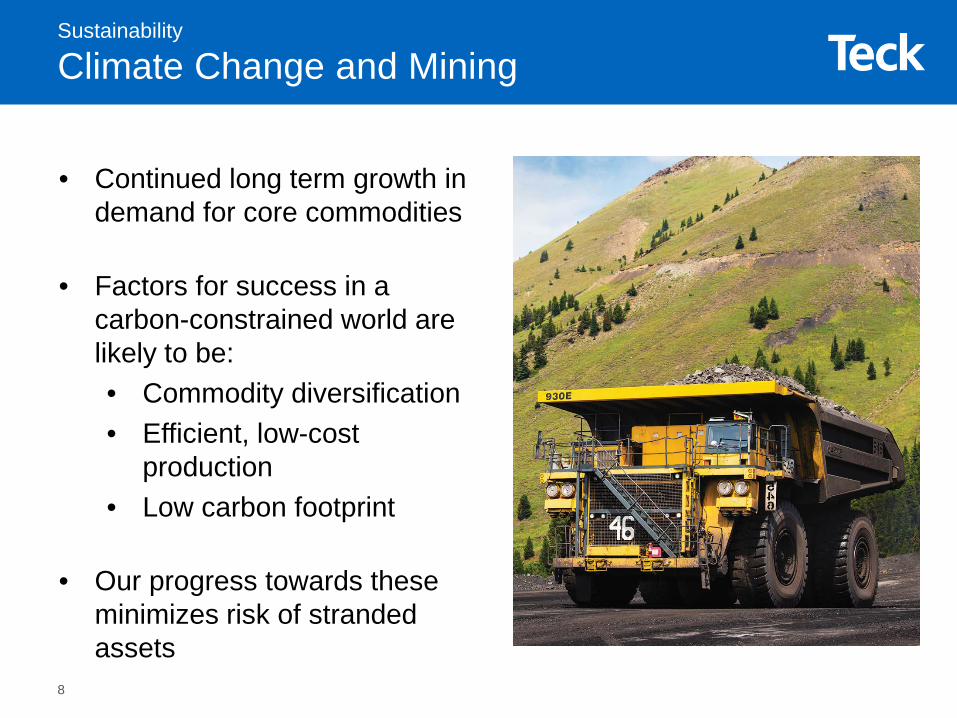
• Continued long term growth in demand for core commodities
• Factors for success in a carbon-constrained world are likely to be:• Commodity diversification• Efficient, low-cost
production• Low carbon footprint
• Our progress towards these minimizes risk of stranded assets
Sustainability
Climate Change and Mining
8

Sustainability
Carbon Reduction: Our Performance
Source: ICMM Report “The cost of carbon pricing”, Teck
GHG Emissions Intensity Ranges among ICMM member companies:
Teck
Teck
Copper
Coal
Over 200,000 tonnes of annual GHG reductions have been achieved at Teck operations since 2011
Teck products among lowest carbon intensity in the world
9

Sustainability
Carbon Reduction: Our Long Term Strategy
Our strategy:• Improve energy efficiency• Implement low carbon
technologies• Expand alternative energy
use
2030 GHG reduction target:• 450,000 tonnes
Implementing specific GHG reduction initiatives, e.g.:
• Operational efficiency• LNG trucks• Mine design
0
5
10
15
20
25
30
35
2011 2012 2013 2014 2015
Wintering Hills (Wind)
Waneta Expansion Plant (Hydro)
QB (Solar)
Teck Alternative Energy Implementation(MW average annual output)
2015 goal
10

Sustainability
Summary
In the low carbon economy of the future, successful miners will be: Diversified Low cost Low carbon
11

Sustainability
Questions?
Best 50 Corporate Citizens in Canada 2015
On the Dow Jones Sustainability World Index six years in a row
One of top 100 most sustainable companies in the world and one of Canada’s most sustainable companies
Top 50 Socially Responsible Corporations in Canada
Listed on FTSE4Good Index in 2015
12

Investor and Analyst DayMarch 30, 2016