Embed Size (px)
Citation preview


2
This presentation contains certain statements that constitute forward-looking information within the meaning of applicable securities laws (“forward-looking statements”),
which reflects management’s expectations regarding Teranga Gold Corporation’s (“Teranga” or the “Company”) future growth, results of operations (including, without
limitation, future production and capital expenditures), performance (both operational and financial) and business prospects (including the timing and development of new
deposits and the success of exploration activities) and opportunities. Wherever possible, words such as “plans”, “expects”, “does not expect”, “budget”, “scheduled”,
“estimates”, “forecasts”, “anticipate” or “does not anticipate”, “believe”, “intend”, “ability to” and similar expressions or statements that certain actions, events or results “may”,
“could”, “would”, “might” or “will” be taken, occur or be achieved, have been used to identify such forward looking information. Although the forward-looking information
contained in this presentation reflect management’s current beliefs based upon information currently available to management and based upon what management believes to
be reasonable assumptions, Teranga cannot be certain that actual results will be consistent with such forward looking information. Such forward-looking statements are
based upon assumptions, opinions and analysis made by management in light of its experience, current conditions and its expectations of future developments that
management believe to be reasonable and relevant. These assumptions include, among other things, the ability to obtain any requisite Senegalese governmental approvals,
the accuracy of mineral reserve and mineral resource estimates, gold price, exchange rates, fuel and energy costs, future economic conditions, anticipated future estimates of
free cash flow, and courses of action. Teranga cautions you not to place undue reliance upon any such forward-looking statements
The risks and uncertainties that may affect forward-looking statements include, among others: the inherent risks involved in exploration and development of mineral
properties, including government approvals and permitting, changes in economic conditions, changes in the worldwide price of gold and other key inputs, changes in mine
plans and other factors, such as project execution delays, many of which are beyond the control of Teranga, as well as other risks and uncertainties which are more fully
described in the Company’s Revised Annual Information Form dated September 1, 2015, and in other company filings with securities and regulatory authorities which are
available at www.sedar.com. Teranga does not undertake any obligation to update forward-looking statements should assumptions related to these plans, estimates,
projections, beliefs and opinions change. Nothing in this report should be construed as either an offer to sell or a solicitation to buy or sell Teranga securities.
This presentation is dated as of the date on the front cover. All references to the Company include its subsidiaries unless the context requires otherwise.
This presentation contains references to Teranga using the words “we”, “us”, “our” and similar words and the reader is referred to using the words “you”, “your” and similar
words.
All dollar amounts stated are denominated in U.S. dollars unless specified otherwise.
FORWARD-LOOKING STATEMENTS

Lowering costs
Increasing mill throughput
Increasing long-term sustainable free cash flow(1)
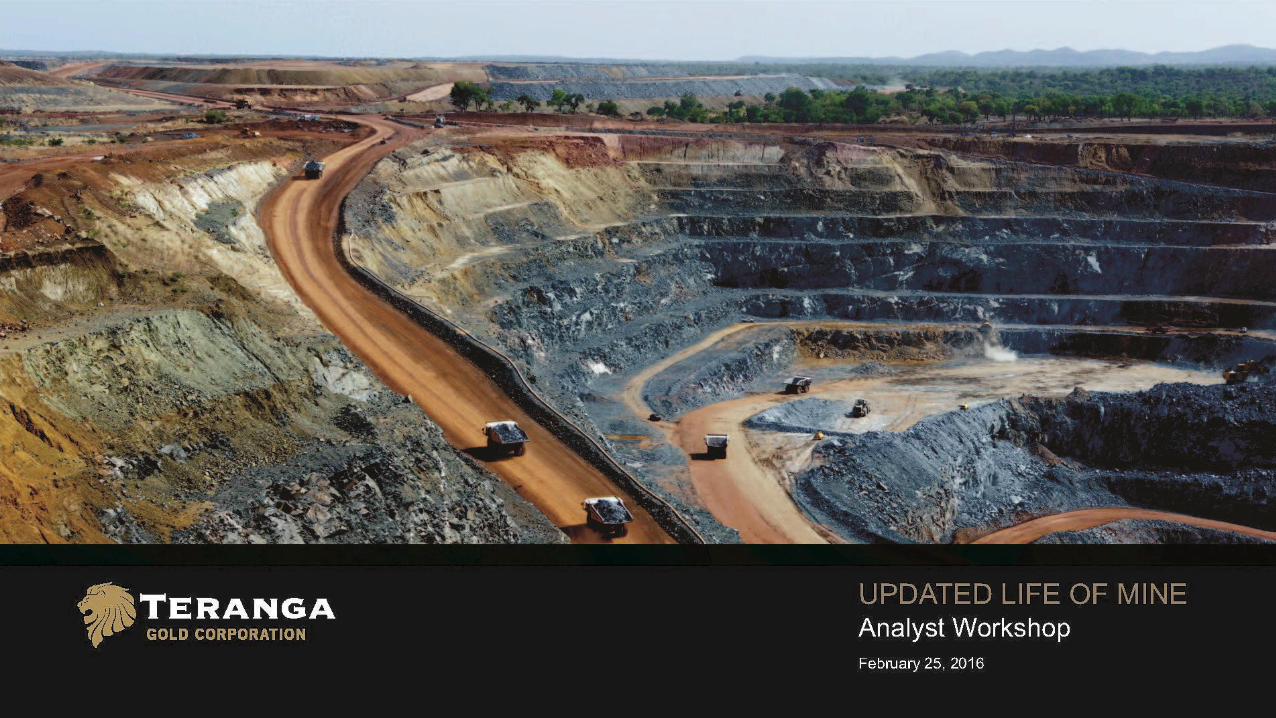
UPDATED LIFE OF MINE: HIGHLIGHTS
Refer to endnote (1) on slide 37

4
(8)
90
180
330
390
350
730
2.6M Proven & Probable Reserves(As at December 31, 2015)
Proven and Probable Reserves(2)
(in Moz)
Refer to endnote (2) on slide 37
CONTINUING TO REPLACE PROVEN AND PROBABLE RESERVES
2011 2012 2013 2014 2015
1.7 1.6
2.82.6 2.6
310
220
30
13.5-year mine life – replaced proven and probable reserves in 2015

5
PITS IN CLOSE PROXIMITY TO MILL

CAPITAL & OPERATING
COST SUMMARIES

7
US$1,100
Gold spot price
per ounce beyond
2016 - reserves
US$1.10
Euro/US$
exchange rate
US$0.15
Per kilowatt hour
US$50
Per barrel
brent crude
UPDATED LIFE OF MINE: ASSUMPTIONS

8
Benefitting from exempted fuel levies, lower fuel price and favourable foreign exchange rate
2014 Sabodala Mining Cost Bridge to Current
Cost Environment
$2.88
$2.23
$0.07
$0.44
$0.14
1.50
1.70
1.90
2.10
2.30
2.50
2.70
2.90
3.10
Actual 2014Mining Cost
Fuel Levies F/X Change Fuel PriceDecrease
2014 Mining UnitCost in
Current CostEnvironment
Min
ing C
ost
(US
$/t
)
LFO44%
Employee Costs34%
Equipment Maintenance & Consumables
22%
50%-60% of Mining Costs are Euro-based
23%
~30% of Teranga’s
total mining costs
are fuel related
2014 MINING UNIT COST BRIDGE TO CURRENT COST ENVIRONMENT

9
LIFE OF MINE - MINING UNIT COSTS BY PIT
Gora 4.86 $/t Ore
Golouma 1.50 $/t Ore
Kerekounda 1.50 $/t Ore
Maki Medina 1.50 $/t Ore
Mining Unit Cost Breakdown
Long Haul Ore Unit Cost*
Loading Cost 0.21 $/t
Haul Costs 0.49 $/t
Drill Costs 0.29 $/t
Blasting Costs 0.30 $/t
Support Equipment Cost 0.02 $/t
Ancilliary Cost 0.16 $/t
Overhead Cost 0.73 $/t
Subtotal 2.20 $/t
Long Haul Ore Cost 0.05 $/t
Total 2.25 $/t
Item Oxide Fresh
Drill Costs 0.21 $/t 0.31 $/t
Blasting Costs 0.26 $/t 0.31 $/t
Units 2016 2017 2018 2019 2020 2021 2022 2023 2024 Total
Golouma $/t Mined 2.30 2.21 2.49 3.39 2.34
Fresh $/t Mined 2.43 2.32 2.49 3.39 2.43
Oxide $/t Mined 2.12 2.12 2.08 2.12
Gora $/t Mined 2.26 2.48 3.72 2.36
Fresh $/t Mined 2.41 2.49 3.72 2.46
Oxide $/t Mined 1.99 2.30 2.02
Kerekounda $/t Mined 1.90 2.10 2.42 2.09
Fresh $/t Mined 2.05 2.19 2.42 2.23
Oxide $/t Mined 1.90 1.95 1.93
Masato $/t Mined 2.36 2.06 2.12 2.11 2.19 2.31 2.37 2.46 2.23
Fresh $/t Mined 2.36 2.12 2.18 2.15 2.20 2.31 2.37 2.46 2.27
Oxide $/t Mined 2.25 1.97 1.99 1.98 2.02 2.26 1.98
Niakafiri $/t Mined 1.94 1.97 2.24 2.05
Fresh $/t Mined 2.19 2.21 2.25 2.24
Oxide $/t Mined 1.93 1.93 2.02 1.93
Sabodala $/t Mined 2.22 2.40 2.52 2.37
Fresh $/t Mined 2.25 2.40 2.52 2.38
Oxide $/t Mined 2.02 2.02
Maki Medina $/t Mined 2.24 2.24
Fresh $/t Mined 2.63 2.63
Oxide $/t Mined 2.13 2.13
Total $/t Mined 2.24 2.27 2.25 2.20 2.29 2.19 2.31 2.17 2.36 2.25
* Long haul ore costs based on contractor rates
(in use at Gora since 2015)
Calibrated to actual costs and productivities for life of mine

10
2014 PROCESSING UNIT COST BRIDGE TO CURRENT COST ENVIRONMENT
Mill Optimization Cost Improvements
• Graph quantifies only the unit cost savings
realized by the increased production of fresh ore
• Additional operational efficiency gains will be
quantified once the mill optimization has been
commissioned and is operational
$17.15
$10.36
$1.47
$1.54
$3.30
$0.48
5.00
7.00
9.00
11.00
13.00
15.00
17.00
19.00
Actual 2014Milling Cost
Fuel Levies F/X Change Fuel PriceDecrease
MillOptimization
2014 MillingUnit Cost inCurrent CostEnvironment
Pro
ce
ss C
ost (U
S$
/t)
40%
Fuel79%
Employee Costs21%
50%-60% of Milling Costs are Euro-based2014 Sabodala Processing Cost Bridge to
Current Cost Environment
Benefitting from exempted fuel levies, favourable F/X, lower fuel price and fully commissioned mill optimization

11
PROCESSING UNIT COSTS DRIVEN BY ORE BLEND
The main variations in processing costs by year are driven primarily by the material throughput blend
0.00
0.50
1.00
1.50
2.00
2.50
3.00
3.50
4.00
4.50
5.00
7.00
7.50
8.00
8.50
9.00
9.50
10.00
10.50
11.00
11.50
12.00
2016 2017 2018 2019 2020 2021 2022 2023 2024 2025 2026 2027 2028 2029
Mill
ed M
ate
rial (M
t)
Pro
cessin
g C
ost
(US
$/t)
LOM Processing Costs and Tonnages
Fresh Material & Stockpile Oxide Material Annual Average Costs LOM Average Costs
12
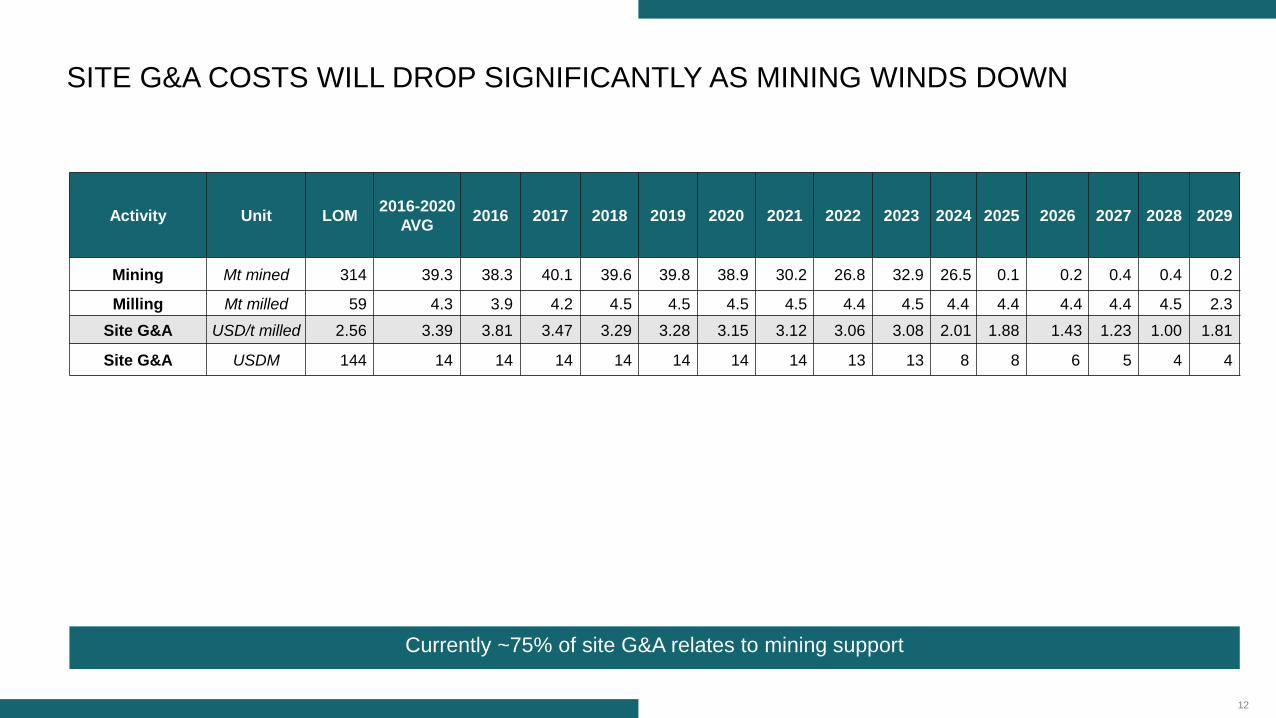
SITE G&A COSTS WILL DROP SIGNIFICANTLY AS MINING WINDS DOWN
Activity Unit LOM2016-2020
AVG2016 2017 2018 2019 2020 2021 2022 2023 2024 2025 2026 2027 2028 2029
Mining Mt mined 314 39.3 38.3 40.1 39.6 39.8 38.9 30.2 26.8 32.9 26.5 0.1 0.2 0.4 0.4 0.2
Milling Mt milled 59 4.3 3.9 4.2 4.5 4.5 4.5 4.5 4.4 4.5 4.4 4.4 4.4 4.4 4.5 2.3
Site G&A USD/t milled 2.56 3.39 3.81 3.47 3.29 3.28 3.15 3.12 3.06 3.08 2.01 1.88 1.43 1.23 1.00 1.81
Site G&A USDM 144 14 14 14 14 14 14 14 13 13 8 8 6 5 4 4
Currently ~75% of site G&A relates to mining support

13
Open Pit Mining$29.9M Process Plant
$18.9M
Admin & Other$8.8M
Community Relations
$25.0M
Pit Development$4.3M
Equipment & Development Costs
$46.0M
Sustaining Costs$56.0M
Other Projects & Development*
$21.8M
Underground
Mine
$102.1M
LIFE OF MINE CAPITAL COSTS TOTALING US $211M
$25.7M
$9.2M $8.7M
$4.5M
$31.6M
$41.1M
$29.4M
$12.2M
$2.9M
$9.8M
$18.9M
$11.1M
$4.9M
$0.9M
$0M
$5M
$10M
$15M
$20M
$25M
$30M
$35M
$40M
$45M
2016 2017 2018 2019 2020 2021 2022 2023 2024 2025 2026 2027 2028 2029
Other Projects & Development*
Underground Mine
Pit Development
Community Relations
Admin & Other
Process Plant
Open Pit Mining
~ 50% capex attributed to underground mine development, which is scheduled to start in 2020
Breakdown of Annual Capital Costs
*Includes: Tailings Storage Facility #1 Raise, Tailings Storage Facility #2, and Mill Optimization Project

14
UPDATED LIFE OF MINE PLAN: SOLID FIRST 5-YEARS
Higher throughput offsets lower grades
215229
202 200190
128
173
225
263
104 109
135 139
63
0
50
100
150
200
250
300
3.8
3.9
4.0
4.1
4.2
4.3
4.4
4.5
2016 2017 2018 2019 2020 2021 2022 2023 2024 2025 2026 2027 2028 2029
Pro
du
ce
d G
old
(K
oz)
Mill
ed
Ore
(M
t)
Produced Oz Ore Milled
Average production (2016-2020)
207Koz
Conversion of resources into reserves,
if successful, may address gap

15
SIGNIFICANT INCREASE IN THROUGHPUT DUE TO MILL OPTIMIZATION
2016 LOM Mill Rate vs 2014 LOM Mill Rate
3.5
3.6
3.7
3.8
3.9
4.0
4.1
4.2
4.3
4.4
4.5
2016 2017 2018 2019 2020 2021 2022 2023 2024 2025 2026 2027 2028 2029
Mill
ed
Ore
(M
t)
Ore Milled (2016 LOM Plan) Ore Milled (2014 LOM Plan)
Well-positioned to generate free cash at $1,100 gold price – free cash flow expected to accelerate at higher prices
∆ due to increased
reserves over same
time frame

TECHNICAL SUMMARIES

17
PIT SEQUENCING TO MAXIMIZE FREE CASH FLOW
• Niakafiri Main pit starts in year 2023
• Material movement decreases from year
2021 to account for lower equipment
availability
• LOM average strip ratio is 6.5
(waste to ore)
• Maximum material movement per year is
40 Mt using current equipment fleet
• 390Koz stockpile provides backstop
0 Koz
50 Koz
100 Koz
150 Koz
200 Koz
250 Koz
300 Koz
350 Koz
400 Koz
450 Koz
0 Mt
5 Mt
10 Mt
15 Mt
20 Mt
25 Mt
30 Mt
35 Mt
40 Mt
45 Mt
2016 2017 2018 2019 2020 2021 2022 2023 2024
Open Pit Material Movement by Location
Sabodala Masato Gora
Kerekounda Golouma (W/S) Niakafiri (TGZ/SE/SW)
Maki Medina Contained Ounces

18
UNDERGROUND MINING: SCHEDULE
Underground
• Updated from feasibility study by SRK with Oromin
• Pre-feasibility by RPA with new economics
• Using conservative cut and fill method
• Mining two zones at a time
• Contractor labor will be utilized, but owner
supervision and technical staff
• Owner purchased mobile equipment
• Ore and waste will be stockpiled near mine portal
• Cemented rock fill will be used for first 2 lifts only –
life 3 and 4 will use unconsolidated rock fill
-
10,000
20,000
30,000
40,000
50,000
60,000
70,000
80,000
0
50
100
150
200
250
300
350
400
450
2020 2021 2022 2023 2024 2025 2026 2027 2028 2029
Min
ed
Go
ld (
Co
nta
ine
d O
z)
Extr
acte
d T
on
ne
s (
'00
0s)
Underground Mined Ore Tonnes
Kerekounda Golouma South Golouma West 1
Golouma West 3 Gold Mined (Contained Oz)
LOM average $72.23/t processed
Operating Costs
Total Capital Costs Underground LOM
Horizontal development $51.0M
Vertical development $5.4M
Mine equipment $45.8M

19
UNDERGROUND MINING: TECHNICAL DETAILS
Legend
Waste drift connecting stope Dark brown
Level access Light brown
Lift access/Attack ramp Green
Sump Blue
Vent drift Cyan
Remuck Magenta
Golouma
West 1
KerekoundaGolouma
South
Golouma
West 3
Zone Development Unit Total 2021 2022 2023 2024 2025 2026 2027 2028 2029
Kerekounda Horizontal m 14,781 4,022 4,471 3,628 1,773 887 - - - -
Vertical m 208 208 - - - - - - - -
Golouma South Horizontal m 219,946 - 4,340 4,437 3,817 950 - - - -
Vertical m 203 - 182 21 - - - - - -
Golouma West -
P1 Horizontal m 15,938 - - - - - 4,206 4,865 4,210 2,657
Vertical m 272 - - - - - 168 104
Golouma West -
P3 Horizontal m 13,829 - - - - - 4,103 5,024 3,863 839
Vertical m 298 - - - - - 196 61 41 -
Annual Total m 265,475 4,230 165,419 41,566 16,771 7,152 8,673 10,054 8,114 3,496
Preliminary analysis is conservative – does not include opportunities for more reserves, lower costs & higher gold price

20
MILL OPTIMIZATION: TECHNICAL BASISSustaining Capital Upgrades
SAG Mill
• Trommel screen installation
• Redesign of liner configuration
• Installation of vortex discharge head
Ball Mill Circuit
• Increases ball charge to 38%
• Motor power +500kW each, cooling systems, new gearboxes
Second Crusher
• Steady feed opportunity
Parameters Units
Base Cases High Capacity
Pulp Lifters &
Upgraded Ball
Mills to 4.5MW
Optimized
Current
Circuit
Relaxed
Product
Size
Circuit Parameters
Net Milling Rate tph 440 481 503
Secondary Crushed Feed % Feed 48 48 49
Feed F80 mm 90.6 90.1 89.0
Product P80 um 90 106 90
A x b 37.8 37.8 37.8
BWi kWh/t 19.4 19.4 19.4
SAG Mill
SAG Mill Pinion Power kW 3,061 3,219 3,206
Pebble Crushing
Feed Rate tph 99 82 95
% of new Feed % 22.4 17.1 18.9
Crusher F80 mm 33 29 28
Crusher P80 mm 19.5 19.2 19
Ball Mill
Ball Mill #1 Pinion Power kW 3,550 3,550 4,145
Ball Mill #2 Pinion Power kW 3,565 3,565 4,145
Circuit Specific Energy
SAG Mill kWh/t 7.0 6.7 6.4
Crusher kWh/t 0.09 0.07 0.08
Ball Mill kWh/t 16.2 14.8 16.5
Total kWh/t 23.2 21.6 22.9
fSAG kWh/t 1.15 1.15 1.13
Crusher Availability Impact

21
MILL OPTIMIZATION: STATUS
Mill Optimization
• Project is on time and on budget – Commissioning Q4 2016
• Majority of material on site (February 2016)
• All work completed to date is Lost Time Injury free
Project Milestones
Crusher Station
Milestone Planned Date Status
Engineering Complete Nov 2015 Completed on Schedule
Commence Civil Works Nov 2015 Completed on Schedule
Charter Vessel Arrives in
DakarDec 2015 Completed on Schedule
Complete Screen Civils Dec 2015
Delayed by 4 weeks due to lower than
specified concrete strengths which
required the removal and
reinstatement of 70m3 of concrete
Commence SMP Works Jan 2016 Completed on Schedule
Complete Screening CSMP Apr 2016 Currently on Schedule
Complete Conveyors CSMP Jun 2016 Currently on Schedule
Complete Crusher CSMP Aug 2016 Currently on Schedule
Complete E, I and C Sep 2016 Currently on Schedule
Complete C2
CommissioningOct 2016 Currently on Schedule

22
HEAP LEACH ENGINEERING STUDY: PAD DESIGN

23
HEAP LEACH ENGINEERING STUDY: THOROUGH METALLURGICAL TESTING

24
HEAP LEACH ENGINEERING STUDY: OPERATING CONCEPT
• Rate: 2.5 Mtpa
• Includes ROM stockpiles
• Stack height: 8 metres
• In-situ density: 1.32 - 1.73 t/m3
• Solution application rate: 10-15 L/h/m2
• Solution application total: 2.5 t-sol/t-ore
• Leach cycle: 120 - 150 days
HL MaterialCement Au Rec NaCN Density
kg/t % kg/t t/m3
Oxide Hard 8 83 0.35 1.37
Oxide Soft (Masato) 8 87 0.35 1.34
Oxide Soft (Niakafiri) 16 88 0.35 1.34
Oxide Saprolite 16 84 0.3 1.39
ROM Fresh Stockpile H* 4 53 0.45 1.67
ROM Fresh Stockpile I* 4 52 0.35 1.67
ROM Transition Stockpile H 8 70 0.47 1.49
ROM Transition Stockpile I 4 65 0.39 1.73
Blends Calculated based on Blend Ratio
Heap Leach Flow Sheet
* Minimal use in Heap Leach plan

25
HEAP LEACH ENGINEERING STUDY: SUMMARY
• Pre-feasibility study
– phase 2 optimization completed in Q4 2015
– documentation and final capital estimate in Q1 2016
• Technically viable for processing Sabodala low-grade ore
• Ore recovery range:
– oxide 78% - 83%;
– transition 61% - 66%
• Approximately 24 months to permit and construct
• Potential to increase annual production by 10% - 20%
Decision to proceed with heap leaching requires additional low-grade reserves
and finalized project economics that exceed Teranga’s internal rate of return hurdle of 20%
Process operating costs over LOM $7-$8/t or $500/oz
Capital cost based on the optimized
phase 2 trade off studies and
subsequent design criteria
~$50M

26
EXPLORATION: RESERVE DEVELOPMENT PROGRAM ON 291KM2 MINE LICENSE
Focus is on conversion of resources and extensions of existing deposits along strike on the Sabodala mine licenses –
multi-year development program to add higher grade mill material and lower grade for potential heap leach
Goumbati West
Drilling & Trenching
Program
Goumbati East Vein
Drilling
Drilling & Trenching
Program
Golouma Northern
Sector
Drilling & Trenching
Program
Kinemba (Sofia Trend)
Drilling & Trenching
Program

27
EXPLORATION: FOCUSED ON BIG TARGETS ON REGIONAL LAND PACKAGE
Regional Land Package Exploration
• 2016 prospects and programs locality plan
• 8 exploration permits encompassing
approximately 1,000km² of land surrounding
the Sabodala mine license
• Larger budget to accelerate regional
exploration
Soreto-Soreto North
DDH Drilling Program +
Trenching
Cinnamon North Prospect
Trenching & DDH Drilling Program
Leoba-Lerinde Granite
DDH Program
+Trenching
Leocounda Prospect
DDH Drilling Program +
Trenching
Marougou Prospect
DDH Drilling Program
Nienienko Main
RC Drilling Program
Marougou West Prospect
Trenching + DDH Drilling
Program
Bransan
Trenching & Drilling
Program
KA Prospect
DDH Drilling Program

INCREASING LIFE OF MINE CASH FLOWS
29
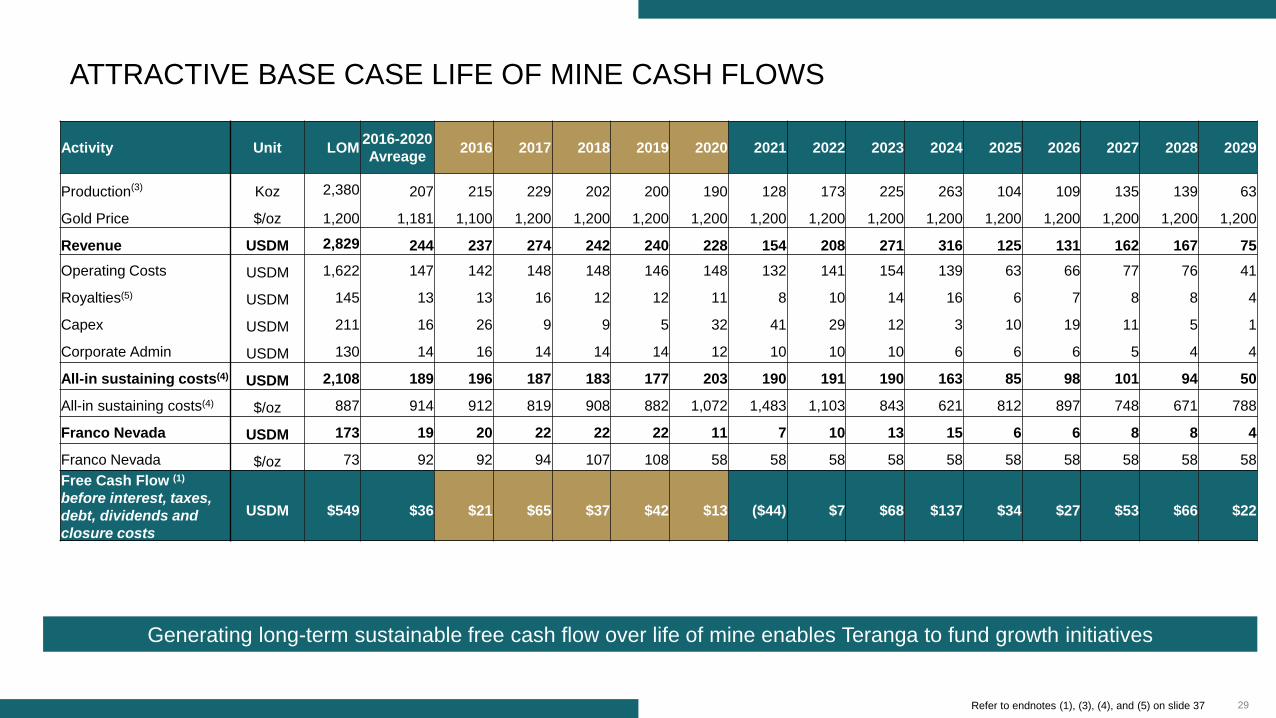
ATTRACTIVE BASE CASE LIFE OF MINE CASH FLOWS
Activity Unit LOM2016-2020
Avreage2016 2017 2018 2019 2020 2021 2022 2023 2024 2025 2026 2027 2028 2029
Production(3) Koz 2,380 207 215 229 202 200 190 128 173 225 263 104 109 135 139 63
Gold Price $/oz 1,200 1,181 1,100 1,200 1,200 1,200 1,200 1,200 1,200 1,200 1,200 1,200 1,200 1,200 1,200 1,200
Revenue USDM 2,829 244 237 274 242 240 228 154 208 271 316 125 131 162 167 75
Operating Costs USDM 1,622 147 142 148 148 146 148 132 141 154 139 63 66 77 76 41
Royalties(5) USDM 145 13 13 16 12 12 11 8 10 14 16 6 7 8 8 4
Capex USDM 211 16 26 9 9 5 32 41 29 12 3 10 19 11 5 1
Corporate Admin USDM 130 14 16 14 14 14 12 10 10 10 6 6 6 5 4 4
All-in sustaining costs(4) USDM 2,108 189 196 187 183 177 203 190 191 190 163 85 98 101 94 50
All-in sustaining costs(4) $/oz 887 914 912 819 908 882 1,072 1,483 1,103 843 621 812 897 748 671 788
Franco Nevada USDM 173 19 20 22 22 22 11 7 10 13 15 6 6 8 8 4
Franco Nevada $/oz 73 92 92 94 107 108 58 58 58 58 58 58 58 58 58 58
Free Cash Flow (1)
before interest, taxes,
debt, dividends and
closure costs
USDM $549 $36 $21 $65 $37 $42 $13 ($44) $7 $68 $137 $34 $27 $53 $66 $22
Generating long-term sustainable free cash flow over life of mine enables Teranga to fund growth initiatives
Refer to endnotes (1), (3), (4), and (5) on slide 37

Lowering costs
Increasing mill throughput
Increasing long-term sustainable free cash flow(1)
UPDATED LIFE OF MINE: HIGHLIGHTS
Refer to endnote (1) on slide 37

APPENDICES

32
COMPETENT AND QUALIFIED PERSONS STATEMENTThe technical information contained in this document relating to the open pit mineral reserve estimates is based on, and fairly represents, information compiled by Mr. William Paul Chawrun, P. Eng who is
a member of the Professional Engineers Ontario, which is currently included as a "Recognized Overseas Professional Organization" in a list promulgated by the ASX from time to time. Mr. Chawrun is a
full time employee of Teranga and is not "independent" within the meaning of National Instrument 43-101. However, he is a "Qualified Person" as defined in NI 43-101. Mr. Chawrun has sufficient
experience which is relevant to the style of mineralization and type of deposit under consideration and to the activity which he is undertaking to qualify as a Competent Person as defined in the 2012
Edition of the "Australasian Code for Reporting of Exploration Results, Mineral Resources and Ore Reserves". Mr. Chawrun is a "Qualified Person" under National Instrument 43-101 Standards of
Disclosure for Mineral Projects. Mr. Chawrun has consented to the inclusion in this Report of the matters based on his compiled information in the form and context in which it appears in this Report.
The technical information contained in this Report relating to mineral resource estimates is based on, and fairly represents, information compiled by Ms. Patti Nakai-Lajoie. Ms. Nakai-Lajoie, P. Geo., is a
Member of the Association of Professional Geoscientists of Ontario, which is currently included as a "Recognized Overseas Professional Organization" in a list promulgated by the ASX from time to time.
Ms. Nakai-Lajoie is a full time employee of Teranga and is not "independent" within the meaning of National Instrument 43-101. Ms. Nakai-Lajoie has sufficient experience which is relevant to the style of
mineralization and type of deposit under consideration and to the activity which she is undertaking to qualify as a Competent Person as defined in the 2012 Edition of the "Australasian Code for Reporting
of Exploration Results, Mineral Resources and Ore Reserves". Ms. Nakai-Lajoie is a "Qualified Person" under National Instrument 43-101 Standards of Disclosure for Mineral Projects. Ms. Nakai-Lajoie
has consented to the inclusion in this Report of the matters based on her compiled information in the form and context in which it appears in this Report.
Teranga's exploration programs are being managed by Peter Mann, FAusIMM. Mr. Mann is a full time employee of Teranga and is not "independent" within the meaning of National Instrument 43-101. Mr.
Mann has sufficient experience which is relevant to the style of mineralization and type of deposit under consideration and to the activity which he is undertaking to qualify as a Competent Person as
defined in the 2012 Edition of the "Australasian Code for Reporting of Exploration Results, Mineral Resources and Ore Reserves". Mr. Mann is a "Qualified Person" under National Instrument 43-101
Standards of Disclosure for Mineral Projects. The technical information contained in this news release relating exploration results are based on, and fairly represents, information compiled by Mr. Mann.
Mr. Mann has verified and approved the data disclosed in this release, including the sampling, analytical and test data underlying the information. The RC samples are prepared at site and assayed in the
SGS laboratory located at the site. Analysis for diamond drilling is sent for fire assay analysis at ALS Johannesburg, South Africa. Mr. Mann has consented to the inclusion in this news release of the
matters based on his compiled information in the form and context in which it appears herein.
The technical information contained in this document relating to the underground ore reserves estimates is based on, and fairly represents, information compiled by Jeff Sepp, P. Eng who is a member of
the Professional Engineers Ontario, which is currently included as a "Recognized Overseas Professional Organization" in a list promulgated by the ASX from time to time. Mr. Sepp is independent of
Teranga and is a "Qualified Person" as defined in NI 43-101 and a "competent person" as defined in the 2012 Edition of the "Australasian Code for Reporting of Exploration Results, Mineral Resources
and Ore Reserves". Mr. Sepp has sufficient experience relevant to the style of mineralization and type of deposit under consideration and to the activity he is undertaking to qualify as a Competent Person
as defined in the 2012 Edition of the "Australasian Code for Reporting of Exploration Results, Mineral Resources and Ore Reserves". Mr. Sepp has consented to the inclusion in this Report of the matters
based on his compiled information in the form and context in which it appears in this Report.
Teranga's disclosure of mineral reserve and mineral resource information is governed by NI 43-101 under the guidelines set out in the Canadian Institute of Mining, Metallurgy and Petroleum (the "CIM")
Standards on Mineral Resources and Mineral Reserves, adopted by the CIM Council, as may be amended from time to time by the CIM ("CIM Standards"). CIM definitions of the terms "mineral reserve",
"proven mineral reserve", "probable mineral reserve", "mineral resource", "measured mineral resource", "indicated mineral resource" and "inferred mineral resource", are substantially similar to the 2012
JORC Code corresponding definitions of the terms "ore reserve", "proved ore reserve", "probable ore reserve", "mineral resource", "measured mineral resource", "indicated mineral resource" and "inferred
mineral resource", respectively. Estimates of mineral resources and mineral reserves prepared in accordance with the 2012 JORC Code would not be materially different if prepared in accordance with
the CIM definitions applicable under NI 43-101. There can be no assurance that those portions of mineral resources that are not mineral reserves will ultimately be converted into mineral reserves.

33
OPEN PIT AND UNDERGROUND MINERAL RESOURCES SUMMARY(6)
As at December 31, 2015
Notes for Mineral Resources Summary
1. CIM definitions were followed for Mineral Resources.
2. Open pit oxide Mineral Resources are estimated at a cut-off grade of
0.35 g/t Au, except for Gora at 0.48 g/t Au.
3. Open pit transition and fresh rock Mineral Resources are estimated at a
cut-off grade of 0.40 g/t Au, except for Gora at 0.55 g/t Au.
4. Underground Mineral Resources are estimated at a cut-off grade of
2.00 g/t Au.
5. Measured Resources at Sabodala include stockpiles which total 9.2 Mt
at 0.77 g/t Au for 229,000 oz...
6. Measured Resources at Gora include stockpiles which total 0.1 Mt at
1.30 g/t Au for 6,000 oz...
7. Measured Resources at Masato include stockpiles which total 5.9 Mt at
0.79 g/t Au for 150,000 oz...
8. High grade assays were capped at grades ranging from 1.5 g/t Au to
110 g/t Au.
9. The figures above are “Total” Mineral Resources and include Mineral
Reserves.
10. Open pit shells were used to constrain open pit resources.
11. Mineral Resources are estimated using a gold price of US$1,450 per
ounce.
12. Sum of individual amounts may not equal due to rounding.
Deposit Domain
Measured Indicated Measured and Indicated Inferred
Tonnes Grade Au Tonnes Grade Au Tonnes Grade Au Tonnes Grade Au
('000s) (g/t Au) ('000s) ('000s) (g/t Au) ('000s) ('000s) (g/t Au) ('000s) ('000s) (g/t Au) ('000s)
Sabodala
Open Pit 13,742 1.13 497 6,488 1.59 332 20,230 1.28 829 2,525 1.23 100
Underground 1,631 3.65 191 1,631 3.65 191 460 3.60 53
Combined 13,742 1.13 497 8,119 2.01 524 21,861 1.45 1,021 2,985 1.60 153
Gora
Open Pit 466 4.55 68 1,083 6.11 213 1,549 5.64 281 53 4.95 8
Underground 315 5.14 52 315 5.14 52 59 4.83 9
Combined 466 4.55 68 1,398 5.89 265 1,864 5.56 333 113 4.88 18
Niakafiri
Open Pit 4,909 1.33 210 7,222 0.98 228 12,131 1.12 438 2,472 1.09 87
Underground 184 2.51 15
Combined 4,909 1.33 210 7,222 0.98 228 12,131 1.12 438 2,656 1.19 102
Masato
Open Pit 5,894 0.79 150 22,617 1.16 844 28,511 1.08 994
Underground 1,163 2.75 103 1,163 2.75 103 1,984 2.85 182
Combined 5,894 0.79 150 23,780 1.24 947 29,674 1.15 1,097 1,984 2.85 182
Golouma
Open Pit 6,800 2.98 653 6,800 2.98 653 88 2.46 7
Underground 2,134 4.09 280 2,134 4.09 280 854 3.66 100
Combined 8,934 3.25 933 8,934 3.25 933 942 3.55 107
Kerekounda
Open Pit 1,255 4.28 173 1,255 4.28 173
Underground 499 4.88 78 499 4.88 78 235 5.70 43
Combined 1,755 4.45 251 1,755 4.45 251 235 5.70 43
Maki Medina
Open Pit 2,112 1.22 83 2,112 1.22 83 114 0.81 3
Underground 109 2.71 10 109 2.71 10 85 2.54 7
Combined 2,221 1.30 93 2,221 1.30 93 199 1.55 10
Niakafiri SW
Open Pit 770 0.81 20 770 0.81 20 30 0.67 1
Underground
Combined 770 0.81 20 770 0.81 20 30 0.67 1
Niakafiri SE
Open Pit 4,439 0.98 140 4,439 0.98 140 162 0.96 5
Underground 73 2.60 6 73 2.60 6 16 2.64 1
Combined 4,512 1.01 146 4,512 1.01 146 177 1.11 6
Others
Open Pit 1,590 1.80 92 1,590 1.80 92 4,890 1.26 198
Underground 59 9.15 18 59 9.15 18 1,045 3.68 124
Combined 1,649 2.07 110 1,649 2.07 110 5,935 1.69 322
Total
Open Pit 25,011 1.15 926 54,377 1.59 2,777 79,388 1.45 3,703 10,333 1.23 409
Underground 5,985 3.84 738 5,985 3.84 738 4,921 3.38 534
Combined 25,011 1.15 926 60,362 1.81 3,516 85,373 1.62 4,441 15,254 1.92 944
Refer to endnote (6) on slide 37

34
OPEN PIT AND UNDERGROUND MINERAL RESERVES SUMMARY(7)
As at December 31, 2015
Notes for Mineral Reserves Summary
1. CIM definitions were followed for Mineral Reserves.
2. Mineral Reserve cut off grades for range from are 0.35 g/t to 0.63 g/t Au
for oxide and 0.42 g/t to 0.73 g/t Au for fresh based on a $1,100/oz gold
price
3. Mineral Reserve cut off grades for Sabodala 0.45 g/t for oxide and 0.55 g/t
for fresh based on a $1,100/oz gold price
4. Underground reserves cut-off grades ranged from 2.3-2.6 g/t based on
$1,200/oz gold price
5. Sum of individual amounts may not equal due to rounding.
6. The Niakafiri Main deposit is adjacent to the Sabodala village and relocation
of at least some portion of the village will be required which will necessitate a
negotiated resettlement program with the affected community members..
Deposits
Proven Probable Proven and Probable
Tonnes
(Mt)
Grade
(g/t)
Au
(Moz)
Tonnes
(Mt)
Grade
(g/t)
Au
(Moz)
Tonnes
(Mt)
Grade
(g/t)
Au
(Moz)
Sabodala 1.57 1.57 0.08 2.33 1.36 0.10 3.90 1.44 0.18
Gora 0.31 4.94 0.05 1.15 4.74 0.17 1.46 4.78 0.22
Niakafiri Main 4.06 1.23 0.16 3.41 0.94 0.10 7.47 1.10 0.26
Subtotal ML 5.95 1.52 0.29 6.88 1.71 0.38 12.83 1.62 0.67
Masato 21.41 1.06 0.73 21.41 1.06 0.73
Golouma West 3.23 1.96 0.20 3.23 1.96 0.20
Golouma South 1.27 3.09 0.13 1.27 3.09 0.13
Kerekounda 0.79 3.44 0.09 0.79 3.44 0.09
Maki Medina 0.90 1.17 0.03 0.90 1.17 0.03
Niakafiri SE 1.12 1.09 0.04 1.12 1.09 0.04
Niakafiri SW 0.37 0.92 0.01 0.37 0.92 0.01
Subtotal SOMIGOL - - - 29.08 1.32 1.23 29.08 1.32 1.23
Subtotal Open Pit 5.95 1.52 0.29 35.96 1.39 1.61 41.92 1.41 1.90
Golouma West 1 0.62 6.07 0.12 0.62 6.07 0.12
Golouma West 2 0.45 4.39 0.06 0.45 4.39 0.06
Golouma South 0.47 4.28 0.06 0.47 4.28 0.06
Kerekounda 0.61 4.95 0.10 0.61 4.95 0.10
Subtotal Underground 0.00 0.00 - 2.15 5.01 0.35 2.15 5.01 0.35
Total 5.95 1.52 0.29 38.11 1.60 1.96 44.07 1.59 2.25
Stockpiles 15.27 0.79 0.39 0.00 0.00 0.00 15.27 0.79 0.39
Total Including Stockpile 21.23 0.99 0.68 38.11 1.60 1.96 59.34 1.38 2.63
Refer to endnote (7) on slide 37

35
UPDATED LIFE OF MINE SCHEDULE
Notes:
*The schedule summarizes Niakafiri from
“Niakafiri Main” and “Niakafiri SE”. The portion of
Niakafiri SE to be mined lies outside of the
Sabodala Village area and assumes relocation is
not required.
The estimated ore reserves underpinning the
production targets set out in the following table,
have been prepared by Mr. Paul Chawrun, who is
a Competent Person, in accordance with the
requirements of the 2012 JORC Code.
This production guidance is based on existing
proven and probable ore reserves from the
Sabodala mining license as at December 31,
2015
Stockpile balances at January 1, 2016 included
15.3 Mt at 0.79 g/t for 0.39 million contained
ounces
LOM
2016 -
2020
Average
2016 2017 2018 2019 2020 2021 2022 2023 2024 2025 2026 2027 2028 2029
Sabodala
Ore Mined Mt 3.9 0.3 1.5 2.0
Ore Grade 1.44 1.11 1.33 1.58
Contained Oz Moz 0.18 0.01 0.07 0.10
Waste Mt 31.0 11.1 15.0 5.0
Masato
Ore Mined Mt 21.4 0.5 0.7 0.4 1.1 2.8 5.0 4.3 6.7
Ore Grade g/t 1.06 1.10 0.74 0.70 0.86 0.93 1.00 1.02 1.27
Contained Oz Moz 0.73 0.02 0.02 0.01 0.03 0.09 0.16 0.14 0.27
Waste Mt 110.2 0.2 16.2 5.8 19.4 27.2 21.5 11.6 8.2
Gora
Ore Mined Mt 1.5 0.7 0.7 0.1
Ore Grade g/t 4.78 4.00 5.15 7.90
Contained Oz Moz 0.22 0.08 0.12 0.02
Waste Mt 32.2 17.9 14.1 0.2
Kerekounda
Ore Mined Mt 0.8 0.0 0.5 0.3
Ore Grade g/t 3.44 0.99 3.39 3.74
Contained Oz Moz 0.09 0.00 0.06 0.03
Waste Mt 18.2 3.6 13.0 1.6
Golouma
Ore Mined Mt 4.5 1.2 0.9 2.4 0.1
Ore Grade g/t 2.28 3.08 1.98 1.99 2.24
Contained Oz Moz 0.33 0.12 0.06 0.15 0.00
Waste Mt 49.6 14.8 18.4 16.4 0.0
Niakafiri*
Ore Mined Mt 9.0 1.5 4.0 3.5
Ore Grade g/t 1.09 1.05 1.10 1.10
Contained Oz Moz 0.31 0.05 0.14 0.12
Waste Mt 26.6 6.2 12.5 7.9
Maki Medina
Ore Mined Mt 0.9 0.9
Ore Grade g/t 1.17 1.17
Contained Oz Moz 0.03 0.03
Waste Mt 2.9 2.9
Underground
Ore Mined Mt 2.1 0.1 0.3 0.3 0.3 0.1 0.2 0.4 0.4 0.2
Ore Grade g/t 5.01 5.00 4.95 4.63 4.33 4.39 5.55 5.36 5.52 4.76
Contained Oz Moz 0.35 0.02 0.05 0.05 0.04 0.01 0.03 0.06 0.07 0.02
Summary
Ore Mined Mt 44.1 3.1 2.3 1.6 3.4 4.7 3.5 3.0 5.3 8.6 10.4 0.1 0.2 0.4 0.4 0.2
Ore Grade g/t 1.59 1.94 2.91 3.74 1.51 1.42 1.63 1.09 1.22 1.20 1.29 4.39 5.55 5.36 5.52 4.76
Contained Oz Moz 2.25 0.20 0.22 0.19 0.17 0.22 0.19 0.10 0.21 0.33 0.43 0.01 0.03 0.06 0.07 0.02
Waste Mt 270.7 36.3 36.4 38.2 35.9 35.4 35.8 27.2 21.5 24.2 16.1
Movement Mt 314.7 39.5 38.7 39.8 39.3 40.1 39.4 30.2 26.8 32.8 26.5 0.1 0.2 0.4 0.4 0.2
Stockpile Ore
BalanceMt
13.7 11.1 10.1 10.4 9.4 7.9 8.7 12.9 18.9 14.5 10.2 6.2 2.1
Stockpile Grade g/t 0.82 0.84 0.76 0.73 0.70 0.68 0.67 0.66 0.68 0.66 0.66 0.66 0.66
Contained Oz Moz 0.36 0.30 0.25 0.24 0.21 0.17 0.19 0.27 0.41 0.31 0.22 0.13 0.04
Ore Milled Mt 59.3 4.3 3.9 4.2 4.5 4.5 4.5 4.5 4.4 4.5 4.4 4.4 4.4 4.4 4.4 2.3
Head Grade g/t 1.38 1.66 1.93 1.85 1.56 1.54 1.46 0.99 1.35 1.73 2.06 0.82 0.85 1.06 1.09 0.94
Oxide % 21% 27% 37% 25% 26% 31% 19% 28% 16% 29% 0% 17% 19% 18% 18% 18%
Produced Oz Moz 2.376 0.207 0.215 0.229 0.202 0.200 0.190 0.128 0.173 0.225 0.263 0.104 0.109 0.135 0.139 0.063

36
UPDATED LIFE OF MINE CAPITAL EXPENDITURES
Sustaining Capex Unit LOM2016-2020
AVG2016 2017 2018 2019 2020 2021 2022 2023 2024 2025 2026 2027 2028 2029
Open Pit Mining USDM 29.9 3.7 4.9 3.5 4.0 1.5 4.7 6.0 3.0 1.5 0.8 - - - - -
Underground Mining USDM - - - - - - - - - - - - - - - -
Processing USDM 18.9 2.1 2.4 2.0 2.0 2.0 2.0 2.0 2.0 1.0 1.0 1.0 0.5 0.5 0.5 -
Admin & Other Sustaining USDM 8.8 1.3 2.8 1.0 1.0 1.0 0.5 0.5 0.5 0.3 0.3 0.3 0.3 0.3 0.3
-
Community Relations USDM 25.0 0.2 1.0 - - - - 2.0 15.0 7.0 - - - - - -
Total Sustaining Capex USDM 82.5 7.2 11.0 6.5 7.0 4.5 7.2 10.5 20.5 9.8 2.1 1.3 0.8 0.8 0.8 -
Capital Projects & Development
OJVG & Gora Development USDM 4.3 0.9 3.3 0.8 0.3 - - - - - - - - - - -
Underground Equipment &
DevelopmentUSDM 102.1 4.9 - - - - 24.4 23.4 8.9 2.4 0.8 8.5 18.2 10.4 4.1 0.9
Other Projects & Development USDM 21.8 2.9 11.3 1.9 1.4 - - 7.2 - - - - - - - -
Total Projects and Development USDM 128.2 8.7 14.6 2.7 1.7 - 24.4 30.6 8.9 2.4 0.8 8.5 18.2 10.4 4.1 0.9
Combined Total (USDM) USDM 210.8 15.9 25.7 9.2 8.7 4.5 31.6 41.1 29.4 12.2 2.9 9.8 18.9 11.1 4.9 0.9
37
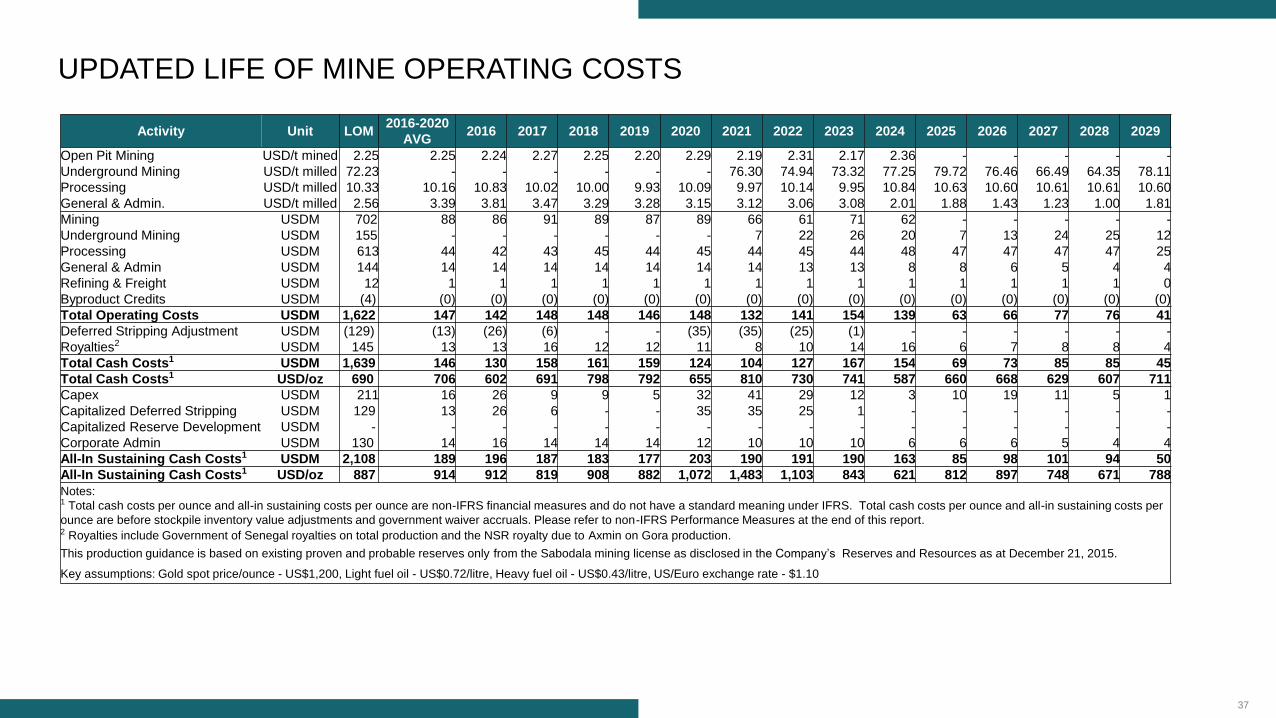
UPDATED LIFE OF MINE OPERATING COSTS
Activity Unit LOM2016-2020
AVG2016 2017 2018 2019 2020 2021 2022 2023 2024 2025 2026 2027 2028 2029
Open Pit Mining USD/t mined 2.25 2.25 2.24 2.27 2.25 2.20 2.29 2.19 2.31 2.17 2.36 - - - - -
Underground Mining USD/t milled 72.23 - - - - - - 76.30 74.94 73.32 77.25 79.72 76.46 66.49 64.35 78.11
Processing USD/t milled 10.33 10.16 10.83 10.02 10.00 9.93 10.09 9.97 10.14 9.95 10.84 10.63 10.60 10.61 10.61 10.60
General & Admin. USD/t milled 2.56 3.39 3.81 3.47 3.29 3.28 3.15 3.12 3.06 3.08 2.01 1.88 1.43 1.23 1.00 1.81
Mining USDM 702 88 86 91 89 87 89 66 61 71 62 - - - - -
Underground Mining USDM 155 - - - - - - 7 22 26 20 7 13 24 25 12
Processing USDM 613 44 42 43 45 44 45 44 45 44 48 47 47 47 47 25
General & Admin USDM 144 14 14 14 14 14 14 14 13 13 8 8 6 5 4 4
Refining & Freight USDM 12 1 1 1 1 1 1 1 1 1 1 1 1 1 1 0
Byproduct Credits USDM (4) (0) (0) (0) (0) (0) (0) (0) (0) (0) (0) (0) (0) (0) (0) (0)
Total Operating Costs USDM 1,622 147 142 148 148 146 148 132 141 154 139 63 66 77 76 41
Deferred Stripping Adjustment USDM (129) (13) (26) (6) - - (35) (35) (25) (1) - - - - - -
Royalties2 USDM 145 13 13 16 12 12 11 8 10 14 16 6 7 8 8 4
Total Cash Costs1 USDM 1,639 146 130 158 161 159 124 104 127 167 154 69 73 85 85 45
Total Cash Costs1 USD/oz 690 706 602 691 798 792 655 810 730 741 587 660 668 629 607 711
Capex USDM 211 16 26 9 9 5 32 41 29 12 3 10 19 11 5 1
Capitalized Deferred Stripping USDM 129 13 26 6 - - 35 35 25 1 - - - - - -
Capitalized Reserve Development USDM - - - - - - - - - - - - - - - -
Corporate Admin USDM 130 14 16 14 14 14 12 10 10 10 6 6 6 5 4 4
All-In Sustaining Cash Costs1 USDM 2,108 189 196 187 183 177 203 190 191 190 163 85 98 101 94 50
All-In Sustaining Cash Costs1 USD/oz 887 914 912 819 908 882 1,072 1,483 1,103 843 621 812 897 748 671 788
Notes:1 Total cash costs per ounce and all-in sustaining costs per ounce are non-IFRS financial measures and do not have a standard meaning under IFRS. Total cash costs per ounce and all-in sustaining costs per
ounce are before stockpile inventory value adjustments and government waiver accruals. Please refer to non-IFRS Performance Measures at the end of this report.2 Royalties include Government of Senegal royalties on total production and the NSR royalty due to Axmin on Gora production.
This production guidance is based on existing proven and probable reserves only from the Sabodala mining license as disclosed in the Company’s Reserves and Resources as at December 21, 2015.
Key assumptions: Gold spot price/ounce - US$1,200, Light fuel oil - US$0.72/litre, Heavy fuel oil - US$0.43/litre, US/Euro exchange rate - $1.10

38
ENDNOTES
1. Free cash flow and free cash flow per ounce are defined as operating cash flow (excluding one-time transaction costs related to the acquisition of the OJVG) less capital expenditures.
2. Mineral Reserves and Mineral Resources estimates as at December 31, 2015 as per Company disclosure. For more information regarding Teranga Gold’s Mineral Reserves and
Resources, please refer to the Teranga Gold’s Fourth Quarter ASX Report titled “Teranga Outperforms Cost Guidance” issued January 28, 2016 accessible on the Company's website at
www.terangagold.com.
3. This production guidance is based on existing proven and probable reserves only from the Sabodala mining license as disclosed in Appendix 2 of Teranga Gold’s 2015 Fourth Quarter ASX
Report titled “Teranga Outperforms Cost Guidance” issued January 28, 2016 accessible on the Company's website at www.terangagold.com. The estimated ore reserves underpinning this
production guidance have been prepared by a competent person in accordance with the requirements of the 2012 Australasian Code for Reporting of Exploration Results, Mineral
Resources and Ore Reserves (the “2012 JORC Code”). Please refer to the Competent Persons Statement available in the ASX Report referenced above.
4. All-in sustaining costs per ounce is a non-IFRS financial measures and does not have a standard meaning under IFRS. All-in sustaining costs per ounce is before stockpile inventory value
adjustments and government waiver accruals. Please refer to non-IFRS Performance Measures in the Company’s MD&A.
5. Royalties include Government of Senegal royalties on total production and the NSR royalty due to Axmin on Gora production.
6. There have been no revisions to the resource models for 2015, except for adjustments due to mining depletion and minor revisions to Niakafiri Main, Niakafiri SW, Maki Medina and
Diadiako. For estimating 2015 Mineral Resources, Teranga has implemented a new reporting procedure, which includes the use of open pit shells to constrain open pit resources and
reporting underground resources separately. For reporting of open pit Mineral Resources, open pit shells were produced for each of the resource models using Whittle open pit optimization
software. Only classified blocks greater than or equal to the open pit cut-off grades and within the open pit shells were reported. This is in compliance with the CIM (2014) resource
definition requirement of “reasonable prospects for eventual economic extraction”. For reporting of underground Mineral Resources, only classified blocks greater than or equal to the
underground cut-off grade outside of the open pit shells were reported. This is in compliance with CIM (2014) resource definition requirements. In addition, Deswik Stope Optimizer
software was used to generate wireframe models to constrain blocks satisfying minimum size and continuity criteria, which were used for reporting Sabodala underground Mineral
Resources. The significant change between the Mineral Resources reported for 2014 and 2015 is due to this new reporting procedure, where the 2015 year end Mineral Resources have
been constrained using open pit shells along with revised gold cut-off grades for both open pit and underground resources. Previously classified Mineral Resources that do not satisfy the
revised reporting criteria for 2015 have been excluded, however, remain in the block models as mineralized material.
7. This estimated ore reserves underpinning the production targets (as defined in the ASX Listing Rules), have been prepared by Mr. Paul Chawrun, who is a Competent Person, in
accordance with the requirements of the 2012 JORC Code. This production guidance is based on existing proven and probable ore reserves from the Sabodala mining license as at
December 31, 2015. The complete table of ore reserves are accessible in Teranga Gold’s Fourth Quarter ASX Report titled “Teranga Outperforms Cost Guidance” issued January 28, 2016
accessible on the Company's website at www.terangagold.com.